1 卡尔曼滤波器基本原理
卡尔曼滤波常用于动态多变化系统中的状态估计,是一种通用性强的自回归滤波器。它的由来和NASA登月有关。其发明者鲁道夫.E.卡尔曼在一次访问NASA的时候,发现阿波罗计划中一个难点是轨道预测问题,因而提出了一种滤波器,可以帮助高效预测轨迹,辅助导航。NASA最终使用了这个滤波器,然后成功实现人类第一次登月计划。卡尔曼滤波器由此得名。
卡尔曼滤波器可以用来估计不确定信息,并给出状态量下一时刻的情况。即便在有噪声干扰的情况下,也可以较好的预测下一状态的情况,并找出多变量间不易察觉的相关性。因而卡尔曼滤波器可以很好适应不断变化的系统,并且内存占用量低,推理速度快,比较适合资源受限制的场景。
对于一个离散系统,其离散状态方程描述为:

其中u(k)是系统控制输入,w(k)是系统随机噪声。假设输出y(k)其测量值为z(k)。
则实施卡尔曼滤波器的步骤为:
1 初始化矩阵P,Q,R
其中P和Q是与转移矩阵A同秩的协方差方阵,R是1X1维的常量。
2 对于观测的每一拍k执行预测和更新操作:
Step1:按照状态方程计算新的状态变量X(k+1)

Step2:更新协方差矩阵P(k)

Step3:计算卡尔曼增益K(k+1)

Step4:利用测量值z(k)来更新状态变量X(k+1)

Step5:更新协方差矩阵P(k+1)

2 卡尔曼实例
假设有一辆小车,装有加速度传感器,可以测量小车的加速度a。并装有超声光学传感器,可以实时测量光从光源到达小车的时间Zt。采样时间间隔Ts,光速为c。请估计小车的速度和位置。
对于这个例子,设状态变量为位置s和速度v。设控制变量u为加速度a。输出变量设置为观测时间Zt。根据关系式:
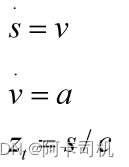
则可以写出如下状态方程:

用Ts采样时间离散化后状态方程为:

3 Python程序实现及仿真结果
import numpy as np
from matplotlib import pyplot as plt


C = 100  # velocity of light, just a simulation value
# generate perfect acceleration and corresponding velocity and distance
# 生成没有噪声的加速度信号,并用积分计算出对应的速度和距离 ---------------------------------
N_steps = 1000  # 1000 steps to estimate
Ts = 0.05  # time interval is 0.05s
timeline = np.arange(N_steps) * Ts  # \Delta t = 0.05s
accs_gt = np.sin(timeline)  # set accelerator as a log shape
vels_gt = np.cumsum(accs_gt*Ts)  # get the ground truth velocity;速度是加速度的积分
dists_gt = np.cumsum(vels_gt*Ts)  # get the ground truth distance; 距离是速度的积分
zs_gt = dists_gt/C
#----------------------------------

# add noise to acceleration signals and calculate the velocity and distance with simple integral
# 往加速度信号添加噪声模拟真实传感器信号,并用简单的积分计算速度和距离
accs_noise_var = 0.005  # set acceleration noise variation as 0.5
accs_noise = np.random.rand(N_steps) * accs_noise_var  # 注意,这里使用均匀分布模拟噪声,以模拟不知道真实噪声分布情况
accs_w_noise = accs_gt + accs_noise
vels_w_noise = np.cumsum(accs_w_noise*Ts)
# vels_w_noise = np.cumsum(accs_noise * Delta_t)
dists_w_noise = np.cumsum(vels_w_noise*Ts)
zs_noise_var = 0.001
zs_noise = np.random.rand(N_steps) * zs_noise_var  # 注意,这里使用均匀分布模拟噪声,以模拟不知道真实噪声分布情况
zs_w_noise = zs_gt + zs_noise
#---------------------------------
VIS_DATA = True
if VIS_DATA:
    fig = plt.figure()
    ax11 = fig.add_subplot(421)
    ax11.plot(timeline, accs_gt)
    ax11.set_title("Acceleration Ground Truth")

    ax12 = fig.add_subplot(422)
    ax12.plot(timeline, accs_w_noise)
    ax12.set_title("Acceleration With Noise")


    ax21 = fig.add_subplot(423)
    ax21.plot(timeline, vels_gt)
    ax21.set_title("Velocity Ground Truth")

    ax22 = fig.add_subplot(424)
    ax22.plot(timeline, vels_w_noise)
    ax22.set_title("Velocity With Noise")


    ax31 = fig.add_subplot(425)
    ax31.plot(timeline, dists_gt)
    ax31.set_title("Distance Ground Truth")

    ax32 = fig.add_subplot(426)
    ax32.plot(timeline, dists_w_noise)
    ax32.set_title("Distance With Noise")

    ax41 = fig.add_subplot(427)
    ax41.plot(timeline, zs_gt)
    ax41.set_title("Measurment Ground Truth")

    ax42 = fig.add_subplot(428)
    ax42.plot(timeline, zs_w_noise)
    ax42.set_title("Measurment With Noise")
    # plt.show()
    plt.subplots_adjust(wspace =0, hspace =0.5)#调整子图间距

# ------------------------------------------------------------------------------------------

A = np.array([
    [1, Ts],
    [0, 1]
])  # 状态转移矩阵
B = np.array([
    [Ts**2*0.5],
    [Ts]
])  # 控制转移矩阵
Q_var = 0.005
Q = np.array([
    [Q_var, 0],
    [0, Q_var]
])  # 预测噪声协方差矩阵
P0 = np.array([
    [0.0, 0],
    [0.0, 0]
])  # 状态向量协方差初始值
H = np.array([
1/C, 0
]).reshape((1,2))  # 测量转换矩阵
R_var = 0.001
R = R_var  # 测量协方差矩阵,此时只有一个测量变量,因此只有一个值

x0 = np.array([
    [0],
    [0]
])  # 系统状态向量初始化,速度和距离均初始化为0

x_t_ = None  # predicted system state vector
x_t = None  # corrected system state vector
P_t_ = None  # covariance matrix of predicted state vector
P_t = None  # covariance matrix of corrected state vector
K = None

est_vel = [0]
est_dist = [0]
for i in range(N_steps):
    if i == 0:
        x_t = x0
        P_t = P0
        continue
    u = np.array([accs_w_noise[i]])
    x_t_ = A@x_t + B*u  # 预测方程
    P_t_ = A@P_t@(A.T) + Q  # 预测状态向量的协方差矩阵


    K = P_t_@H.T / (H@P_t_@H.T + R)  # 卡尔曼增益
    x_t = x_t_ + K*(zs_w_noise[i] - H@x_t_)  # 更新方程
    P_t = P_t_ - K@H@P_t_  # 更新状态向量协方差矩阵

    est_vel.append(x_t[1][0])
    est_dist.append(x_t[0][0])

est_vel = np.array(est_vel).reshape(-1)
est_dist = np.array(est_dist).reshape(-1)
diff_vel_est = est_vel - vels_gt
diff_dist_est = est_dist - dists_gt
diff_vel_sum = vels_w_noise - vels_gt
diff_dist_sum = dists_w_noise - dists_gt


# print(est_vel)
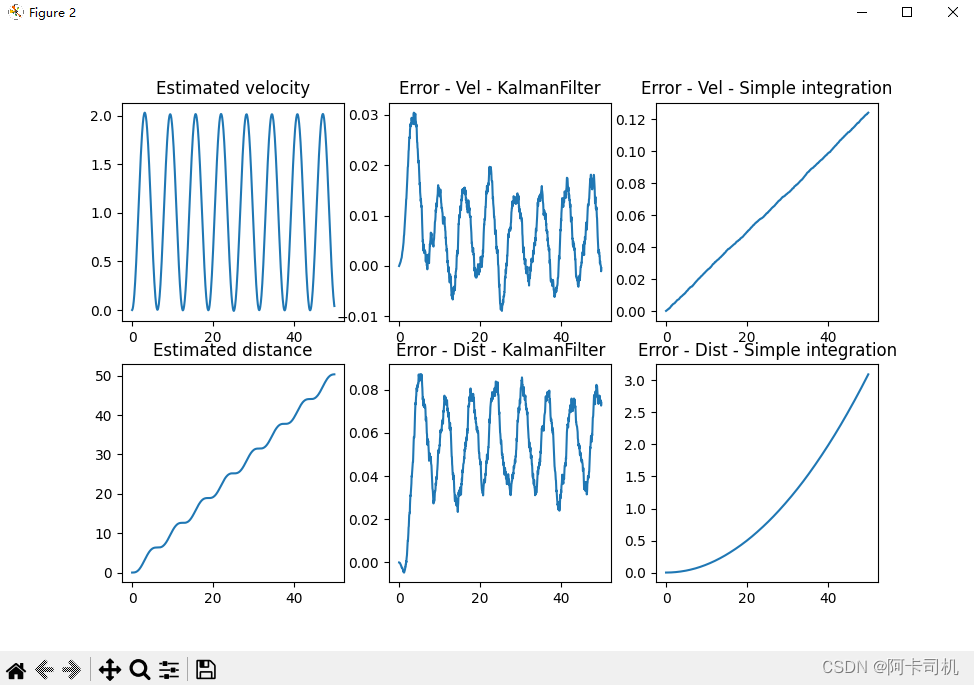
fig2 = plt.figure()
ax2_11 = fig2.add_subplot(231)
ax2_11.plot(timeline, est_vel)
ax2_11.set_title("Estimated velocity")

ax2_12 = fig2.add_subplot(232)
ax2_12.plot(timeline, diff_vel_est)
ax2_12.set_title("Error - Vel - KalmanFilter")

ax2_13 = fig2.add_subplot(233)
ax2_13.plot(timeline, diff_vel_sum)
ax2_13.set_title("Error - Vel - Simple integration")

ax2_21 = fig2.add_subplot(234)
ax2_21.plot(timeline, est_dist)
ax2_21.set_title("Estimated distance")

ax2_22 = fig2.add_subplot(235)
ax2_22.plot(timeline, diff_dist_est)
ax2_22.set_title("Error - Dist - KalmanFilter")

ax2_23 = fig2.add_subplot(236)
ax2_23.plot(timeline, diff_dist_sum)
ax2_23.set_title("Error - Dist - Simple integration")


plt.show()
参考:
卡尔曼滤波实战 | 形象化理解卡尔曼滤波(附源码)

