zqChartFour : {
title : {
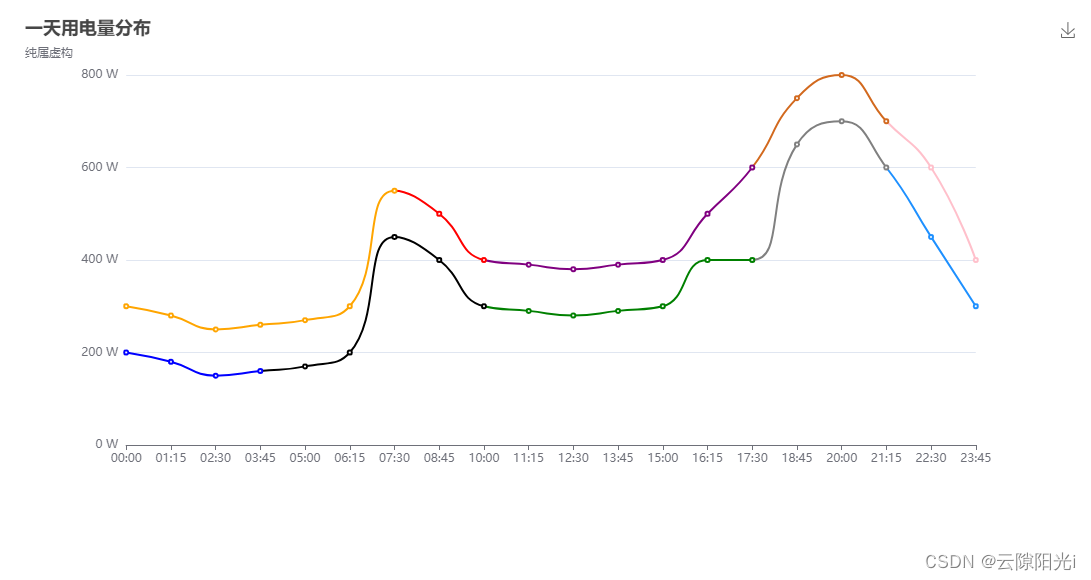
text : "一天用电量分布" ,
subtext : "纯属虚构" ,
} ,
tooltip : {
trigger : "axis" ,
axisPointer : {
type : "cross" ,
} ,
} ,
toolbox : {
show : true ,
feature : {
saveAsImage : { } ,
} ,
} ,
xAxis : {
type : "category" ,
boundaryGap : false ,
data : [
"00:00" ,
"01:15" ,
"02:30" ,
"03:45" ,
"05:00" ,
"06:15" ,
"07:30" ,
"08:45" ,
"10:00" ,
"11:15" ,
"12:30" ,
"13:45" ,
"15:00" ,
"16:15" ,
"17:30" ,
"18:45" ,
"20:00" ,
"21:15" ,
"22:30" ,
"23:45" ,
] ,
} ,
yAxis : {
type : "value" ,
axisLabel : {
formatter : "{value} W" ,
} ,
axisPointer : {
snap : true ,
} ,
} ,
visualMap : [
{
show : false ,
dimension : 0 ,
seriesIndex : 0 ,
pieces : [
{
lte : 6 ,
color : "orange" ,
} ,
{
gt : 6 ,
lte : 8 ,
color : "red" ,
} ,
{
gt : 8 ,
lte : 14 ,
color : "purple" ,
} ,
{
gt : 14 ,
lte : 17 ,
color : "Chocolate" ,
} ,
{
gt : 17 ,
color : "pink" ,
} ,
] ,
} ,
{
show : false ,
dimension : 0 ,
seriesIndex : 1 ,
pieces : [
{
lte : 3 ,
color : "blue" ,
} ,
{
gt : 3 ,
lte : 8 ,
color : "black" ,
} ,
{
gt : 8 ,
lte : 14 ,
color : "green" ,
} ,
{
gt : 14 ,
lte : 17 ,
color : "grey" ,
} ,
{
gt : 17 ,
color : "DodgerBlue" ,
} ,
] ,
} ,
] ,
series : [
{
name : "用电量" ,
type : "line" ,
smooth : true ,
data : [
300 , 280 , 250 , 260 , 270 , 300 , 550 , 500 , 400 , 390 , 380 , 390 , 400 ,
500 , 600 , 750 , 800 , 700 , 600 , 400 ,
] ,
} ,
{
name : "费用" ,
type : "line" ,
smooth : true ,
data : [
200 , 180 , 150 , 160 , 170 , 200 , 450 , 400 , 300 , 290 , 280 , 290 , 300 ,
400 , 400 , 650 , 700 , 600 , 450 , 300 ,
] ,
} ,
] ,
} ,
