需求
Cesium 制作风场
- 预览
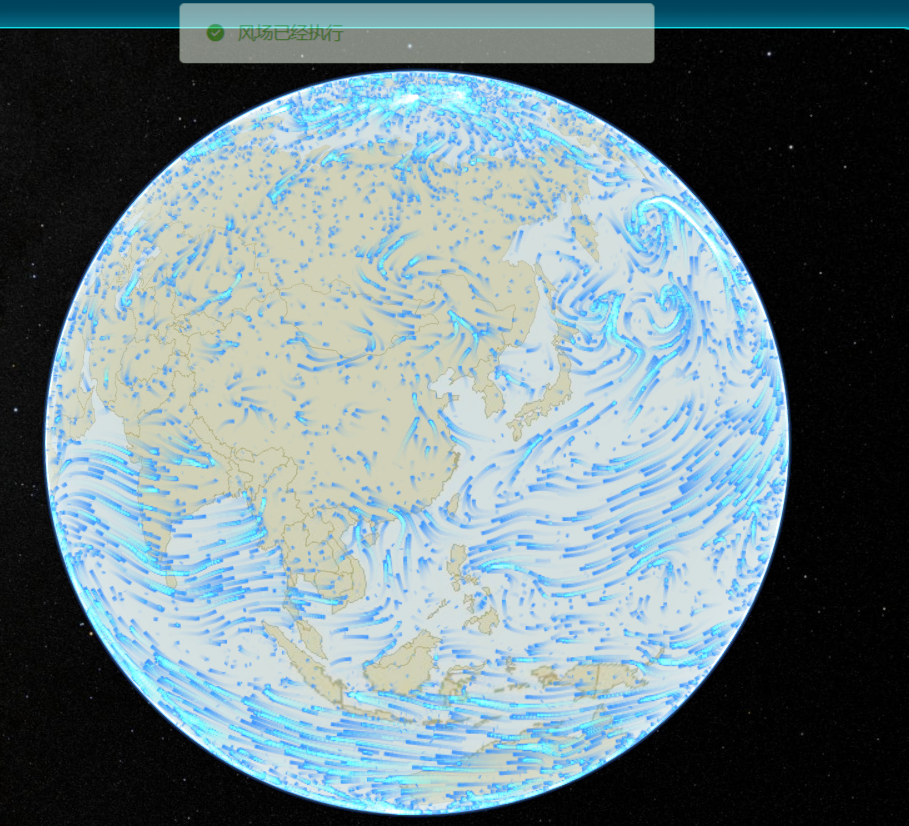
分析
以下是开发中参考的几个博主的案例
- 博客一:风场+热力图
- 博客二
- 博客三
风场数据准备,data.json
由于数据量过大,我这边只做格式展示,想要完整 json 文件,可以在我的资源里获取
[
  {
    "header":{
            "discipline":0,
            "disciplineName":"Meteorological products",
            "gribEdition":2,
            "gribLength":73286,
            "center":7,
            "centerName":"US National Weather Service - NCEP(WMC)",
            "subcenter":2,
            "refTime":"2018-06-25T00:00:00.000Z",
            "significanceOfRT":1,
            "significanceOfRTName":"Start of forecast",
            "productStatus":0,
            "productStatusName":"Operational products",
            "productType":3,
            "productTypeName":"Control Forecast products",
            "productDefinitionTemplate":1,
            "productDefinitionTemplateName":"Individual ensemble forecast at a point in time",
            "parameterCategory":2,
            "parameterCategoryName":"Momentum",
            "parameterNumber":2,
            "parameterNumberName":"U-component_of_wind",
            "parameterUnit":"m.s-1",
            "genProcessType":4,
            "genProcessTypeName":"Ensemble Forecast",
            "forecastTime":0,
            "surface1Type":103,
            "surface1TypeName":"Specified height level above ground",
            "surface1Value":10.0,
            "surface2Type":255,
            "surface2TypeName":"Missing",
            "surface2Value":0.0,
            "gridDefinitionTemplate":0,
            "gridDefinitionTemplateName":"Latitude_Longitude",
            "numberPoints":65160,
            "shape":6,
            "shapeName":"Earth spherical with radius of 6,371,229.0 m",
            "gridUnits":"degrees",
            "resolution":48,
            "winds":"true",
            "scanMode":0,
            "nx":360,
            "ny":181,
            "basicAngle":0,
            "subDivisions":0,
            "lo1":0.0,
            "la1":90.0,
            "lo2":359.0,
            "la2":-90.0,
            "dx":1.0,
            "dy":1.0
        },
    "meta": { "date": "2022.01.11 00:00:00 UTC" },
    "data": [
       -5.76,
       -5.7,
       -5.63,
       -5.57,
       -5.51,
       -5.44,
       -5.37,
       -5.3,
       -5.23,
       -5.16,
       -5.08,
       -5.0,
       -4.93,
       -4.85,
       -4.77,
       -4.68,
       -4.6,
       -4.51,
       -4.43,
       -4.34,
       -4.25,
       -4.16,
       -4.07,
       -3.98,
       -3.88,
       -3.79,
       -3.69,
       -3.59,
       -3.49,
       -3.39,
       -3.29,
       -3.19,
       -3.09,
       -2.98,
       -2.88,
       -2.77,
       -2.67,
       -2.56,
       -2.45,
       -2.34,
       -2.23,
       -2.12,
       -2.01,
       -1.9,
       -1.79,
       -1.68,
       -1.56,
       -1.45,
      ...
      ...
      3.49,
      3.58,
      3.68,
      3.78
    ]
  },
  {
    "header":{
	       "discipline":0,
	       "disciplineName":"Meteorological products",
	       "gribEdition":2,
	       "gribLength":73503,
	       "center":7,
	       "centerName":"US National Weather Service - NCEP(WMC)",
	       "subcenter":2,
	       "refTime":"2018-06-25T00:00:00.000Z",
	       "significanceOfRT":1,
	       "significanceOfRTName":"Start of forecast",
	       "productStatus":0,
	       "productStatusName":"Operational products",
	       "productType":3,
	       "productTypeName":"Control Forecast products",
	       "productDefinitionTemplate":1,
	       "productDefinitionTemplateName":"Individual ensemble forecast at a point in time",
	       "parameterCategory":2,
	       "parameterCategoryName":"Momentum",
	       "parameterNumber":3,
	       "parameterNumberName":"V-component_of_wind",
	       "parameterUnit":"m.s-1",
	       "genProcessType":4,
	       "genProcessTypeName":"Ensemble Forecast",
	       "forecastTime":0,
	       "surface1Type":103,
	       "surface1TypeName":"Specified height level above ground",
	       "surface1Value":10.0,
	       "surface2Type":255,
	       "surface2TypeName":"Missing",
	       "surface2Value":0.0,
	       "gridDefinitionTemplate":0,
	       "gridDefinitionTemplateName":"Latitude_Longitude",
	       "numberPoints":65160,
	       "shape":6,
	       "shapeName":"Earth spherical with radius of 6,371,229.0 m",
	       "gridUnits":"degrees",
	       "resolution":48,
	       "winds":"true",
	       "scanMode":0,
	       "nx":360,
	       "ny":181,
	       "basicAngle":0,
	       "subDivisions":0,
	       "lo1":0.0,
	       "la1":90.0,
	       "lo2":359.0,
	       "la2":-90.0,
	       "dx":1.0,
	       "dy":1.0
	   },
	"meta": { "date": "2022.01.11 00:00:00 UTC" },
    "data": [
      3.39,
	  3.49,
      3.58,
      3.68,
      3.78,
      3.87,
      3.97,
      4.06,
      4.15,
      4.24,
      4.33,
      4.42,
      4.51,
      4.59,
      4.68,
      4.76,
      4.84,
      4.92,
      5.0,
      5.08,
      5.15,
      5.22,
      5.3,
      5.37,
      5.43,
      5.5,
      5.57,
      5.63,
      5.69,
      5.75,
      5.81,
      5.87,
      5.92,
      5.97,
      6.03,
      6.08,
      6.12,
      6.17,
      6.21,
      6.25,
      ...
      ...
      6.59,
	  6.6,
      6.62,
      6.64,
      6.65,
      6.66,
    ]
  }
]
风场封装 wind.js
/****
 *风场类
 ****/
export var CanvasWindy = function (json, params) {
  //风场json数据
  this.windData = json;
  //可配置参数
  this.viewer = params.viewer;
  this.canvas = params.canvas;
  this.extent = params.extent || []; //风场绘制时的地图范围,范围不应该大于风场数据的范围,顺序:west/east/south/north,有正负区分,如:[110,120,30,36]
  this.canvasContext = params.canvas.getContext("2d"); //canvas上下文
  this.canvasWidth = params.canvasWidth || 300; //画板宽度
  this.canvasHeight = params.canvasHeight || 180; //画板高度
  this.speedRate = params.speedRate || 100; //风前进速率,意思是将当前风场横向纵向分成100份,再乘以风速就能得到移动位置,无论地图缩放到哪一级别都是一样的速度,可以用该数值控制线流动的快慢,值越大,越慢,
  this.particlesNumber = params.particlesNumber || 20000; //初始粒子总数,根据实际需要进行调节
  this.maxAge = params.maxAge || 120; //每个粒子的最大生存周期
  this.frameTime = 1000 / (params.frameRate || 10); //每秒刷新次数,因为requestAnimationFrame固定每秒60次的渲染,所以如果不想这么快,就把该数值调小一些
  this.color = params.color || "#ffffff"; //线颜色,提供几个示例颜色['#14208e','#3ac32b','#e0761a']
  this.lineWidth = params.lineWidth || 1; //线宽度
  //内置参数
  this.initExtent = []; //风场初始范围
  this.calc_speedRate = [0, 0]; //根据speedRate参数计算经纬度步进长度
  this.windField = null;
  this.particles = [];
  this.animateFrame = null; //requestAnimationFrame事件句柄,用来清除操作
  this.isdistory = false; //是否销毁,进行删除操作
  this._init();
};
CanvasWindy.prototype = {
  constructor: CanvasWindy,
  _init: function () {
    var self = this;
    // 创建风场网格
    this.windField = this.createField();
    this.initExtent = [
      this.windField.west,
      this.windField.east,
      this.windField.south,
      this.windField.north,
    ];
    //如果风场创建时,传入的参数有extent,就根据给定的extent,让随机生成的粒子落在extent范围内
    if (this.extent.length != 0) {
      this.extent = [
        Math.max(this.initExtent[0], this.extent[0]),
        Math.min(this.initExtent[1], this.extent[1]),
        Math.max(this.initExtent[2], this.extent[2]),
        Math.min(this.initExtent[3], this.extent[3]),
      ];
    }
    // console.log(this.extent);
    this._calcStep();
    // 创建风场粒子
    for (var i = 0; i < this.particlesNumber; i++) {
      this.particles.push(this.randomParticle(new CanvasParticle()));
    }
    this.canvasContext.fillStyle = "rgba(0, 0, 0, 0.97)";
    this.canvasContext.globalAlpha = 0.6;
    this.animate();

    var then = Date.now();
    (function frame() {
      if (!self.isdistory) {
        self.animateFrame = requestAnimationFrame(frame);
        var now = Date.now();
        var delta = now - then;
        if (delta > self.frameTime) {
          then = now - (delta % self.frameTime);
          self.animate();
        }
      } else {
        self.removeLines();
      }
    })();
  },
  //计算经纬度步进长度
  _calcStep: function () {
    var isextent = this.extent.length != 0;
    var calcExtent = isextent ? this.extent : this.initExtent;
    var calcSpeed = this.speedRate;
    this.calc_speedRate = [
      (calcExtent[1] - calcExtent[0]) / calcSpeed,
      (calcExtent[3] - calcExtent[2]) / calcSpeed,
    ];
  },
  //根据现有参数重新生成风场
  redraw: function () {
    window.cancelAnimationFrame(this.animateFrame);
    this.particles = [];
    this._init();
  },
  createField: function () {
    var data = this._parseWindJson();
    return new CanvasWindField(data);
  },
  animate: function () {
    var self = this,
      field = self.windField;
    var nextLng = null,
      nextLat = null,
      uv = null;
    self.particles.forEach(function (particle) {
      if (particle.age <= 0) {
        self.randomParticle(particle);
      }
      if (particle.age > 0) {
        var x = particle.x,
          y = particle.y,
          tlng = particle.tlng,
          tlat = particle.tlat;
        var gridpos = self._togrid(tlng, tlat);
        var tx = gridpos[0];
        var ty = gridpos[1];
        if (!self.isInExtent(tlng, tlat)) {
          particle.age = 0;
        } else {
          uv = field.getIn(tx, ty);
          nextLng = tlng + self.calc_speedRate[0] * uv[0];
          nextLat = tlat + self.calc_speedRate[1] * uv[1];
          particle.lng = tlng;
          particle.lat = tlat;
          particle.x = tx;
          particle.y = ty;
          particle.tlng = nextLng;
          particle.tlat = nextLat;
          particle.age--;
        }
      }
    });
    if (self.particles.length <= 0) this.removeLines();
    self._drawLines();
  },
  //粒子是否在地图范围内
  isInExtent: function (lng, lat) {
    var calcExtent = this.initExtent;
    if (
      lng >= calcExtent[0] &&
      lng <= calcExtent[1] &&
      lat >= calcExtent[2] &&
      lat <= calcExtent[3]
    )
      return true;
    return false;
  },
  _resize: function (width, height) {
    this.canvasWidth = width;
    this.canvasHeight = height;
  },
  _parseWindJson: function () {
    var uComponent = null,
      vComponent = null,
      header = null;
      this.windData.forEach(function (record) {
      var type =
        record.header.parameterCategory + "," + record.header.parameterNumber;
      switch (type) {
        case "2,2":
          uComponent = record["data"];
          header = record["header"];
          break;
        case "2,3":
          vComponent = record["data"];
          break;
        default:
          break;
      }
    });
    return {
      header: header,
      uComponent: uComponent,
      vComponent: vComponent,
    };
  },
  removeLines: function () {
    window.cancelAnimationFrame(this.animateFrame);
    this.isdistory = true;
    this.canvas.width = 1;
    document.getElementById("content").removeChild(this.canvas);
  },
  //根据粒子当前所处的位置(棋盘网格位置),计算经纬度,在根据经纬度返回屏幕坐标
  _tomap: function (lng, lat, particle) {
    var ct3 = Cesium.Cartesian3.fromDegrees(lng, lat, 0);
    // 判断当前点是否在地球可见端
    var isVisible = new Cesium.EllipsoidalOccluder(
      Cesium.Ellipsoid.WGS84,
      this.viewer.camera.position
    ).isPointVisible(ct3);
    var pos = Cesium.SceneTransforms.wgs84ToWindowCoordinates(
      this.viewer.scene,
      ct3
    );
    if (!isVisible) {
      particle.age = 0;
    }
    // console.log(pos);
    return pos ? [pos.x, pos.y] : null;
  },
  //根据经纬度,算出棋盘格位置
  _togrid: function (lng, lat) {
    var field = this.windField;
    var x =
      ((lng - this.initExtent[0]) / (this.initExtent[1] - this.initExtent[0])) *
      (field.cols - 1);
    var y =
      ((this.initExtent[3] - lat) / (this.initExtent[3] - this.initExtent[2])) *
      (field.rows - 1);
    return [x, y];
  },
  _drawLines: function () {
    var self = this;
    var particles = this.particles;
    this.canvasContext.lineWidth = self.lineWidth;
    //后绘制的图形和前绘制的图形如果发生遮挡的话,只显示后绘制的图形跟前一个绘制的图形重合的前绘制的图形部分,示例:https://www.w3school.com.cn/tiy/t.asp?f=html5_canvas_globalcompop_all
    this.canvasContext.globalCompositeOperation = "destination-in";
    this.canvasContext.fillRect(0, 0, this.canvasWidth, this.canvasHeight);
    this.canvasContext.globalCompositeOperation = "lighter"; //重叠部分的颜色会被重新计算
    this.canvasContext.globalAlpha = 0.9;
    this.canvasContext.beginPath();
    this.canvasContext.strokeStyle = this.color;
    particles.forEach(function (particle) {
      var movetopos = self._tomap(particle.lng, particle.lat, particle);
      var linetopos = self._tomap(particle.tlng, particle.tlat, particle);
      // console.log(movetopos,linetopos);
      if (movetopos != null && linetopos != null) {
        self.canvasContext.moveTo(movetopos[0], movetopos[1]);
        self.canvasContext.lineTo(linetopos[0], linetopos[1]);
      }
    });
    this.canvasContext.stroke();
  },
  //随机数生成器(小数)
  fRandomByfloat: function (under, over) {
    return under + Math.random() * (over - under);
  },
  //随机数生成器(整数)
  fRandomBy: function (under, over) {
    switch (arguments.length) {
      case 1:
        return parseInt(Math.random() * under + 1);
      case 2:
        return parseInt(Math.random() * (over - under + 1) + under);
      default:
        return 0;
    }
  },
  //根据当前风场extent随机生成粒子
  randomParticle: function (particle) {
    var safe = 30,
      x = -1,
      y = -1,
      lng = null,
      lat = null;
    var hasextent = this.extent.length != 0;
    var calc_extent = hasextent ? this.extent : this.initExtent;
    do {
      try {
        if (hasextent) {
          var pos_x = this.fRandomBy(0, this.canvasWidth);
          var pos_y = this.fRandomBy(0, this.canvasHeight);
          var cartesian = this.viewer.camera.pickEllipsoid(
            new Cesium.Cartesian2(pos_x, pos_y),
            this.viewer.scene.globe.ellipsoid
          );
          var cartographic =
            this.viewer.scene.globe.ellipsoid.cartesianToCartographic(
              cartesian
            );
          if (cartographic) {
            //将弧度转为度的十进制度表示
            lng = Cesium.Math.toDegrees(cartographic.longitude);
            lat = Cesium.Math.toDegrees(cartographic.latitude);
          }
        } else {
          lng = this.fRandomByfloat(calc_extent[0], calc_extent[1]);
          lat = this.fRandomByfloat(calc_extent[2], calc_extent[3]);
        }
      } catch (e) {}
      if (lng) {
        var gridpos = this._togrid(lng, lat);
        x = gridpos[0];
        y = gridpos[1];
      }
    } while (this.windField.getIn(x, y)[2] <= 0 && safe++ < 30);
    var field = this.windField;
    var uv = field.getIn(x, y);
    var nextLng = lng + this.calc_speedRate[0] * uv[0];
    var nextLat = lat + this.calc_speedRate[1] * uv[1];
    particle.lng = lng;
    particle.lat = lat;
    particle.x = x;
    particle.y = y;
    particle.tlng = nextLng;
    particle.tlat = nextLat;
    particle.speed = uv[2];
    particle.age = Math.round(Math.random() * this.maxAge); //每一次生成都不一样
    return particle;
  },
};

/****
 *棋盘类
 *根据风场数据生产风场棋盘网格
 ****/
var CanvasWindField = function (obj) {
  this.west = null;
  this.east = null;
  this.south = null;
  this.north = null;
  this.rows = null;
  this.cols = null;
  this.dx = null;
  this.dy = null;
  this.unit = null;
  this.date = null;

  this.grid = null;
  this._init(obj);
};
CanvasWindField.prototype = {
  constructor: CanvasWindField,
  _init: function (obj) {
    var header = obj.header,
    uComponent = obj["uComponent"],
    vComponent = obj["vComponent"];

    // debugger;
    this.west = +header["lo1"];
    this.east = +header["lo2"];
    this.south = +header["la2"];
    this.north = +header["la1"];
    this.rows = +header["ny"];
    this.cols = +header["nx"];
    this.dx = +header["dx"];
    this.dy = +header["dy"];
    this.unit = header["parameterUnit"];
    this.date = header["refTime"];

    this.grid = [];
    var k = 0,
      rows = null,
      uv = null;
    for (var j = 0; j < this.rows; j++) {
      rows = [];
      for (var i = 0; i < this.cols; i++, k++) {
        uv = this._calcUV(uComponent[k], vComponent[k]);
        rows.push(uv);
      }
      this.grid.push(rows);
    }
  },
  _calcUV: function (u, v) {
    return [+u, +v, Math.sqrt(u * u + v * v)];
  },
  //二分差值算法计算给定节点的速度
  _bilinearInterpolation: function (x, y, g00, g10, g01, g11) {
    var rx = 1 - x;
    var ry = 1 - y;
    var a = rx * ry,
      b = x * ry,
      c = rx * y,
      d = x * y;
    var u = g00[0] * a + g10[0] * b + g01[0] * c + g11[0] * d;
    var v = g00[1] * a + g10[1] * b + g01[1] * c + g11[1] * d;
    return this._calcUV(u, v);
  },
  getIn: function (x, y) {
    if (x < 0 || x >= 359 || y >= 180) {
      return [0, 0, 0];
    }
    var x0 = Math.floor(x),
      y0 = Math.floor(y),
      x1,
      y1;
    if (x0 === x && y0 === y) return this.grid[y][x];

    x1 = x0 + 1;
    y1 = y0 + 1;

    var g00 = this.getIn(x0, y0),
      g10 = this.getIn(x1, y0),
      g01 = this.getIn(x0, y1),
      g11 = this.getIn(x1, y1);
    var result = null;
    try {
      result = this._bilinearInterpolation(x - x0, y - y0, g00, g10, g01, g11);
    } catch (e) {
      console.log(x, y);
    }
    return result;
  },
  isInBound: function (x, y) {
    if (x >= 0 && x < this.cols - 1 && y >= 0 && y < this.rows - 1) return true;
    return false;
  },
};

/****
 *粒子对象
 ****/
var CanvasParticle = function () {
  this.lng = null; //粒子初始经度
  this.lat = null; //粒子初始纬度
  this.x = null; //粒子初始x位置(相对于棋盘网格,比如x方向有360个格,x取值就是0-360,这个是初始化时随机生成的)
  this.y = null; //粒子初始y位置(同上)
  this.tlng = null; //粒子下一步将要移动的经度,这个需要计算得来
  this.tlat = null; //粒子下一步将要移动的y纬度,这个需要计算得来
  this.age = null; //粒子生命周期计时器,每次-1
  this.speed = null; //粒子移动速度,可以根据速度渲染不同颜色
};
风场显示
import {CanvasWindy} from '../server/wind.js'

// 风场显示
showWindy() {
  $('#windycanvas').show();
},
//风场隐藏
hideWindy() {
  $('#windycanvas').hide();
},
//设置地图操作,便于使用风场
initWindy(windy) {
  /**
  *如果处于全球状态就设置为[](只要有一个角获取不到坐标就表示全球状态,实时计算)
  **/
  var globalExtent = [];

  //获取当前三维窗口左上、右上、左下、右下坐标
  var getCesiumExtent = function () {
    var canvaswidth = window.innerWidth,
      canvasheight = window.innerHeight - 50;

    var left_top_pt = new Cesium.Cartesian2(0, 0);
    var left_bottom_pt = new Cesium.Cartesian2(0, canvasheight);
    var right_top_pt = new Cesium.Cartesian2(canvaswidth, 0);
    var right_bottom_pt = new Cesium.Cartesian2(canvaswidth, canvasheight);

    var pick1 = viewer.scene.globe.pick(viewer.camera.getPickRay(left_top_pt), viewer.scene);
    var pick2 = viewer.scene.globe.pick(viewer.camera.getPickRay(left_bottom_pt), viewer.scene);
    var pick3 = viewer.scene.globe.pick(viewer.camera.getPickRay(right_top_pt), viewer.scene);
    var pick4 = viewer.scene.globe.pick(viewer.camera.getPickRay(right_bottom_pt), viewer.scene);
    if (pick1 && pick2 && pick3 && pick4) {
      //将三维坐标转成地理坐标---只需计算左下右上的坐标即可
      var geoPt1 = viewer.scene.globe.ellipsoid.cartesianToCartographic(pick2);
      var geoPt2 = viewer.scene.globe.ellipsoid.cartesianToCartographic(pick3);
      //地理坐标转换为经纬度坐标
      var point1 = [geoPt1.longitude / Math.PI * 180, geoPt1.latitude / Math.PI * 180];
      var point2 = [geoPt2.longitude / Math.PI * 180, geoPt2.latitude / Math.PI * 180];
      // console.log(point1,point2);
      //此时说明extent需要分为东西半球
      if (point1[0] > point2[0]) {
        globalExtent = [point1[0], 180, point1[1], point2[1], -180, point2[0], point1[1], point2[1]];
      } else {
        globalExtent = [point1[0], point2[0], point1[1], point2[1]];
      }
    } else {
      globalExtent = [];
    }
  };
  // 开启监听器--无论对当前地球做的任何操作都会监听到
  let postRender = viewer.scene.postRender.addEventListener(() => {
    getCesiumExtent();
  });
  var refreshTimer = -1;
  var mouse_down = false;
  var mouse_move = false;
  var handler = new Cesium.ScreenSpaceEventHandler(viewer.scene.canvas);
  //鼠标滚动、旋转后是否需要重新生成风场---如果需要,打开以下注释--旋转或者移动到北半球的时候计算会有问题
  handler.setInputAction(function (e) {
    clearTimeout(refreshTimer);
    //每次鼠标滚轮旋转后不显示风场
    // this.hideWindy();
    setTimeout(function () {
      windy.extent = globalExtent;
      windy.redraw();
      // this.showWindy();
      $('#windycanvas').show();
    }, 200);
  }, Cesium.ScreenSpaceEventType.WHEEL);
  //鼠标左键、右键按下
  handler.setInputAction(function (e) {
    mouse_down = true;
  }, Cesium.ScreenSpaceEventType.LEFT_DOWN);
  handler.setInputAction(function (e) {
    mouse_down = true;
  }, Cesium.ScreenSpaceEventType.RIGHT_DOWN);
  //鼠标移动
  handler.setInputAction(function (e) {
    if (mouse_down) {
      //每次鼠标移动后不显示风场
      // this.hideWindy();
      mouse_move = true;
    }
  }, Cesium.ScreenSpaceEventType.MOUSE_MOVE);
  //鼠标左键、右键抬起
  handler.setInputAction(function (e) {
    if (mouse_down && mouse_move) {
      windy.extent = globalExtent;
      windy.redraw();
    }
    // this.showWindy();
    $('#windycanvas').show();
    mouse_down = false;
    mouse_move = false;
  }, Cesium.ScreenSpaceEventType.LEFT_UP);
  handler.setInputAction(function (e) {
    if (mouse_down && mouse_move) {
      windy.extent = globalExtent;
      windy.redraw();
    }
    this.showWindy();
    mouse_down = false;
    mouse_move = false;
  }, Cesium.ScreenSpaceEventType.RIGHT_UP);
},
//调整风场canvas大小
resizeCanvas(windy) {
  if (windycanvas == null) {
    return;
  }
  windycanvas.width = window.innerWidth;
  windycanvas.height = window.innerHeight;
  // console.log(windycanvas.width, windycanvas.height);
  if (windy) {
    windy._resize(windycanvas.width, windycanvas.height);
  }
},
//获取风场数据、生成风场
getwindData(){
  let Data_Promise = axios(`data.json`)
  Data_Promise.then((res) => {
    console.log('风的格点预报:', res.data);
    //设置canvas
    var windycanvas = document.createElement('canvas');
    windycanvas.setAttribute("id", "windycanvas");
    windycanvas.style.position = 'fixed'
    windycanvas.style["pointer-events"] = "none";
    windycanvas.style["z-index"] = 10;
    windycanvas.style["bottom"] = 0;
    windycanvas.style["top"] = 0;
    windycanvas.style["left"] = 0;
    windycanvas.style["right"] = 0;
    document.getElementById('earthView').appendChild(windycanvas);

    this.resizeCanvas(windy);
    window.onresize = this.resizeCanvas(windy);

    //风场参数设置
    let params = {
      viewer: viewer,
      canvas: windycanvas,
      canvasWidth: window.innerWidth,
      canvasHeight: window.innerHeight,
      speedRate: 5000,
      particlesNumber: 5000,
      maxAge: 120,
      frameRate: 10,
      color: '#3a92ff',
      lineWidth: 3,
    };

    var windy;
    setTimeout(() => {
      windy = new CanvasWindy(res.data, params);
      this.showWindy()
      //初始化风场设置
      this.initWindy(windy)
      this.$message.success('风场已经执行'),
      this.loading = false;
      this.od1Visible = false;
    }, 2000);
  })
}
其他
如果想要简单绘制一个风向风速情况,可以如下处理:
在Cesium中加载风场需要先准备好相关的数据,包括风速和方向的数据。以下是一个简单的加载风场的过程:
-
准备数据:将风速和方向的数据保存在对应的数组中,通常使用网格格式来表示。例如,可以使用二维数组来表示风速和方向在地球表面上的不同位置。
-
创建实体:在Cesium中,可以使用
Entity对象来表示一个可视化的实体。可以使用Billboard、Model、Polyline等不同类型的图元来表示风场。我们可以在实体的position属性上指定风场的位置,然后在实体的billboard或model属性上指定要显示的图像或模型,例如箭头或风车的图片或模型。 -
设置属性: 在实体的属性中,可以设置
billboard或model的颜色、大小、旋转和透明度等属性,以及箭头或风车的方向、角度等属性,使其在地球表面上正确地显示风场。 -
添加实体:将实体添加到Cesium的场景中,使用
Viewer.entities.add()方法将实体添加到场景中。
以下是一个简单的示例代码,可以将数组中的数据显示为箭头的形式来表示风场:
// 准备数据
var windSpeedData = [...]; // 风速数据
var windDirectionData = [...]; // 风向数据

// 创建实体
var entity = viewer.entities.add({
    position: Cesium.Cartesian3.fromDegrees(longitude, latitude, height),
    billboard: {
        image: 'arrow.png',
        scale: 0.1
    }
});

// 设置属性
var windSpeed = windSpeedData[i][j];
var windDirection = windDirectionData[i][j];
var heading = Cesium.Math.toRadians(90 - windDirection); // 箭头方向为逆时针旋转90度
var pitch = 0;
var roll = 0;

entity.orientation = Cesium.Transforms.headingPitchRollQuaternion(position, heading, pitch, roll);
entity.billboard.color = Cesium.Color.fromCssColorString('#FF0000');
entity.billboard.scale = windSpeed / 10; // 根据风速调整箭头大小
注意,上面的示例代码中仅为了演示如何加载风场,实际上需要根据具体的数据格式和需求来适当地修改代码。


