最近遇到一个c++ 代码里调用system函数然后没返回的问题,此时调用进程所在CPU占用率100%。
通过 strace 和ftrace工具跟踪系统调用,以及查看内核源码,发现 此时,进程会一直不停的调用 clone系统调用,而 clone系统调用一直返回出错。
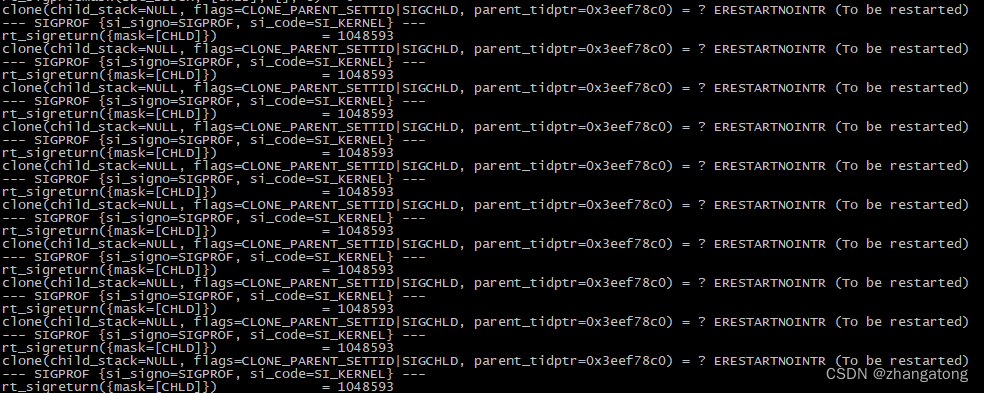
strace :
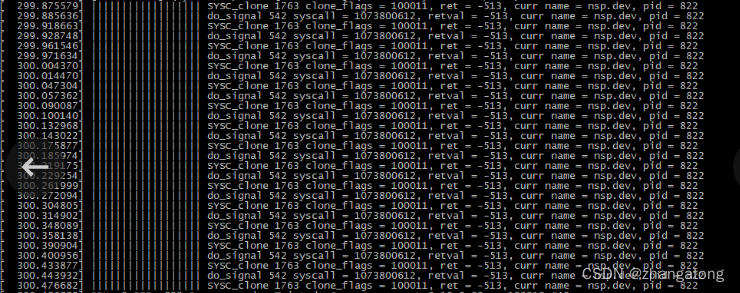
ftrace:

内核添加打印:
根据错误 ERESTARTNOINTR在 内核代码里找到报错的地方:
include/linux/errno.h
#define ERESTARTNOINTR 513kernel/fork.c
调用过程是 sys_clone -> do_fork -> copy_process :
/*
* Process group and session signals need to be delivered to just the
* parent before the fork or both the parent and the child after the
* fork. Restart if a signal comes in before we add the new process to
* it's process group.
* A fatal signal pending means that current will exit, so the new
* thread can't slip out of an OOM kill (or normal SIGKILL).
*/
recalc_sigpending();
if (signal_pending(current)) {
spin_unlock(¤t->sighand->siglock);
write_unlock_irq(&tasklist_lock);
retval = -ERESTARTNOINTR;
goto bad_fork_free_pid;
}系统调用时,检测到信号导致系统调用中断返回 ERESTARTNOINTR 错误值,处理信号后重新调用该系统调用。而进程一直在接收SIGPROF信号,导致clone系统调用一直被中断!
SIGPROF信号量的含义:
one of the Alarm Signals:This signal typically indicates expiration of a timer that measures both CPU time used by the current process, and CPU time expended on behalf of the process by the system. Such a timer is used to implement code profiling facilities, hence the name of this signal.
SIGPROF信号量的产生:
利用系统调用setitimer,在用户进程内设立定时器,定时到期时便由内核向进程发送一次信号。
经分析,原因是在程序编译时加了 "-pg"选项,程序启动后调用 rt_sigaction 配置了 SIGPROF 信号的处理函数,而后调用 setitimer 以 10ms 的间隔产生 SIGPROF。从而在信号处理函数中可以统计各个函数命中的次数,并以此估计每个函数的时间占比。
解决方法
参考:
clone() syscall infinitely restarts because of SIGPROF signals · Issue #97 · async-profiler/async-profiler · GitHub
可以通过增加 setitimer的间隔,或在内核ERESTARTNOINTR错误产生处对 SIGPROF信号做特殊处理。
linux kernel官方在2018年8月也上传了对此问题的解决方法:
kernel/git/torvalds/linux.git - Linux kernel source tree