在统计分析中交互作用是指某因素的作用随其他因素水平变化而变化,两因素共同作用不等于两因素单独作用之和(相加交互作用)或之积(相乘交互作用)。相互作用的评估是尺度相关的:乘法或加法。乘法尺度上的相互作用意味着两次暴露的综合效应大于(或小于)两次暴露单独效应的乘积。加性尺度上的相互作用意味着两次暴露的综合效应大于(或小于)两次暴露单独效应的总和。
目前在大量文章中只报道了乘法交互效应,而加法交互效应报道得较少。有文献表明,单单只用乘法交互效应低估了疾病协同的危险性,从而低估了发病率。

Rothman指出 logistic 或 Cox 回归模型中乘积项无统计学意义,
并不表示两因素无相加交互作用,也不表示无生物学交互作用,并从理论上探讨了用于评价因素间是否有区别于相乘交互作用的相加交互作用,以及三个评价指标:相对超危险度比(the relative excess risk due tointeraction,RERI)、归因比(the attributable proportion
due to interaction,AP)和交互作用指数(the synergy in-dex,SI)的构造和计算方法。
以最简单的两因素两水平为例。假设两暴露因子分别为 A、B。1 表示因素存在,0 表示因素不存在,因变量为疾病的发生与否。logistic 回归模型得到的 OR 值,作为相对危险度(RR)的估计值,OR _A0B0 表示 A、B 都不存在时发病的 OR 值,分析时作为参照组;OR _A1B0 表示仅 A 存在、B 不存在时发病的 OR 值;OR _A0B1 表示 A不存在、仅 B 存在时发病的 OR 值;OR _A1B1 表示 A、B共同存在时发病的 OR 值。
Rothman 用于评价相加交互作用的三个指标公式如下:
RERI= OR _A1B1 - OR _A0B1 - OR _A1B0 +1;
AP = RERI / OR _A1B1 ;
SI= (OR _A1B1 - 1) / [(OR _A0B1 - 1) + (OR _A1B0 - 1)]
由此看出:RERI是A和B同时暴露的发病率减去单独A和B的危险度,得出的一个超出部分的危险度。AP就是超出部分的危险度占总危险度的比例。SI就是A和B同时暴露的发病率增加的危险度除以单独A和B的发病增加的危险度。(体会一下)。
下面咱们使用interactionR包进行分析,先导入R包和数据
library(interactionR)
bc<-read.csv("E:/r/test/jiaohu1.csv",sep=',',header=TRUE)

这是个很简单的数据,oc是结局变量,alc 和 smk是暴露因素。
先建立模型
model.glm <- glm(oc ~ alc * smk,
                 family = binomial(link = "logit"),
                 data = OCdata)
代码很简单,就一句代码
out <- interactionR(model.glm,
                            exposure_names = c("alc", "smk"),
                            ci.type = "mover", ci.level = 0.95,
                            em = F, recode = F)
interactionR包可以直接生成一个做好的word表格,连做表格都帮你省了。
interactionR_table(out)

这个表格可以在RStudio 的目录(或者你设定的目录)下找到

怎么看这个表格呢,根据发病的方法比较OR,见下图

如果将“ci类型”设置为“mover,就会选择variance recovery这种方法
out <-interactionR(model.glm,
             exposure_names = c("alc", "smk"),
             ci.type = "mover", ci.level = 0.95,
             em = FALSE, recode = FALSE)

interactionR_table(out)

两个方法结果都差不多哈。下面演示一个包含三个二元变量数据,outcome 是结局变量, exp1 和exp2是暴露变量
d<-read.csv("E:/r/test/jiaohu2.csv",sep=',',header=TRUE)

方法基本一样,就是CI这里取的是"delta",recode = TRUE。
model.prev <- glm(outcome ~ exp1 * exp2, family = binomial(link = "logit"), data = d)

out1<-interactionR(model.prev,
             exposure_names = c("exp1", "exp2"),
             ci.type = "delta", ci.level = 0.95,
             em = FALSE, recode = TRUE
)

interactionR_table(out1)
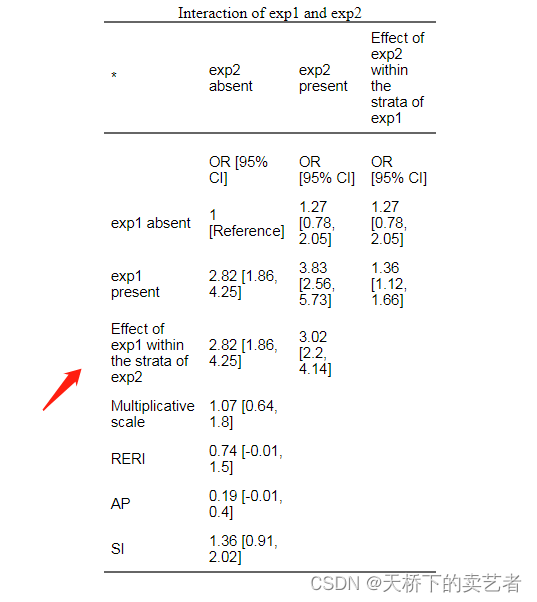
我们看到多了个Effect of exp1 within the strata of exp2这个指标,大概的意思是exp1在exp2这个分层的效应。具体详情请参看:Zou GY. On the Estimation of Additive Interaction by Use of the Four-by-two Table and Beyond. American Journal of Epidemiology 2008; 168:212-24.这篇文章。
OK,本期文章结束,公众号回复:相加交互作用数据,可以获得文中两个数据,想进一步了解看下参考文献也是很有帮助的。
参考文献:
- Zou GY. On the Estimation of Additive Interaction by Use of the Four-by-two Table and Beyond. American Journal of Epidemiology 2008; 168:212-24.
- [1]许敏锐,强德仁,周义红,等.应用R软件进行logistic回归模型的交互作用分析[J].中国卫生统计, 2017, 34(4):4.DOI:CNKI:SUN:ZGWT.0.2017-04-043.
- Rothman K, Greenland S (1998). Modern Epidemiology. Lippincott - Raven Philadelphia, USA.
- Knol, M.J., VanderWeele, T.J., Groenwold, R.H.H. et al. Estimating measures of interaction on an additive scale for preventive exposures. Eur J Epidemiol 26, 433–438 (2011). https://doi.org/10.1007/s10654-011-9554-9
