#发文福利#
一、前言
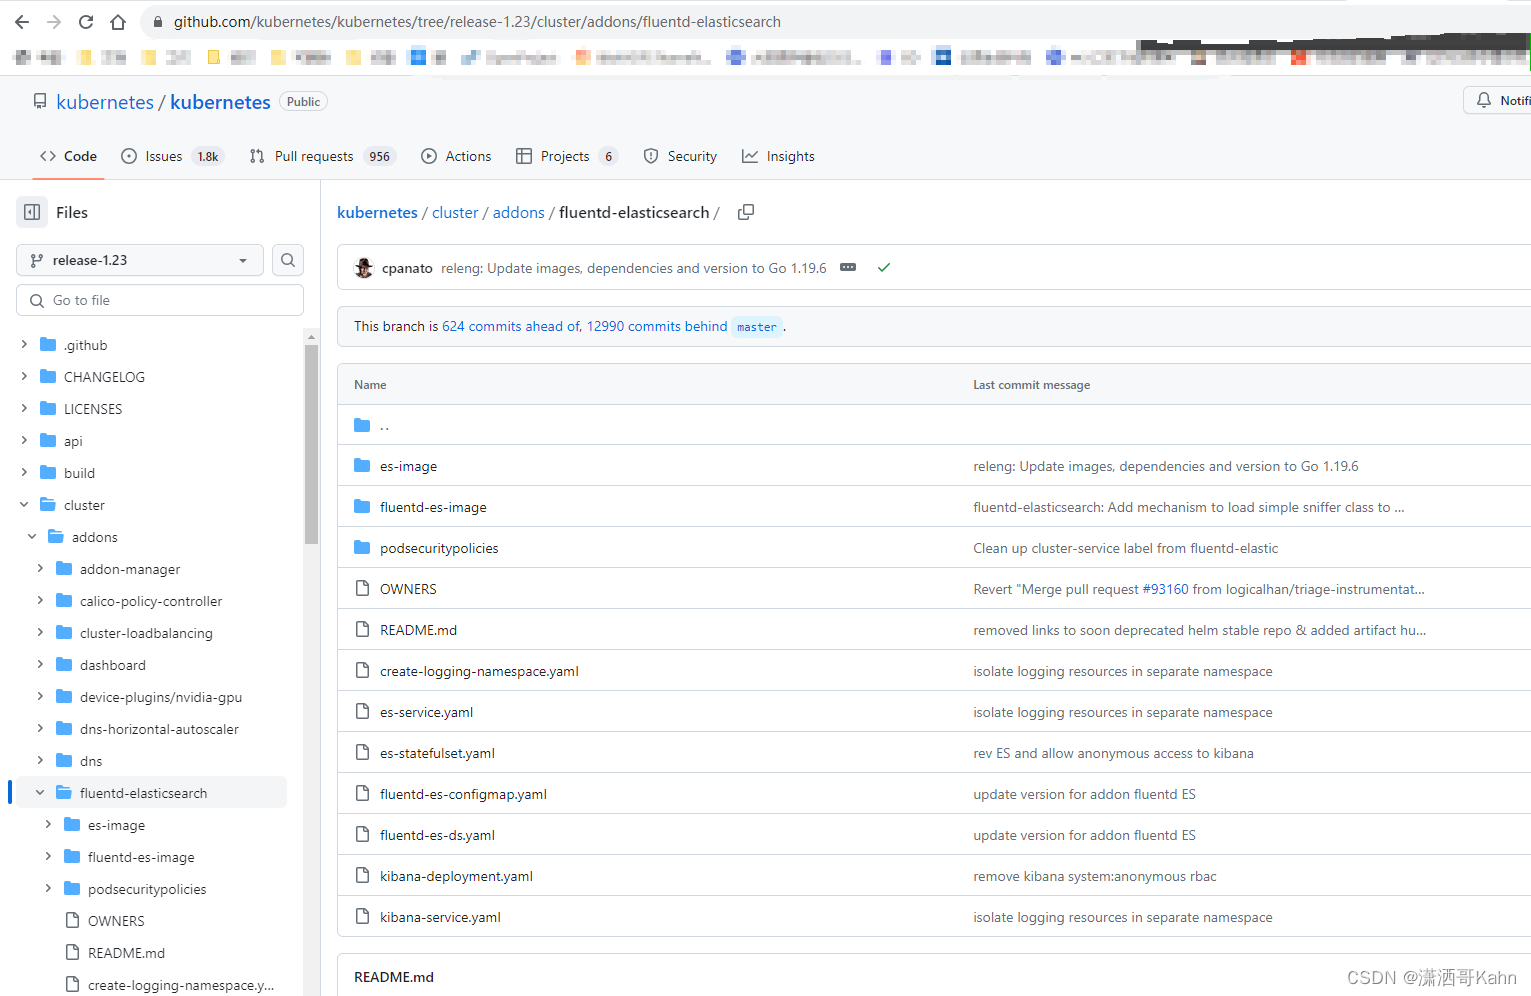
kubernetes 1.23搭建EFK所用到的yaml文件,本帖均来自kubernetes官方,且没做修改。
https://github.com/kubernetes/kubernetes/tree/release-1.23/cluster/addons/fluentd-elasticsearch
二、EFK 原版yaml
1、create-logging-namespace.yaml
kind: Namespace
apiVersion: v1
metadata:
 name: logging
 labels:
   k8s-app: logging
   kubernetes.io/cluster-service: "true"
   addonmanager.kubernetes.io/mode: Reconcile
2、es-service.yaml
apiVersion: v1
kind: Service
metadata:
  name: elasticsearch-logging
  namespace: logging
  labels:
    k8s-app: elasticsearch-logging
    kubernetes.io/cluster-service: "true"
    addonmanager.kubernetes.io/mode: Reconcile
    kubernetes.io/name: "Elasticsearch"
spec:
  clusterIP: None
  ports:
    - name: db
      port: 9200
      protocol: TCP
      targetPort: 9200
    - name: transport
      port: 9300
      protocol: TCP
      targetPort: 9300
  publishNotReadyAddresses: true
  selector:
    k8s-app: elasticsearch-logging
  sessionAffinity: None
  type: ClusterIP
3、es-statefulset.yaml
# RBAC authn and authz
apiVersion: v1
kind: ServiceAccount
metadata:
  name: elasticsearch-logging
  namespace: logging
  labels:
    k8s-app: elasticsearch-logging
    addonmanager.kubernetes.io/mode: Reconcile
---
kind: ClusterRole
apiVersion: rbac.authorization.k8s.io/v1
metadata:
  name: elasticsearch-logging
  labels:
    k8s-app: elasticsearch-logging
    addonmanager.kubernetes.io/mode: Reconcile
rules:
  - apiGroups:
      - ""
    resources:
      - "services"
      - "namespaces"
      - "endpoints"
    verbs:
      - "get"
---
kind: ClusterRoleBinding
apiVersion: rbac.authorization.k8s.io/v1
metadata:
  name: elasticsearch-logging
  labels:
    k8s-app: elasticsearch-logging
    addonmanager.kubernetes.io/mode: Reconcile
subjects:
  - kind: ServiceAccount
    name: elasticsearch-logging
    namespace: logging
    apiGroup: ""
roleRef:
  kind: ClusterRole
  name: elasticsearch-logging
  apiGroup: ""
---
# Elasticsearch deployment itself
apiVersion: apps/v1
kind: StatefulSet
metadata:
  name: elasticsearch-logging
  namespace: logging
  labels:
    k8s-app: elasticsearch-logging
    version: v7.10.2
    addonmanager.kubernetes.io/mode: Reconcile
spec:
  serviceName: elasticsearch-logging
  replicas: 2
  selector:
    matchLabels:
      k8s-app: elasticsearch-logging
      version: v7.10.2
  template:
    metadata:
      labels:
        k8s-app: elasticsearch-logging
        version: v7.10.2
    spec:
      serviceAccountName: elasticsearch-logging
      containers:
        - image: quay.io/fluentd_elasticsearch/elasticsearch:v7.10.2
          name: elasticsearch-logging
          imagePullPolicy: Always
          resources:
            # need more cpu upon initialization, therefore burstable class
            limits:
              cpu: 1000m
              memory: 3Gi
            requests:
              cpu: 100m
              memory: 3Gi
          ports:
            - containerPort: 9200
              name: db
              protocol: TCP
            - containerPort: 9300
              name: transport
              protocol: TCP
          livenessProbe:
            tcpSocket:
              port: transport
            initialDelaySeconds: 5
            timeoutSeconds: 10
          readinessProbe:
            tcpSocket:
              port: transport
            initialDelaySeconds: 5
            timeoutSeconds: 10
          volumeMounts:
            - name: elasticsearch-logging
              mountPath: /data
          env:
            - name: "NAMESPACE"
              valueFrom:
                fieldRef:
                  fieldPath: metadata.namespace
            - name: "MINIMUM_MASTER_NODES"
              value: "1"
      volumes:
        - name: elasticsearch-logging
          emptyDir: {}
      # Elasticsearch requires vm.max_map_count to be at least 262144.
      # If your OS already sets up this number to a higher value, feel free
      # to remove this init container.
      initContainers:
        - image: alpine:3.6
          command: ["/sbin/sysctl", "-w", "vm.max_map_count=262144"]
          name: elasticsearch-logging-init
          securityContext:
            privileged: true
4、fluentd-es-configmap.yaml
kind: ConfigMap
apiVersion: v1
metadata:
  name: fluentd-es-config-v0.2.1
  namespace: logging
  labels:
    addonmanager.kubernetes.io/mode: Reconcile
data:
  system.conf: |-
    <system>
      root_dir /tmp/fluentd-buffers/
    </system>

  containers.input.conf: |-
    # This configuration file for Fluentd / td-agent is used
    # to watch changes to Docker log files. The kubelet creates symlinks that
    # capture the pod name, namespace, container name & Docker container ID
    # to the docker logs for pods in the /var/log/containers directory on the host.
    # If running this fluentd configuration in a Docker container, the /var/log
    # directory should be mounted in the container.
    #
    # These logs are then submitted to Elasticsearch which assumes the
    # installation of the fluent-plugin-elasticsearch & the
    # fluent-plugin-kubernetes_metadata_filter plugins.
    # See https://github.com/uken/fluent-plugin-elasticsearch &
    # https://github.com/fabric8io/fluent-plugin-kubernetes_metadata_filter for
    # more information about the plugins.
    #
    # Example
    # =======
    # A line in the Docker log file might look like this JSON:
    #
    # {"log":"2014/09/25 21:15:03 Got request with path wombat\n",
    #  "stream":"stderr",
    #   "time":"2014-09-25T21:15:03.499185026Z"}
    #
    # The time_format specification below makes sure we properly
    # parse the time format produced by Docker. This will be
    # submitted to Elasticsearch and should appear like:
    # $ curl 'http://elasticsearch-logging:9200/_search?pretty'
    # ...
    # {
    #      "_index" : "logstash-2014.09.25",
    #      "_type" : "fluentd",
    #      "_id" : "VBrbor2QTuGpsQyTCdfzqA",
    #      "_score" : 1.0,
    #      "_source":{"log":"2014/09/25 22:45:50 Got request with path wombat\n",
    #                 "stream":"stderr","tag":"docker.container.all",
    #                 "@timestamp":"2014-09-25T22:45:50+00:00"}
    #    },
    # ...
    #
    # The Kubernetes fluentd plugin is used to write the Kubernetes metadata to the log
    # record & add labels to the log record if properly configured. This enables users
    # to filter & search logs on any metadata.
    # For example a Docker container's logs might be in the directory:
    #
    #  /var/lib/docker/containers/997599971ee6366d4a5920d25b79286ad45ff37a74494f262e3bc98d909d0a7b
    #
    # and in the file:
    #
    #  997599971ee6366d4a5920d25b79286ad45ff37a74494f262e3bc98d909d0a7b-json.log
    #
    # where 997599971ee6... is the Docker ID of the running container.
    # The Kubernetes kubelet makes a symbolic link to this file on the host machine
    # in the /var/log/containers directory which includes the pod name and the Kubernetes
    # container name:
    #
    #    synthetic-logger-0.25lps-pod_default_synth-lgr-997599971ee6366d4a5920d25b79286ad45ff37a74494f262e3bc98d909d0a7b.log
    #    ->
    #    /var/lib/docker/containers/997599971ee6366d4a5920d25b79286ad45ff37a74494f262e3bc98d909d0a7b/997599971ee6366d4a5920d25b79286ad45ff37a74494f262e3bc98d909d0a7b-json.log
    #
    # The /var/log directory on the host is mapped to the /var/log directory in the container
    # running this instance of Fluentd and we end up collecting the file:
    #
    #   /var/log/containers/synthetic-logger-0.25lps-pod_default_synth-lgr-997599971ee6366d4a5920d25b79286ad45ff37a74494f262e3bc98d909d0a7b.log
    #
    # This results in the tag:
    #
    #  var.log.containers.synthetic-logger-0.25lps-pod_default_synth-lgr-997599971ee6366d4a5920d25b79286ad45ff37a74494f262e3bc98d909d0a7b.log
    #
    # The Kubernetes fluentd plugin is used to extract the namespace, pod name & container name
    # which are added to the log message as a kubernetes field object & the Docker container ID
    # is also added under the docker field object.
    # The final tag is:
    #
    #   kubernetes.var.log.containers.synthetic-logger-0.25lps-pod_default_synth-lgr-997599971ee6366d4a5920d25b79286ad45ff37a74494f262e3bc98d909d0a7b.log
    #
    # And the final log record look like:
    #
    # {
    #   "log":"2014/09/25 21:15:03 Got request with path wombat\n",
    #   "stream":"stderr",
    #   "time":"2014-09-25T21:15:03.499185026Z",
    #   "kubernetes": {
    #     "namespace": "default",
    #     "pod_name": "synthetic-logger-0.25lps-pod",
    #     "container_name": "synth-lgr"
    #   },
    #   "docker": {
    #     "container_id": "997599971ee6366d4a5920d25b79286ad45ff37a74494f262e3bc98d909d0a7b"
    #   }
    # }
    #
    # This makes it easier for users to search for logs by pod name or by
    # the name of the Kubernetes container regardless of how many times the
    # Kubernetes pod has been restarted (resulting in a several Docker container IDs).

    # Json Log Example:
    # {"log":"[info:2016-02-16T16:04:05.930-08:00] Some log text here\n","stream":"stdout","time":"2016-02-17T00:04:05.931087621Z"}
    # CRI Log Example:
    # 2016-02-17T00:04:05.931087621Z stdout F [info:2016-02-16T16:04:05.930-08:00] Some log text here
    <source>
      @id fluentd-containers.log
      @type tail
      path /var/log/containers/*.log
      pos_file /var/log/es-containers.log.pos
      tag raw.kubernetes.*
      read_from_head true
      <parse>
        @type multi_format
        <pattern>
          format json
          time_key time
          time_format %Y-%m-%dT%H:%M:%S.%NZ
        </pattern>
        <pattern>
          format /^(?<time>.+) (?<stream>stdout|stderr) [^ ]* (?<log>.*)$/
          time_format %Y-%m-%dT%H:%M:%S.%N%:z
        </pattern>
      </parse>
    </source>

    # Detect exceptions in the log output and forward them as one log entry.
    <match raw.kubernetes.**>
      @id raw.kubernetes
      @type detect_exceptions
      remove_tag_prefix raw
      message log
      stream stream
      multiline_flush_interval 5
      max_bytes 500000
      max_lines 1000
    </match>

    # Concatenate multi-line logs
    <filter **>
      @id filter_concat
      @type concat
      key message
      multiline_end_regexp /\n$/
      separator ""
    </filter>

    # Enriches records with Kubernetes metadata
    <filter kubernetes.**>
      @id filter_kubernetes_metadata
      @type kubernetes_metadata
    </filter>

    # Fixes json fields in Elasticsearch
    <filter kubernetes.**>
      @id filter_parser
      @type parser
      key_name log
      reserve_data true
      remove_key_name_field true
      <parse>
        @type multi_format
        <pattern>
          format json
        </pattern>
        <pattern>
          format none
        </pattern>
      </parse>
    </filter>

  system.input.conf: |-
    # Example:
    # 2015-12-21 23:17:22,066 [salt.state       ][INFO    ] Completed state [net.ipv4.ip_forward] at time 23:17:22.066081
    <source>
      @id minion
      @type tail
      format /^(?<time>[^ ]* [^ ,]*)[^\[]*\[[^\]]*\]\[(?<severity>[^ \]]*) *\] (?<message>.*)$/
      time_format %Y-%m-%d %H:%M:%S
      path /var/log/salt/minion
      pos_file /var/log/salt.pos
      tag salt
    </source>

    # Example:
    # Dec 21 23:17:22 gke-foo-1-1-4b5cbd14-node-4eoj startupscript: Finished running startup script /var/run/google.startup.script
    <source>
      @id startupscript.log
      @type tail
      format syslog
      path /var/log/startupscript.log
      pos_file /var/log/es-startupscript.log.pos
      tag startupscript
    </source>

    # Examples:
    # time="2016-02-04T06:51:03.053580605Z" level=info msg="GET /containers/json"
    # time="2016-02-04T07:53:57.505612354Z" level=error msg="HTTP Error" err="No such image: -f" statusCode=404
    # TODO(random-liu): Remove this after cri container runtime rolls out.
    <source>
      @id docker.log
      @type tail
      format /^time="(?<time>[^"]*)" level=(?<severity>[^ ]*) msg="(?<message>[^"]*)"( err="(?<error>[^"]*)")?( statusCode=($<status_code>\d+))?/
      path /var/log/docker.log
      pos_file /var/log/es-docker.log.pos
      tag docker
    </source>

    # Example:
    # 2016/02/04 06:52:38 filePurge: successfully removed file /var/etcd/data/member/wal/00000000000006d0-00000000010a23d1.wal
    <source>
      @id etcd.log
      @type tail
      # Not parsing this, because it doesn't have anything particularly useful to
      # parse out of it (like severities).
      format none
      path /var/log/etcd.log
      pos_file /var/log/es-etcd.log.pos
      tag etcd
    </source>

    # Multi-line parsing is required for all the kube logs because very large log
    # statements, such as those that include entire object bodies, get split into
    # multiple lines by glog.

    # Example:
    # I0204 07:32:30.020537    3368 server.go:1048] POST /stats/container/: (13.972191ms) 200 [[Go-http-client/1.1] 10.244.1.3:40537]
    <source>
      @id kubelet.log
      @type tail
      format multiline
      multiline_flush_interval 5s
      format_firstline /^\w\d{4}/
      format1 /^(?<severity>\w)(?<time>\d{4} [^\s]*)\s+(?<pid>\d+)\s+(?<source>[^ \]]+)\] (?<message>.*)/
      time_format %m%d %H:%M:%S.%N
      path /var/log/kubelet.log
      pos_file /var/log/es-kubelet.log.pos
      tag kubelet
    </source>

    # Example:
    # I1118 21:26:53.975789       6 proxier.go:1096] Port "nodePort for kube-system/default-http-backend:http" (:31429/tcp) was open before and is still needed
    <source>
      @id kube-proxy.log
      @type tail
      format multiline
      multiline_flush_interval 5s
      format_firstline /^\w\d{4}/
      format1 /^(?<severity>\w)(?<time>\d{4} [^\s]*)\s+(?<pid>\d+)\s+(?<source>[^ \]]+)\] (?<message>.*)/
      time_format %m%d %H:%M:%S.%N
      path /var/log/kube-proxy.log
      pos_file /var/log/es-kube-proxy.log.pos
      tag kube-proxy
    </source>

    # Example:
    # I0204 07:00:19.604280       5 handlers.go:131] GET /api/v1/nodes: (1.624207ms) 200 [[kube-controller-manager/v1.1.3 (linux/amd64) kubernetes/6a81b50] 127.0.0.1:38266]
    <source>
      @id kube-apiserver.log
      @type tail
      format multiline
      multiline_flush_interval 5s
      format_firstline /^\w\d{4}/
      format1 /^(?<severity>\w)(?<time>\d{4} [^\s]*)\s+(?<pid>\d+)\s+(?<source>[^ \]]+)\] (?<message>.*)/
      time_format %m%d %H:%M:%S.%N
      path /var/log/kube-apiserver.log
      pos_file /var/log/es-kube-apiserver.log.pos
      tag kube-apiserver
    </source>

    # Example:
    # I0204 06:55:31.872680       5 servicecontroller.go:277] LB already exists and doesn't need update for service kube-system/kube-ui
    <source>
      @id kube-controller-manager.log
      @type tail
      format multiline
      multiline_flush_interval 5s
      format_firstline /^\w\d{4}/
      format1 /^(?<severity>\w)(?<time>\d{4} [^\s]*)\s+(?<pid>\d+)\s+(?<source>[^ \]]+)\] (?<message>.*)/
      time_format %m%d %H:%M:%S.%N
      path /var/log/kube-controller-manager.log
      pos_file /var/log/es-kube-controller-manager.log.pos
      tag kube-controller-manager
    </source>

    # Example:
    # W0204 06:49:18.239674       7 reflector.go:245] pkg/scheduler/factory/factory.go:193: watch of *api.Service ended with: 401: The event in requested index is outdated and cleared (the requested history has been cleared [2578313/2577886]) [2579312]
    <source>
      @id kube-scheduler.log
      @type tail
      format multiline
      multiline_flush_interval 5s
      format_firstline /^\w\d{4}/
      format1 /^(?<severity>\w)(?<time>\d{4} [^\s]*)\s+(?<pid>\d+)\s+(?<source>[^ \]]+)\] (?<message>.*)/
      time_format %m%d %H:%M:%S.%N
      path /var/log/kube-scheduler.log
      pos_file /var/log/es-kube-scheduler.log.pos
      tag kube-scheduler
    </source>

    # Example:
    # I0603 15:31:05.793605       6 cluster_manager.go:230] Reading config from path /etc/gce.conf
    <source>
      @id glbc.log
      @type tail
      format multiline
      multiline_flush_interval 5s
      format_firstline /^\w\d{4}/
      format1 /^(?<severity>\w)(?<time>\d{4} [^\s]*)\s+(?<pid>\d+)\s+(?<source>[^ \]]+)\] (?<message>.*)/
      time_format %m%d %H:%M:%S.%N
      path /var/log/glbc.log
      pos_file /var/log/es-glbc.log.pos
      tag glbc
    </source>

    # Example:
    # I0603 15:31:05.793605       6 cluster_manager.go:230] Reading config from path /etc/gce.conf
    <source>
      @id cluster-autoscaler.log
      @type tail
      format multiline
      multiline_flush_interval 5s
      format_firstline /^\w\d{4}/
      format1 /^(?<severity>\w)(?<time>\d{4} [^\s]*)\s+(?<pid>\d+)\s+(?<source>[^ \]]+)\] (?<message>.*)/
      time_format %m%d %H:%M:%S.%N
      path /var/log/cluster-autoscaler.log
      pos_file /var/log/es-cluster-autoscaler.log.pos
      tag cluster-autoscaler
    </source>

    # Logs from systemd-journal for interesting services.
    # TODO(random-liu): Remove this after cri container runtime rolls out.
    <source>
      @id journald-docker
      @type systemd
      matches [{ "_SYSTEMD_UNIT": "docker.service" }]
      <storage>
        @type local
        persistent true
        path /var/log/journald-docker.pos
      </storage>
      read_from_head true
      tag docker
    </source>

    <source>
      @id journald-container-runtime
      @type systemd
      matches [{ "_SYSTEMD_UNIT": "{{ fluentd_container_runtime_service }}.service" }]
      <storage>
        @type local
        persistent true
        path /var/log/journald-container-runtime.pos
      </storage>
      read_from_head true
      tag container-runtime
    </source>

    <source>
      @id journald-kubelet
      @type systemd
      matches [{ "_SYSTEMD_UNIT": "kubelet.service" }]
      <storage>
        @type local
        persistent true
        path /var/log/journald-kubelet.pos
      </storage>
      read_from_head true
      tag kubelet
    </source>

    <source>
      @id journald-node-problem-detector
      @type systemd
      matches [{ "_SYSTEMD_UNIT": "node-problem-detector.service" }]
      <storage>
        @type local
        persistent true
        path /var/log/journald-node-problem-detector.pos
      </storage>
      read_from_head true
      tag node-problem-detector
    </source>

    <source>
      @id kernel
      @type systemd
      matches [{ "_TRANSPORT": "kernel" }]
      <storage>
        @type local
        persistent true
        path /var/log/kernel.pos
      </storage>
      <entry>
        fields_strip_underscores true
        fields_lowercase true
      </entry>
      read_from_head true
      tag kernel
    </source>

  forward.input.conf: |-
    # Takes the messages sent over TCP
    <source>
      @id forward
      @type forward
    </source>

  monitoring.conf: |-
    # Prometheus Exporter Plugin
    # input plugin that exports metrics
    <source>
      @id prometheus
      @type prometheus
    </source>

    <source>
      @id monitor_agent
      @type monitor_agent
    </source>

    # input plugin that collects metrics from MonitorAgent
    <source>
      @id prometheus_monitor
      @type prometheus_monitor
      <labels>
        host ${hostname}
      </labels>
    </source>

    # input plugin that collects metrics for output plugin
    <source>
      @id prometheus_output_monitor
      @type prometheus_output_monitor
      <labels>
        host ${hostname}
      </labels>
    </source>

    # input plugin that collects metrics for in_tail plugin
    <source>
      @id prometheus_tail_monitor
      @type prometheus_tail_monitor
      <labels>
        host ${hostname}
      </labels>
    </source>

  output.conf: |-
    <match **>
      @id elasticsearch
      @type elasticsearch
      @log_level info
      type_name _doc
      include_tag_key true
      host elasticsearch-logging
      port 9200
      logstash_format true
      <buffer>
        @type file
        path /var/log/fluentd-buffers/kubernetes.system.buffer
        flush_mode interval
        retry_type exponential_backoff
        flush_thread_count 2
        flush_interval 5s
        retry_forever
        retry_max_interval 30
        chunk_limit_size 2M
        total_limit_size 500M
        overflow_action block
      </buffer>
    </match>
5、fluentd-es-ds.yaml
apiVersion: v1
kind: ServiceAccount
metadata:
  name: fluentd-es
  namespace: logging
  labels:
    k8s-app: fluentd-es
    addonmanager.kubernetes.io/mode: Reconcile
---
kind: ClusterRole
apiVersion: rbac.authorization.k8s.io/v1
metadata:
  name: fluentd-es
  labels:
    k8s-app: fluentd-es
    addonmanager.kubernetes.io/mode: Reconcile
rules:
- apiGroups:
  - ""
  resources:
  - "namespaces"
  - "pods"
  verbs:
  - "get"
  - "watch"
  - "list"
---
kind: ClusterRoleBinding
apiVersion: rbac.authorization.k8s.io/v1
metadata:
  name: fluentd-es
  labels:
    k8s-app: fluentd-es
    addonmanager.kubernetes.io/mode: Reconcile
subjects:
- kind: ServiceAccount
  name: fluentd-es
  namespace: logging
  apiGroup: ""
roleRef:
  kind: ClusterRole
  name: fluentd-es
  apiGroup: ""
---
apiVersion: apps/v1
kind: DaemonSet
metadata:
  name: fluentd-es-v3.1.1
  namespace: logging
  labels:
    k8s-app: fluentd-es
    version: v3.1.1
    addonmanager.kubernetes.io/mode: Reconcile
spec:
  selector:
    matchLabels:
      k8s-app: fluentd-es
      version: v3.1.1
  template:
    metadata:
      labels:
        k8s-app: fluentd-es
        version: v3.1.1
    spec:
      securityContext:
        seccompProfile:
          type: RuntimeDefault
      priorityClassName: system-node-critical
      serviceAccountName: fluentd-es
      containers:
      - name: fluentd-es
        image: quay.io/fluentd_elasticsearch/fluentd:v3.1.0
        env:
        - name: FLUENTD_ARGS
          value: --no-supervisor -q
        resources:
          limits:
            memory: 500Mi
          requests:
            cpu: 100m
            memory: 200Mi
        volumeMounts:
        - name: varlog
          mountPath: /var/log
        - name: varlibdockercontainers
          mountPath: /var/lib/docker/containers
          readOnly: true
        - name: config-volume
          mountPath: /etc/fluent/config.d
        ports:
        - containerPort: 24231
          name: prometheus
          protocol: TCP
        livenessProbe:
          tcpSocket:
            port: prometheus
          initialDelaySeconds: 5
          timeoutSeconds: 10
        readinessProbe:
          tcpSocket:
            port: prometheus
          initialDelaySeconds: 5
          timeoutSeconds: 10
      terminationGracePeriodSeconds: 30
      volumes:
      - name: varlog
        hostPath:
          path: /var/log
      - name: varlibdockercontainers
        hostPath:
          path: /var/lib/docker/containers
      - name: config-volume
        configMap:
          name: fluentd-es-config-v0.2.1
6、kibana-deployment.yaml
apiVersion: apps/v1
kind: Deployment
metadata:
  name: kibana-logging
  namespace: logging
  labels:
    k8s-app: kibana-logging
    addonmanager.kubernetes.io/mode: Reconcile
spec:
  replicas: 1
  selector:
    matchLabels:
      k8s-app: kibana-logging
  template:
    metadata:
      labels:
        k8s-app: kibana-logging
    spec:
      securityContext:
        seccompProfile:
          type: RuntimeDefault
      containers:
        - name: kibana-logging
          image: docker.elastic.co/kibana/kibana-oss:7.10.2
          resources:
            # need more cpu upon initialization, therefore burstable class
            limits:
              cpu: 1000m
            requests:
              cpu: 100m
          env:
            - name: ELASTICSEARCH_HOSTS
              value: http://elasticsearch-logging:9200
            - name: SERVER_NAME
              value: kibana-logging
            - name: SERVER_BASEPATH
              value: /api/v1/namespaces/logging/services/kibana-logging/proxy
            - name: SERVER_REWRITEBASEPATH
              value: "false"
          ports:
            - containerPort: 5601
              name: ui
              protocol: TCP
          livenessProbe:
            httpGet:
              path: /api/status
              port: ui
            initialDelaySeconds: 5
            timeoutSeconds: 10
          readinessProbe:
            httpGet:
              path: /api/status
              port: ui
            initialDelaySeconds: 5
            timeoutSeconds: 10
7、kibana-service.yaml
apiVersion: apps/v1
kind: Deployment
metadata:
  name: kibana-logging
  namespace: logging
  labels:
    k8s-app: kibana-logging
    addonmanager.kubernetes.io/mode: Reconcile
spec:
  replicas: 1
  selector:
    matchLabels:
      k8s-app: kibana-logging
  template:
    metadata:
      labels:
        k8s-app: kibana-logging
    spec:
      securityContext:
        seccompProfile:
          type: RuntimeDefault
      containers:
        - name: kibana-logging
          image: docker.elastic.co/kibana/kibana-oss:7.10.2
          resources:
            # need more cpu upon initialization, therefore burstable class
            limits:
              cpu: 1000m
            requests:
              cpu: 100m
          env:
            - name: ELASTICSEARCH_HOSTS
              value: http://elasticsearch-logging:9200
            - name: SERVER_NAME
              value: kibana-logging
            - name: SERVER_BASEPATH
              value: /api/v1/namespaces/logging/services/kibana-logging/proxy
            - name: SERVER_REWRITEBASEPATH
              value: "false"
          ports:
            - containerPort: 5601
              name: ui
              protocol: TCP
          livenessProbe:
            httpGet:
              path: /api/status
              port: ui
            initialDelaySeconds: 5
            timeoutSeconds: 10
          readinessProbe:
            httpGet:
              path: /api/status
              port: ui
            initialDelaySeconds: 5
            timeoutSeconds: 10