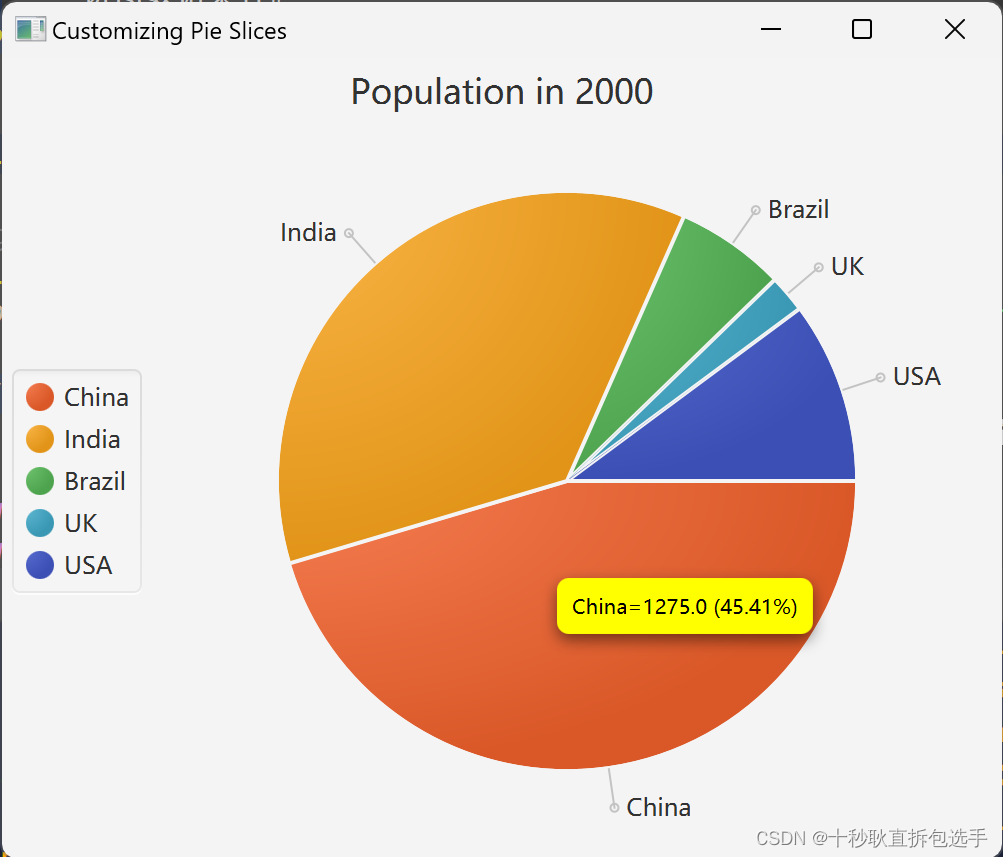
PieChart是JavaFX中的饼图,示例如下:
PieChartUtil.java文件,饼图数据设置。
package javafx8.ch29;

import javafx.collections.FXCollections;
import javafx.collections.ObservableList;
import javafx.scene.chart.PieChart;

/**
 * @copyright 2023-2022
 * @package   javafx8.ch29
 * @file      PieChartUtil.java
 * @date      2023-08-31 14:22
 * @author    qiao wei
 * @version   1.0
 * @brief     饼图数据集合。
 * @history
 */
public class PieChartUtil {

    public static ObservableList<PieChart.Data> getChartData() {
        ObservableList<PieChart.Data> data = FXCollections. observableArrayList();

        /**
         * 将要显示的饼图数据添加到列表中,参数1是表头显示的内容,参数2是饼图要显示的数据。
         */
        data.add(new PieChart.Data("China", 1275));
        data.add(new PieChart.Data("India", 1017));
        data.add(new PieChart.Data("Brazil", 172));
        data.add(new PieChart.Data("UK", 59));
        data.add(new PieChart.Data("USA", 285));

        // 表头显示数据比例。
//        data.add(new PieChart.Data("China : " + (1275 * 100 / (1275 + 1017 + 172 + 59 + 285) + "%"), 1275));
//        data.add(new PieChart.Data("India : " + (1017 * 100 / (1275 + 1017 + 172 + 59 + 285) + "%"), 1017));
//        data.add(new PieChart.Data("Brazil : " + (172 * 100 / (1275 + 1017 + 172 + 59 + 285) + "%"), 172));
//        data.add(new PieChart.Data("UK : " + (59 * 100 / (1275 + 1017 + 172 + 59 + 285) + "%"), 59));
//        data.add(new PieChart.Data("USA : " + (285 * 100 / (1275 + 1017 + 172 + 59 + 285) + "%"), 285));

        return data;
    }
}
PieChartTest.java文件,显示饼图数据
package javafx8.ch29;

import javafx.application.Application;
import javafx.collections.ObservableList;
import javafx.geometry.Side;
import javafx.scene.Node;
import javafx.scene.Scene;
import javafx.scene.chart.PieChart;
import javafx.scene.control.Tooltip;
import javafx.scene.layout.StackPane;
import javafx.stage.Stage;
import javafx.util.Duration;

/**
 * @copyright 2023-2022
 * @package   javafx8.ch29
 * @file      PieSliceTest.java
 * @date      2023-08-31 16:23
 * @author    qiao wei
 * @version   1.0
 * @brief
 * @history
 */
public class PieSliceTest extends Application {

    public static void main(String[] args) {
        Application.launch(PieSliceTest.class, args);
    }

    @Override
    public void start(Stage stage) throws Exception {
        PieChart chart = new PieChart();
        chart.setTitle("Population in 2000");

        // Place the legend on the left side
        chart.setLegendSide(Side.LEFT);

        // Set the data for the chart
        ObservableList<PieChart.Data> chartData = PieChartUtil.getChartData();
        chart.setData(chartData);

        // Add a Tooltip to all pie slices
        this.addSliceTooltip(chart);
        StackPane root = new StackPane(chart);
        Scene scene = new Scene(root);

        stage.setScene(scene);
        stage.setTitle("Customizing Pie Slices");
        stage.show();
    }

    private void addSliceTooltip(PieChart chart) {
        // Compute the total pie value
        double totalPieValue = 0.0d;

        // Traverse items to compute total value.
        for (PieChart.Data d : chart.getData()) {
            totalPieValue += d.getPieValue();
        }

        // Add a tooltip to all pie slices
        for (PieChart.Data d : chart.getData()) {
            Node sliceNode = d.getNode();
            double pieValue = d.getPieValue();
            double percentPieValue = (pieValue / totalPieValue) * 100;

            // Create and install a Tooltip for the slice
            String message = d.getName() + "=" + pieValue + " (" + String.format("%.2f", percentPieValue) + "%)";
            Tooltip tooltip = new Tooltip(message);
            tooltip.setStyle("-fx-background-color: yellow;" + "-fx-text-fill: black;");
            tooltip.setShowDelay(new Duration(50));
            Tooltip.install(sliceNode, tooltip);
        }
    }
}
运行结果如下:
