页面全部代码
<template>
<div class="data-serve">
<div class="side">
<div class="side-inner">
<router-link class="side-btn" to="/camer/pushInfo"><i class="el-icon-picture"></i>报警信息</router-link>
<router-link style="background: #344886" class="side-btn" to="/camera/live">
<i class="el-icon-picture"></i>统计分析
</router-link>
</div>
</div>
<div class="main">
<div class="chart-side">
<div class="chart-wrapper">
<div class="chart-bg">
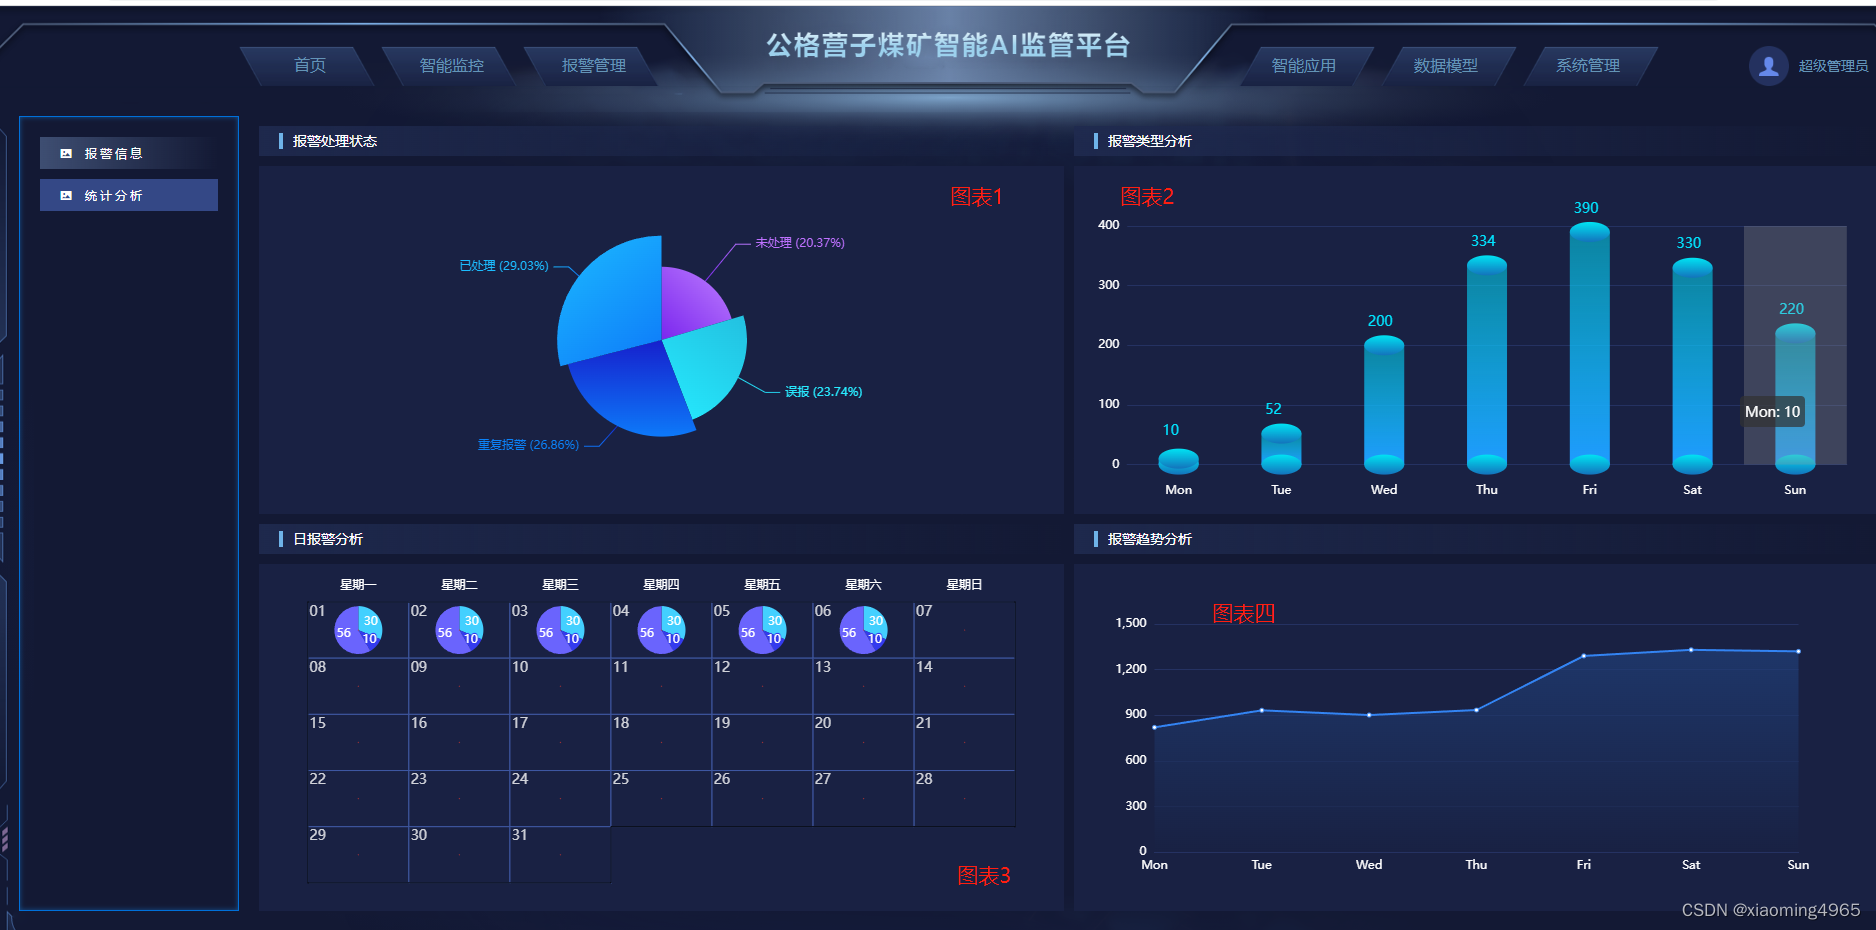
<span>报警处理状态</span>
</div>
<div class="chart">
<div id="pieChart" class="echart-line"></div>
</div>
</div>
<div class="chart-wrapper">
<div class="chart-bg">
<span>报警类型分析</span>
</div>
<div class="chart">
<div id="barChart" class="echart-bar" />
</div>
</div>
</div>
<div class="chart-side">
<div class="chart-wrapper">
<div class="chart-bg">
<span>日报警分析</span>
</div>
<div class="chart">
<div id="scatterChart" class="echart-scatter" />
</div>
</div>
<div class="chart-wrapper">
<div class="chart-bg">
<span>报警趋势分析</span>
</div>
<div class="chart">
<div id="lineChart" class="echart-line"></div>
</div>
</div>
</div>
</div>
</div>
</template>
<script>
export default {
data() {
return {
scatterData: null,
}
},
mounted() {
let _this = this;
this.getPieEcharts(); //饼状图
this.getBarEcharts();//柱状图
this.getScatterEcharts();//日期饼状图
this.getLineEcharts(); //折线图
},
methods: {
//图一饼状图
getPieEcharts() {
let myChart = this.$echarts.init(document.getElementById("pieChart"));
myChart.setOption({
tooltip: {
trigger: 'item'
},
series: [
{
type: 'pie',
radius: '60%',
center: ['50%', '50%'],
// 文字后添加百分比值
label: {
show: true,
formatter(param) {
return param.name + ' (' + param.percent + '%)';
}
},
roseType: 'radius',
itemStyle: {
color: function (params) {
let colorList = [
{
type: 'linear',
x: 0,
y: 1,
x2: 1,
y2: 0,
colorStops: [
{
offset: 0,
color: '#7a26ee',
},
{
offset: 1,
color: '#be7eff',
},
],
global: false,
},
{
type: 'linear',
x: 0,
y: 1,
x2: 1,
y2: 0,
colorStops: [
{
offset: 0,
color: '#25ebff',
},
{
offset: 1,
color: '#23c0e0',
},
],
global: false,
},
{
type: 'linear',
x: 1,
y: 0,
x2: 1,
y2: 1,
colorStops: [
{
offset: 0,
color: '#1620cd',
},
{
offset: 1,
color: '#0d79f9',
},
],
global: false,
},
{
type: 'linear',
x: 1,
y: 1,
x2: 0,
y2: 0,
colorStops: [
{
offset: 0,
color: '#0d79f9',
},
{
offset: 1,
color: '#1cbbff',
},
],
global: false,
},
];
return colorList[params.dataIndex];
},
},
// animationType: 'scale',
// animationEasing: 'elasticOut',
// animationDelay: function (idx) {
// return Math.random() * 200;
// },
data: [
{ value: 335, name: '已处理', label: { color: "#1cbcff" } },
{ value: 310, name: '重复报警', label: { color: "#0b82f9" } },
{ value: 274, name: '误报', label: { color: "#28ebff" } },
{ value: 235, name: '未处理', label: { color: "#be71ff" } },
].sort(function (a, b) {
return a.value - b.value;
}),
}
]
})
window.onresize = myChart.resize;
},
// 图2柱状图
getBarEcharts() {
let barChart = this.$echarts.init(document.getElementById("barChart"));
barChart.setOption({
tooltip: {
trigger: 'axis',
formatter: function (params) {
let result = '';
params.forEach(function (item) {
console.log(item, 123);
if (item.seriesType === 'bar') { // 如果是柱体,则获取对应的系列名称和值
result += item.name + ': ' + item.value + '<br/>';
}
});
return result;
},
axisPointer: {
type: 'shadow',
}
},
grid: {
left: '3%',
right: '4%',
bottom: '5%',
containLabel: true
},
xAxis: [
{
type: 'category',
data: ['Mon', 'Tue', 'Wed', 'Thu', 'Fri', 'Sat', 'Sun'],
axisTick: {
show: false,
},
//x轴颜色
axisLine: {
lineStyle: {
color: '#253262',
},
},
// x轴文字的颜色设置为白色
axisLabel: {
color: '#fff',
margin: 20,
},
},
],
yAxis: [
{
type: 'value',
// 不显示y轴的线
axisLine: {
show: false
},
// 不显示y轴刻度
axisTick: {
show: false
},
// 分割线颜色
splitLine: {
lineStyle: {
color: '#253262',
// type: 'dashed' //虚线
}
},
// y轴刻度文字颜色设置为白色
axisLabel: {
color: "#fff",
},
}
],
series: [
// 底部的椭圆形(象形柱图):pictorialBar
{
type: "pictorialBar", // pictorialBar(象形柱图)
label: { // 图形上的文本标签,可用于说明图像的一些数据信息,比如值,名称等
show: true, //是否显示标签
position: ['25', '-30'], // 标签的位置(可以是绝对的像素值或者百分比['50%','50%',也可以是top,left等])
color: '#01E4FF',
fontSize: 14
},
symbolSize: [40, 20], // 图形的大小用数组分别比表示宽和高,也乐意设置成10相当于[10,10]
symbolOffset: [0, 10], // 图形相对于原本位置的偏移
z: 12, // 象形柱状图组件的所有图形的 z 值.控制图形的前后顺序.z 值小的图形会被 z 值大的图形覆盖.
itemStyle: { // 图形样式
// echarts.graphic.LinearGradient(echarts内置的渐变色生成器)
// 4个参数用于配置渐变色的起止位置,这4个参数依次对应右 下 左 上
color: {
type: 'linear',
x: 0,
y: 0,
x2: 0,
y2: 1,
colorStops: [ // 渐变颜色
{
offset: 0,
color: '#00e3f3',
},
{
offset: 1,
color: '#1373bc',
},
],
global: false,
},
},
data: [10, 52, 200, 334, 390, 330, 220]
},
// 中间的长方形柱状图(柱状图):bar
{
type: 'bar', // 柱状图
barWidth: 40, // 柱条的宽度,不设时自适应
barGap: '0%', // 柱子与柱子之间的距离
itemStyle: { // 图形样式
// color支持(rgb(255,255,255)、rgba(255,255,255,1)、#fff,也支持渐变色和纹理填充)
// 下面就是使用线性渐变
color: {
"x": 0,
"y": 0,
"x2": 0,
"y2": 1,
"type": "linear",
"global": false,
"colorStops": [{
"offset": 0, // 0%处的颜色
"color": "rgba(0,229,255,0.5)"
}, {
"offset": 1, // 100%处的颜色
"color": "#1F9BFF"
}]
},
},
data: [10, 52, 200, 334, 390, 330, 220]
},
// 顶部的椭圆形(象形柱图):pictorialBar
{
type: "pictorialBar",
symbolSize: [40, 20],
symbolOffset: [0, -10],
z: 12,
symbolPosition: "end",
itemStyle: {
color: {
type: 'linear',
x: 0,
y: 0,
x2: 0,
y2: 1,
colorStops: [ // 渐变颜色
{
offset: 0,
color: '#00e3f3',
},
{
offset: 1,
color: '#1373bc',
},
],
global: false,
},
},
data: [10, 52, 200, 334, 390, 330, 220]
}
]
})
window.addEventListener("resize", function () {
// 让我们的图表调用 resize这个方法
barChart.resize();
})
},
// 图3图表
getScatterEcharts() {
this.scatterData = this.$echarts.init(document.getElementById("scatterChart"));
let cellSize = [window.innerWidth / 19, window.innerHeight / 17];
let pieRadius = window.innerWidth / 80;
//饼图数据从后端获取
let json = [
{ "data": [{ "name": "已完成", "value": 30, itemStyle: { color: '#43d0ff' } }, { "name": "未完成", "value": 10, itemStyle: { color: '#343bee' } }, { "name": "未巡查", "value": 56, itemStyle: { color: '#6a64fd' } }] },
{ "data": [{ "name": "已完成", "value": 30, itemStyle: { color: '#43d0ff' } }, { "name": "未完成", "value": 10, itemStyle: { color: '#343bee' } }, { "name": "未巡查", "value": 56, itemStyle: { color: '#6a64fd' } }] },
{ "data": [{ "name": "已完成", "value": 30, itemStyle: { color: '#43d0ff' } }, { "name": "未完成", "value": 10, itemStyle: { color: '#343bee' } }, { "name": "未巡查", "value": 56, itemStyle: { color: '#6a64fd' } }] },
{ "data": [{ "name": "已完成", "value": 30, itemStyle: { color: '#43d0ff' } }, { "name": "未完成", "value": 10, itemStyle: { color: '#343bee' } }, { "name": "未巡查", "value": 56, itemStyle: { color: '#6a64fd' } }] },
{ "data": [{ "name": "已完成", "value": 30, itemStyle: { color: '#43d0ff' } }, { "name": "未完成", "value": 10, itemStyle: { color: '#343bee' } }, { "name": "未巡查", "value": 56, itemStyle: { color: '#6a64fd' } }] },
{ "data": [{ "name": "已完成", "value": 30, itemStyle: { color: '#43d0ff' } }, { "name": "未完成", "value": 10, itemStyle: { color: '#343bee' } }, { "name": "未巡查", "value": 56, itemStyle: { color: '#6a64fd' } }] },
]
let startDate = '2017-05'; //开始值从后端获取
let endDate = '2017-06'; //结束值从后端获取
// let data_name = ['已完成', '未完成', '未巡查'];//该出应该是从数据库中读取data_name
let options = this.calendar(cellSize, pieRadius, startDate, endDate, json);
options && this.scatterData.setOption(options)
},
calendar(cellSize, pieRadius, startDate, endDate, json, data_name) {
let data_arr = [];
let _this = this;
for (let i = 0; i < json.length; i++) {
data_arr.push(json[i].data);
}
function getVirtulData() {
let date = +(_this.$echarts.number.parseDate(startDate));
let end = +(_this.$echarts.number.parseDate(endDate));
let dayTime = 3600 * 24 * 1000;
let data = [];
for (let time = date; time < end; time += dayTime) {
data.push([
_this.$echarts.format.formatTime('yyyy-MM-dd', time),
Math.floor(Math.random() * 10000)
]);
}
return data;
}
function getPieSeries(scatterData, chart) {
return _this.$echarts.util.map(scatterData, function (item, index) {
let center = chart.convertToPixel('calendar', item);
return {
id: index + 'pie',
type: 'pie',
center: center,
label: {
normal: {
formatter: '{c}',
position: 'inside'
}
},
radius: pieRadius,
data: data_arr[index]
};
});
}
// 使用刚指定的配置项和数据显示图表。
function getPieSeriesUpdate(scatterData, chart) {
return _this.$echarts.util.map(scatterData, function (item, index) {
let center = chart.convertToPixel('calendar', item);
return {
id: index + 'pie',
center: center
};
});
}
let scatterData = getVirtulData();
let option = {
tooltip: {},
// legend: {
// data: data_name,
// bottom: 20
// },
calendar: {
top: '38', //图表位置
left: 'center', //横向
orient: 'vertical',
cellSize: cellSize, //尺寸
yearLabel: {
show: false,
textStyle: {
fontSize: 30
},
},
itemStyle: {
borderColor: '#3f58a3', // 边框颜色
borderWidth: 1, // 边框宽度
color: '#192143'
},
// //星期表头位置,颜色
dayLabel: {
margin: 10,
firstDay: 1,
nameMap: ['星期日', '星期一', '星期二', '星期三', '星期四', '星期五', '星期六'],
color: '#fff',
},
//左侧月份隐藏
monthLabel: {
show: false,
},
range: [startDate], // 后端获取起始范围
},
series: [{
id: 'label',
type: 'scatter',
coordinateSystem: 'calendar', //指定饼图所使用的坐标系为日历坐标系。在日历坐标系中,每个日期对应图表中的一个格子
symbolSize: 1,
label: {
normal: {
show: true,
// 使用时间格式化函数将日期显示为天数
formatter: function (params) {
return _this.$echarts.format.formatTime('dd', params.value[0]);
},
offset: [-cellSize[0] / 2 + 10, -cellSize[1] / 2 + 10],// 标签位置的偏移量
textStyle: {
color: '#fff',
fontSize: 14
},
},
},
data: scatterData // 天数
}]
};
// 监听窗口大小变化事件
window.addEventListener("resize", () => {
cellSize = [window.innerWidth / 19, window.innerHeight / 17];
pieRadius = window.innerWidth / 80;
this.scatterData.setOption(this.calendar(cellSize, pieRadius, startDate, endDate, json, data_name));
this.scatterData.resize();
});
if (!_this.scatterData.inNode) {
let pieInitialized;
setTimeout(function () {
pieInitialized = true;
// 初始化饼图的系列
_this.scatterData.setOption({
series: getPieSeries(scatterData, _this.scatterData)
});
}, 10);
}
return option;
},
// 图4折线图
getLineEcharts() {
let lineChart = this.$echarts.init(document.getElementById("lineChart"));
lineChart.setOption({
tooltip: {
trigger: 'axis',
axisPointer: {
type: 'shadow',
}
},
xAxis: {
type: 'category',
boundaryGap: false,
axisTick: {
show: false,
},
//x轴颜色
axisLine: {
lineStyle: {
color: '#253262',
},
},
// x轴文字的颜色设置为白色
axisLabel: {
color: '#fff'
},
data: ['Mon', 'Tue', 'Wed', 'Thu', 'Fri', 'Sat', 'Sun']
},
yAxis: {
type: 'value',
// 不显示y轴的线
axisLine: {
show: false
},
// 不显示y轴刻度
axisTick: {
show: false
},
// 分割线颜色
splitLine: {
lineStyle: {
color: '#253262',
// type: 'dashed' //虚线
}
},
// y轴刻度文字颜色设置为白色
axisLabel: {
color: "#fff",
},
},
series: [
{
data: [820, 932, 901, 934, 1290, 1330, 1320],
type: 'line',
color: '#3384f3',
areaStyle: {
color: {
type: 'linear',
x: 0,
y: 0,
x2: 0,
y2: 1,
colorStops: [ // 渐变颜色
{
offset: 0,
color: '#213f79',
},
{
offset: 1,
color: '#192143',
},
],
global: false,
},
}
}
]
})
window.addEventListener("resize", function () {
// 让我们的图表调用 resize这个方法
lineChart.resize();
})
},
}
}
</script>
<style lang="scss" scoped>
.data-serve {
width: 100%;
height: 100%;
display: flex;
padding: 30px 10px 0 10px;
.side {
width: 240px;
box-sizing: border-box;
height: 100%;
padding-left: 20px;
.side-inner {
width: 100%;
height: 100%;
box-shadow: 0 0 5px rgba(20, 120, 210, 0.6) inset;
border: 1px solid #0070da;
padding: 10px 20px 20px 20px;
.side-btn {
width: 100%;
display: block;
color: #fff;
font-size: 12px;
margin-top: 10px;
padding: 8px 10px 8px 20px;
letter-spacing: 3px;
background-image: linear-gradient(to right, #3e4e72, transparent);
i {
margin-right: 10px;
}
}
}
}
.main {
width: calc(100% - 240px);
height: 100%;
padding: 0 20px;
.chart-side {
display: flex;
width: 100%;
height: calc(100% / 2 - 10px);
justify-content: space-between;
margin-top: 10px;
.chart-wrapper {
width: calc(100% / 2 - 5px);
height: 100%;
.chart-bg {
width: 100%;
height: 30px;
line-height: 30px;
padding-left: 20px;
font-size: 14px;
background-image: linear-gradient(to right, rgba(31, 42, 79, 0.9), rgba(255, 0, 0, 0));
color: #fff;
span {
border-left: 4px solid #6fb3e8;
padding-left: 10px;
}
}
.chart {
width: 100%;
height: calc(100% - 40px);
background-color: #192143;
margin-top: 10px;
.pieChart,
.echart-line,
.echart-scatter,
.echart-bar {
width: 100%;
height: 100%;
}
}
}
}
}
}
</style>