❤ echarts柱状图的使用及详细配置
一、Echarts 柱形图详细配置
1、 简单引入
import * as echarts from 'echarts';// 5.4区别4引入方式
// 结构
<div id="echartzhu" style="width: 100%;height: 200px;"></div>

// 渲染
this.echartzhu('echartzhu');
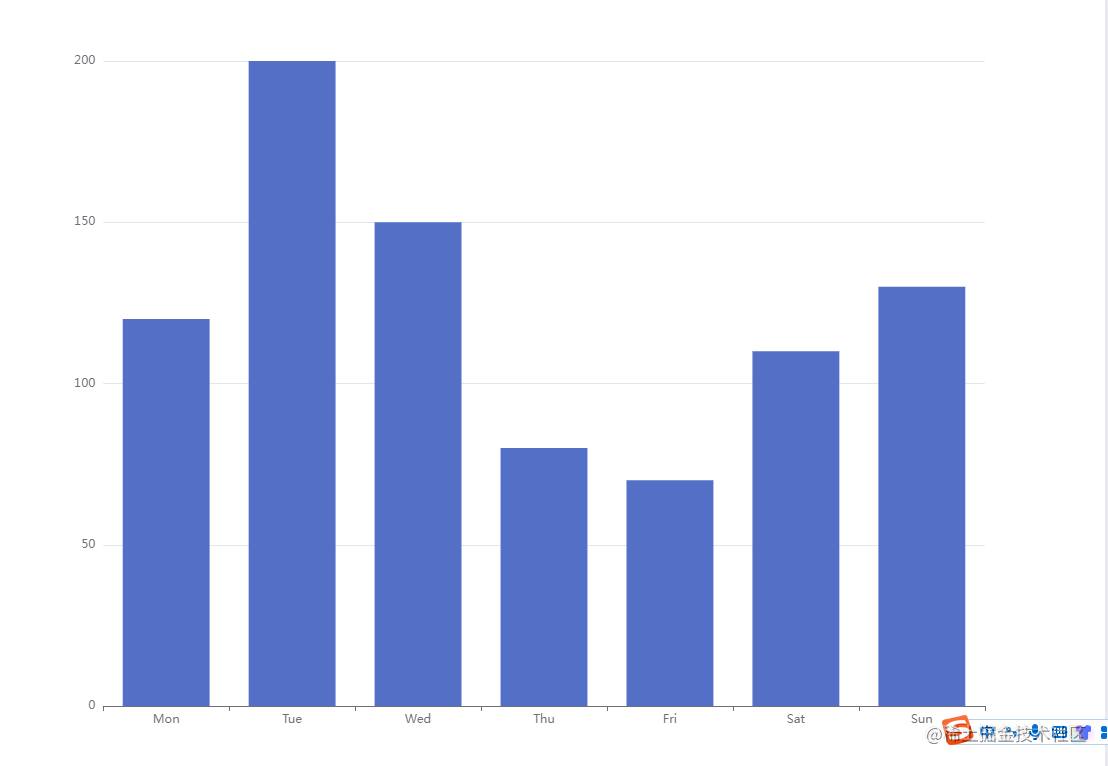
2、方法渲染
 echartzhu(id){
      let myChart = echarts.init(document.getElementById(id));
      let option = {
          xAxis: {
            type: 'category',
            data: ['Mon', 'Tue', 'Wed', 'Thu', 'Fri', 'Sat', 'Sun']
          },
          yAxis: { type: 'value'},
          series: [
            {
              data: [120, 200, 150, 80, 70, 110, 130],
              type: 'bar',
            }
          ]
        };
      myChart.setOption(option);
   },
二、基础案例
-实现的echarts柱状图示例
yAxis: [
        {
            type: 'category',
            axisTick: {
                show: false
            },
            data: ['周一', '周二', '周三', '周四', '周五', '周六', '周日'],
            axisLabel:{
                fontSize: 100,  //控制字体大小
            },
        }
    ],
三、进阶案例
1、echarts柱状图示例图
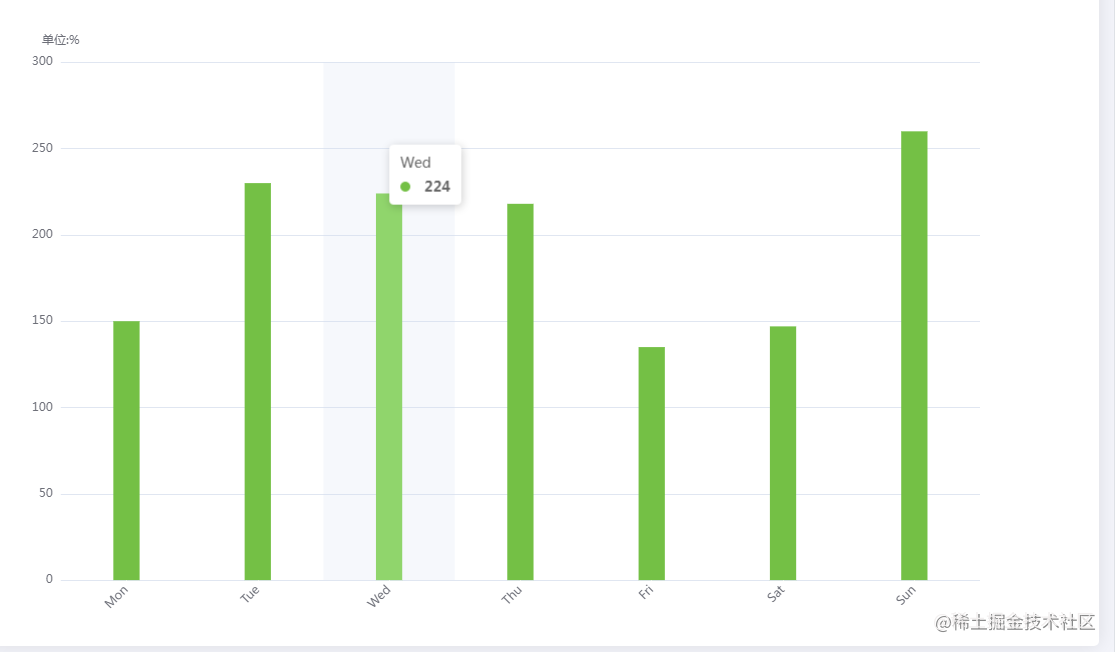
- echarts柱状图代码
option = {

        // title: {
        //   text: '您的疾病风险排名',
        //   left: 'center',
        //   textStyle: { //标题内容的样式
        //     color: '#000', //
        //     fontStyle: 'normal', //lic主标题文字字体风格,默认normal,有italic(斜体),oblique(斜体)
        //     fontWeight: "bold", //可选normal(正常),bold(加粗),bolder(加粗),lighter(变细),100|200|300|400|500...
        //     fontFamily: "PingFangSC-Regular, PingFang SC", //主题文字字体,默认微软雅黑
        //     fontSize: 20 //主题文字字体大小,默认为18px
        //   },
        // },
        // legend: {
        //   top: '10%',
        //   x: 'center',
        //   textStyle: {
        //     fontSize: 10
        //   },
        //   data:['低危','高位']
        // },

        color: '#74C045',
        tooltip: {
          trigger: 'axis',
          axisPointer: {
            type: 'shadow'
          },
          // formatter: function(params) {
          //   var relVal = params[0].name
          //   for (var i = 0, l = params.length; i < l; i++) {
          //     relVal += '<br/>' + params[i].marker + params[i].seriesName + params[i].value + '%'
          //   }
          //   return relVal
          // }
        },

        grid: {
          top: '16%',
          left: '3%',
          right: '10%',
          bottom: '3%',
          containLabel: true
        },
        xAxis: [{
          type: 'category',
          data:  ['Mon', 'Tue', 'Wed', 'Thu', 'Fri', 'Sat', 'Sun'],
          axisLabel: { //展示角度
            rotate: 45,
            // color: function(value, index) {
            //     return xFontcolor[index]
            //   },
          },
          axisLine: { //y轴线的配置
            show: false, //是否展示
          },
          axisTick: {
            alignWithLabel: true,
            lineStyle: { color: '#fff' }
          },
        }],
        yAxis: [{
          name:'单位:%',
          type: 'value',
          axisLine: { //y轴线的配置
            show: false, //是否展示
          },
          axisTick: { lineStyle: { color: '#fff' } }
        }],
        series: [{
          name: '',
          type: 'bar',
          barWidth: '20%',
          data: [150, 230, 224, 218, 135, 147, 260],
        }]
};
//  ------  X轴 ------

  xAxis: {

    show: true,  // 是否显示

    position: 'bottom',  // x轴的位置

    offset: 0, // x轴相对于默认位置的偏移

    type: 'category',   // 轴类型, 默认为 'category'

    name: '月份',    // 轴名称

    nameLocation: 'end',  // 轴名称相对位置

    nameTextStyle: {   // 坐标轴名称样式

      color: 'red',

      padding: [5, 0, 0, -5]

    },
    `series : [`

`          ``{`

`            ``name:``'销量'``,`

`            ``type:``'bar'``,`

`            ``stack: ``'总量'``,`

`            ``barWidth : 40, ``//柱图宽度`

`           ``}`

`         ``]`

    nameGap: 15, // 坐标轴名称与轴线之间的距离

    nameRotate: 0,  // 坐标轴名字旋转

    axisLine: {       // 坐标轴 轴线

      show: true,  // 是否显示

      symbol: ['none', 'arrow'],  // 是否显示轴线箭头

      symbolSize: [8, 8], // 箭头大小

      symbolOffset: [0, 7],  // 箭头位置

      // ------   线 ---------

      lineStyle: {

        color: 'blue',

        width: 1,

        type: 'solid'

      }

    },

    axisTick: {    // 坐标轴 刻度

      show: true,  // 是否显示

      inside: true,  // 是否朝内

      length: 3,     // 长度

      lineStyle: {   // 默认取轴线的样式

        color: 'red',

        width: 1,

        type: 'solid'

      }

    },

    axisLabel: {    // 坐标轴标签

      show: true,  // 是否显示

      inside: false, // 是否朝内

      rotate: 0, // 旋转角度

      margin: 5, // 刻度标签与轴线之间的距离

      color: 'red'  // 默认取轴线的颜色

    },