1. 逻辑回归模型
import numpy as np

class LogisticRegression(object):

    def __init__(self, learning_rate=0.1, max_iter=100, seed=None):
        self.seed = seed
        self.lr = learning_rate
        self.max_iter = max_iter

    def fit(self, x, y):
        np.random.seed(self.seed)
        self.w = np.random.normal(loc=0.0, scale=1.0, size=x.shape[1])
        self.b = np.random.normal(loc=0.0, scale=1.0)
        self.x = x
        self.y = y
        for i in range(self.max_iter):
            self._update_step()
            # print('loss: \t{}'.format(self.loss()))
            # print('score: \t{}'.format(self.score()))
            # print('w: \t{}'.format(self.w))
            # print('b: \t{}'.format(self.b))

    def _sigmoid(self, z):
        return 1.0 / (1.0 + np.exp(-z))

    def _f(self, x, w, b):
        z = x.dot(w) + b
        return self._sigmoid(z)

    def predict_proba(self, x=None):
        if x is None:
            x = self.x
        y_pred = self._f(x, self.w, self.b)
        return y_pred

    def predict(self, x=None):
        if x is None:
            x = self.x
        y_pred_proba = self._f(x, self.w, self.b)
        y_pred = np.array([0 if y_pred_proba[i] < 0.5 else 1 for i in range(len(y_pred_proba))])
        return y_pred

    def score(self, y_true=None, y_pred=None):
        if y_true is None or y_pred is None:
            y_true = self.y
            y_pred = self.predict()
        acc = np.mean([1 if y_true[i] == y_pred[i] else 0 for i in range(len(y_true))])
        return acc

    def loss(self, y_true=None, y_pred_proba=None):
        if y_true is None or y_pred_proba is None:
            y_true = self.y
            y_pred_proba = self.predict_proba()
        return np.mean(-1.0 * (y_true * np.log(y_pred_proba) + (1.0 - y_true) * np.log(1.0 - y_pred_proba)))

    def _calc_gradient(self):
        y_pred = self.predict()
        d_w = (y_pred - self.y).dot(self.x) / len(self.y)
        d_b = np.mean(y_pred - self.y)
        return d_w, d_b

    def _update_step(self):
        d_w, d_b = self._calc_gradient()
        self.w = self.w - self.lr * d_w
        self.b = self.b - self.lr * d_b
        return self.w, self.b
这段代码实现了逻辑回归模型的训练和预测过程。
在类的初始化方法 __init__ 中,可以设置学习率 learning_rate、最大迭代次数 max_iter 和
随机种子 seed。
在 fit 方法中,使用随机数生成初始的参数 w 和 b,然后通过迭代更新参数,直到达到最大迭
代次数。在每次更新迭代中,调用 _update_step 方法来更新参数。
在 _sigmoid 方法中,定义了 sigmoid 函数,用于将线性函数的输出转换为概率值。
在 _f 方法中,将输入 x 与参数 w 进行点乘,再加上参数 b,得到线性函数的输出 z。将 z 作
为参数传给 _sigmoid 方法,将线性函数的输出转换为概率值。
在 predict_proba 方法中,根据输入特征和当前的参数预测样本属于正例的概率。sigmoid 函
数的输出范围在 0 到 1 之间,可以看作是样本属于正例的概率。
在 predict 方法中,根据预测的概率值将其转换为二分类的标签值。
在 score 方法中,计算了模型在训练数据上的准确率。首先判断是否提供了自定义的真实标
签 y_true 和预测标签 y_pred,如果没有,则使用类初始化时保存的真实标签 self.y 和调用
predict 方法得到的预测标签。然后,通过列表推导式遍历每个位置的真实标签和预测标签,对比
它们是否相等。如果相等,则在列表中添加 1,表示预测正确;如果不相等,则添加 0,表示预测
错误。接下来,使用 np.mean 方法计算列表中元素的平均值,即计算准确预测的比例。最后,返回
准确率 acc。
在 loss 方法中,计算了模型的损失函数,即交叉熵损失。L(y, p) = - (y * log(p) + (1 - y) *
log(1 - p)),其中,L 表示损失函数,y 是真实标签(取值为0或1),p 是模型的预测概率(取值范
围为0到1)。当 y=1 时,损失函数可以简化为 -log(p),表示模型预测为正类的概率越小,损失越
大。当 y=0 时,损失函数可以简化为 -log(1-p),表示模型预测为负类的概率越小,损失越大。这
个损失函数的思想是,当模型的预测与真实标签一致时,损失接近于0;当模型的预测与真实标签
不一致时,损失增大。通过最小化交叉熵损失函数,可以使模型更好地拟合训练数据,提高分类的
准确性。
在 _calc_gradient 方法中,计算了损失函数对参数的梯度。
在 _update_step 方法中,根据梯度和学习率更新参数。
这段代码的目的是实现逻辑回归模型,并提供了训练、预测、准确率和损失函数等功能。通过迭代
更新参数,模型可以根据输入特征预测样本的类别。
2. 数据分割
import numpy as np

def generate_data(seed):
    np.random.seed(seed)
    data_size_1 = 300
    x1_1 = np.random.normal(loc=5.0, scale=1.0, size=data_size_1)
    x2_1 = np.random.normal(loc=4.0, scale=1.0, size=data_size_1)
    y_1 = [0 for _ in range(data_size_1)]
    data_size_2 = 400
    x1_2 = np.random.normal(loc=10.0, scale=2.0, size=data_size_2)
    x2_2 = np.random.normal(loc=8.0, scale=2.0, size=data_size_2)
    y_2 = [1 for _ in range(data_size_2)]
    x1 = np.concatenate((x1_1, x1_2), axis=0)
    x2 = np.concatenate((x2_1, x2_2), axis=0)
    x = np.hstack((x1.reshape(-1,1), x2.reshape(-1,1)))
    y = np.concatenate((y_1, y_2), axis=0)
    data_size_all = data_size_1+data_size_2
    shuffled_index = np.random.permutation(data_size_all)
    x = x[shuffled_index]
    y = y[shuffled_index]
    return x, y
def train_test_split(x, y):
    split_index = int(len(y)*0.7)
    x_train = x[:split_index]
    y_train = y[:split_index]
    x_test = x[split_index:]
    y_test = y[split_index:]
    return x_train, y_train, x_test, y_test
这段代码实现了数据生成和训练集、测试集分割的功能。下面是对代码的解释:
generate_data(seed) 函数用于生成数据。根据给定的随机种子 seed,使用
np.random.seed(seed) 设置随机种子,保证每次生成的数据一致。生成了两个类别的数据:
第一个类别数据有 300 个样本,通过 np.random.normal 方法生成两个特征 x1_1 和 x2_1,分别服
从均值为 5.0 和 4.0,标准差为 1.0 的正态分布。标签 y_1 全部为 0。第二个类别数据有 400 个样
本,通过 np.random.normal 方法生成两个特征 x1_2 和 x2_2,分别服从均值为 10.0 和 8.0,标准
差为 2.0 的正态分布。标签 y_2 全部为 1。使用 np.concatenate 和 np.hstack 方法将两个类别的
数据合并,并返回特征矩阵 x 和标签向量 y。
np.concatenate 是 NumPy 库中的一个函数,用于将多个数组按指定的轴进行拼接。
np.random.permutation 是 NumPy 库中的一个函数,用于对一个序列或数组进行随机排列。
np.hstack 是 NumPy 库中的一个函数,用于水平(按列)拼接多个数组。
reshape(-1,1)是将数组 x1 重塑为一个列数为 1 的二维数组,行数根据数组长度自动计算。
train_test_split(x, y) 函数用于将数据分割为训练集和测试集。根据总样本数量的 70%
作为训练集,30% 作为测试集。具体步骤如下:根据 int(len(y)*0.7) 计算出分割的索引位置。
使用切片操作将特征矩阵 x 和标签向量 y 分割为训练集的特征矩阵 x_train 和标签向量 y_train,
以及测试集的特征矩阵 x_test 和标签向量 y_test。返回训练集和测试集的特征矩阵和标签向量。
3. 结果生成
import numpy as np

import matplotlib.pyplot as plt

#import data_helper

#from logistic_regression import *

# data generation

x, y = generate_data(seed=272)
x_train, y_train, x_test, y_test = train_test_split(x, y)

# visualize data
# plt.scatter(x_train[:,0], x_train[:,1], c=y_train, marker='.')
# plt.show()
# plt.scatter(x_test[:,0], x_test[:,1], c=y_test, marker='.')
# plt.show()

# data normalization
x_train = (x_train - np.min(x_train, axis=0)) / (np.max(x_train, axis=0) - np.min(x_train, axis=0))
x_test = (x_test - np.min(x_test, axis=0)) / (np.max(x_test, axis=0) - np.min(x_test, axis=0))

# Logistic regression classifier
clf = LogisticRegression(learning_rate=0.1, max_iter=500, seed=272)
clf.fit(x_train, y_train)

# plot the result
split_boundary_func = lambda x: (-clf.b - clf.w[0] * x) / clf.w[1]
xx = np.arange(0.1, 0.6, 0.1)
cValue = ['g','b']
plt.scatter(x_train[:,0], x_train[:,1], c=[cValue[i] for i in y_train], marker='o')
plt.plot(xx, split_boundary_func(xx), c='red')
plt.show()

# loss on test set
y_test_pred = clf.predict(x_test)
y_test_pred_proba = clf.predict_proba(x_test)
print(clf.score(y_test, y_test_pred))
print(clf.loss(y_test, y_test_pred_proba))
# print(y_test_pred_proba)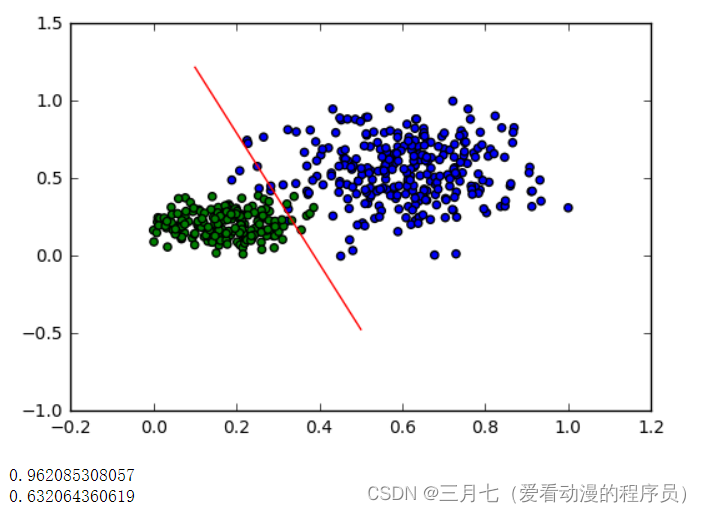
匿名函数(lambda 函数)split_boundary_func,它接受一个参数 x,并返回一个值。
具体来说,该函数使用逻辑回归模型 clf 的截距 clf.b、权重 clf.w[0] 和 clf.w[1] 计算分类边界
线的纵坐标值。
在逻辑回归模型中,分类边界线可以表示为:
w0 * x + w1 * y + b = 0
其中 w0 和 w1 是模型的权重,b 是模型的截距。在这里,我们将 y 表示为
split_boundary_func(x),即纵坐标值和横坐标值之间的关系。
plt.scatter 函数绘制散点图,具体来说,x_train[:,0] 和 x_train[:,1] 是训练集数据中的
两个特征列(或称为自变量)。x_train[:,0] 表示取所有行的第一个特征值,x_train[:,1] 表示
取所有行的第二个特征值。c=[cValue[i] for i in y_train] 用于指定每个数据点的颜色。
y_train 是训练集数据的标签(或称为因变量),用于指示数据点的分类类别。cValue 是一个颜色
列表,用于表示不同类别的颜色。通过列表推导式,根据 y_train 的值选择相应的颜色,实现不同
类别的数据点具有不同的颜色。marker='o' 指定散点的形状为圆圈。
首先,使用 generate_data 函数生成一些二维数据,并将数据集拆分为训练集和测试集。
然后,通过数据可视化展示训练集和测试集的散点图。
接下来,对训练集和测试集的特征数据进行归一化,将其缩放到 [0, 1] 范围内。
然后,创建一个逻辑回归分类器对象 clf,并使用训练集数据对其进行训练。
接着,定义一个函数 split_boundary_func 用于绘制分类边界线,并在图中绘制训练集数据和
分类边界线。
最后,使用训练好的模型对测试集进行预测,并计算模型在测试集上的准确率和损失。

