效果一
先上效果图
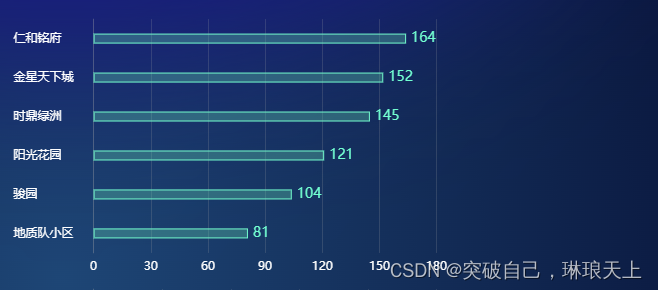
说明: 给柱状图加上 边框,改变柱状图颜色并透明,改变 X,Y轴字体颜色,改变 轴线颜色,将所有的轴线全都改成一致效果
echarts 的代码
```javascript
const renderBarEcharts = (ele: HTMLDivElement) => {
  const myChart = echarts.init(ele)

  const ydata = ['仁和铭府', '金星天下城', '时鼎绿洲', '阳光花园', '骏园', '地质队小区']
  const xdata = [164, 152, 145, 121, 104, 81]

  const option = {
    grid: {
      top: '3%',
      left: '-9%',
      right: '4%',
      bottom: '3%',
      containLabel: true,
    },
    xAxis: [{
      splitLine: {
        show: true,
        lineStyle: {
          color: 'rgba(168, 168, 168, 0.2)',
        },
      },
      axisLabel: {
        color: '#fff',
        formatter: '{value}',
      },
      type: 'value',
      show: true,
    }],
    yAxis: [
      {
        type: 'category',
        // inverse: true, // 排序
        splitLine: {
          show: false,
        },
        axisLine: { // y轴
          show: true,
          lineStyle: {
            color: 'rgba(168, 168, 168, 0.2)',
          },
        },
        axisTick: {
          show: false,
        },
        data: ['地质队小区', '骏园', '阳光花园', '时鼎绿洲', '金星天下城', '仁和铭府'],
        axisLabel: {
          interval: 0,
          margin: 80,
          textStyle: {
            color: '#fff',
            align: 'left',
            fontWeight: 'normal',
            fontSize: '12',
          },
        },
      }],
    series: [{
      type: 'bar',
      barWidth: 10, // 柱子宽度
      label: { // 柱子上方的数值
        show: true,
        position: 'right', // 位置
        color: '#39FFD1',
        fontSize: 14,
        distance: 5, // 距离
      },
      itemStyle: {
        color: 'rgba(55, 214, 175, 0.32)',
        borderWidth: 1,
        borderColor: '#3DFCCD',
      },
      data: [81, 104, 121, 145, 152, 164],
    }],
  }

  myChart.setOption(option)
  window.addEventListener('resize', () => {
    myChart.resize()
  })
}
效果二
效果图

说明: 第二是在第一个第二个基础改成渐变色
全部代码
const maintenanceNumRender = () => {
  const myChart = echarts.init(maintenanceNumRef.value)
  const option = {
    grid: {
      top: '3%',
      left: '-9%',
      right: '4%',
      bottom: '3%',
      containLabel: true,
    },
    xAxis: [{
      splitLine: {
        show: true,
        lineStyle: {
          color: 'rgba(168, 168, 168, 0.2)',
        },
      },
      axisLabel: {
        color: '#fff',
        formatter: '{value}',
      },
      type: 'value',
      show: true,
    }],
    yAxis: [
      {
        splitLine: {
          show: false,
        },
        axisLine: { // y轴
          show: true,
          lineStyle: {
            color: 'rgba(168, 168, 168, 0.2)',
          },
        },
        type: 'category',
        axisTick: {
          show: false,
        },
        data: ['仁和铭府', '时鼎绿洲', '翠麓阳光', '金星天下城', '书香学府'],
        axisLabel: {
          inside: false,
          margin: 80,
          textStyle: {
            color: '#fff',
            align: 'left',
            fontWeight: 'normal',
            fontSize: '12',
          },
        },
      }],
    series: [{
      type: 'bar',
      barWidth: 10, // 柱子宽度
      label: { // 柱子上方的数值
        show: true,
        position: 'right', // 位置
        color: '#fff',
        fontSize: 14,
        distance: 5, // 距离
      },
      itemStyle: {
        barBorderRadius: [0, 20, 20, 0], // 圆角(左上、右上、右下、左下)
        color: new echarts.graphic.LinearGradient(0, 0, 1, 0, [
          '#23B9FF', '#23FFFC',
        ].map((color, offset) => ({
          color,
          offset,
        }))), // 渐变
      },
      data: [14, 29, 40, 46, 82],
    }],
  }
  myChart.setOption(option)
}
记录一下使用的一些不常用的属性,以及图形效果