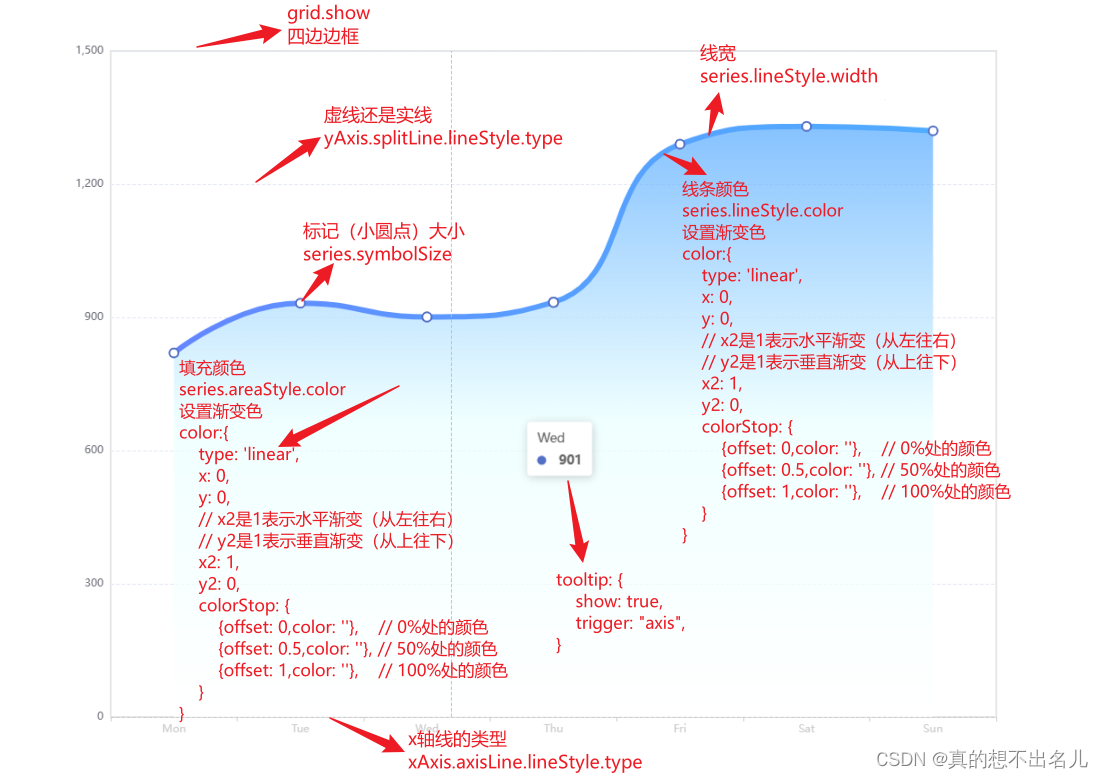
折线图
import * as echarts from 'echarts';

const chartDom = document.getElementById('main');
const myChart = echarts.init(chartDom);
const option = {
  xAxis: {
    type: 'category',
    data: ['Mon', 'Tue', 'Wed', 'Thu', 'Fri', 'Sat', 'Sun']
  },
  yAxis: {
    type: 'value'
  },
  series: [
    {
      data: [820, 932, 901, 934, 1290, 1330, 1320],
      type: 'line',
      smooth: true
    }
  ]
};

option && myChart.setOption(option);
折线图样式设置
饼图
import * as echarts from 'echarts';
const chartDom = document.getElementById('main');
const myChart = echarts.init(chartDom);
const option = {
tooltip: {
trigger: 'item'
},
legend: {
top: '5%',
left: 'center'
},
series: [
{
name: 'Access From',
type: 'pie',
radius: ['40%', '70%'],
avoidLabelOverlap: false,
itemStyle: {
borderRadius: 10,
borderColor: '#fff',
borderWidth: 2
},
emphasis: {
label: {
show: true
}
},
labelLine: {
show: true
},
data: [
{ value: 1048, name: 'Search Engine' },
{ value: 735, name: 'Direct' },
{ value: 580, name: 'Email' },
{ value: 484, name: 'Union Ads' },
{ value: 300, name: 'Video Ads' }
]
}
]
};
option && myChart.setOption(option);
饼图样式设置
柱状图
import * as echarts from 'echarts';

var chartDom = document.getElementById('main');
var myChart = echarts.init(chartDom);
var option;

option = {
  xAxis: {
    type: 'category',
    data: ['Mon', 'Tue', 'Wed', 'Thu', 'Fri', 'Sat', 'Sun']
  },
  yAxis: {
    type: 'value'
  },
  series: [
    {
      data: [120, 200, 150, 80, 70, 110, 130],
      type: 'bar'
    }
  ]
};

option && myChart.setOption(option);
柱状图样式设置


