文章目录
- 前言
- 知识积累
- 什么是Prometheus
- 什么是Grafana
- 怎样完成数据采集和监控
- 环境搭建
- docker与docker-compose安装
- docker-compose编写
- 监控配置
- grafana配置prometheus数据源
- grafana配置dashboard
- Linux Host Metrics监控
- Spring Boot 监控
- 写在最后
前言
相信大家都知道一个项目交付生产并不意味着结束,更多的是对线上服务的运维监控。运维监控主要涉及到部署服务器的资源情况,各个子服务的资源情况以及垃圾收集和吞吐量等等,还有故障告警等等功能。当然,作为一个搬砖人也是需要了解全链路的运维监控组件Prometheus。
知识积累
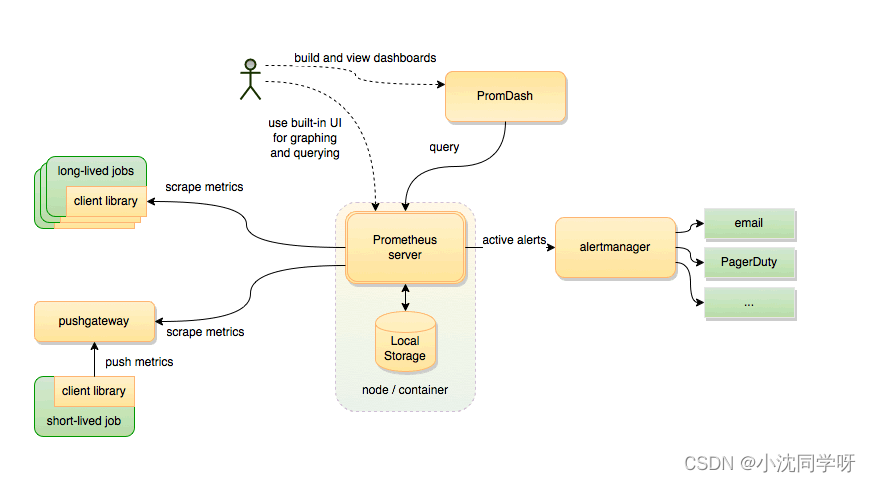
什么是Prometheus
Prometheus 是一个开源的服务监控系统和时间序列数据库。
特性:
高维度数据模型
自定义查询语言
可视化数据展示
高效的存储策略
易于运维
提供各种客户端开发库
警告和报警
数据导出
什么是Grafana
Grafana是一个跨平台的开源的度量分析和可视化工具,主要用于查询并可视化展示采集的数据。
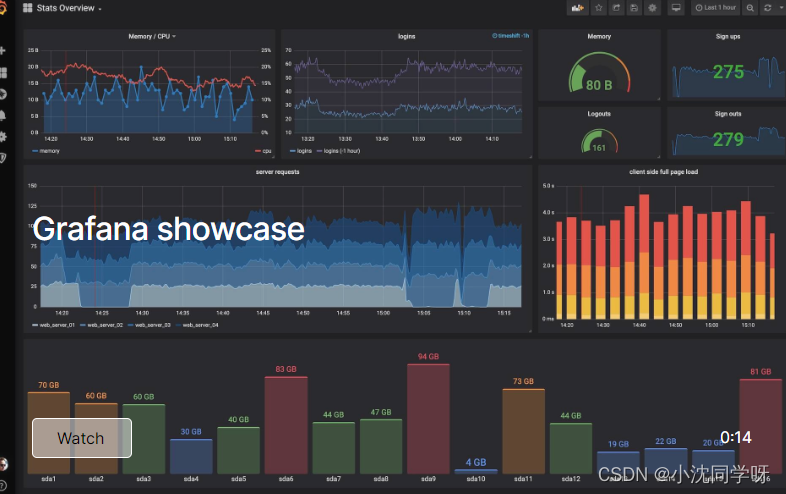
Grafana提供了丰富的可视化展示方式,包括快速灵活的客户端图表,拥有不同方式的可视化指标和日志的面板插件以及丰富的仪表盘插件,包括热图、折线图、图表等。
Grafana能够帮助用户快速的查看和编辑dashboard的前端。支持同时连接多种数据源,能够将时序时空数据库(TSDB)数据转换为漂亮的图表。
怎样完成数据采集和监控
通过node-exporter采集linux主要参数信息,Springboot微服务项目提供actuator监控配置。Prometheus server 主动拉取exporter采集的服务器数据提供主要内存、cpu参数展示,主动调用actuator接口拉取各种运行参数进行展示。
为了满足运维人员的各种可视化图表要求,我们再接入Grafana度量平台和可视化分析工具,其各种丰富的插件和仪表盘模板可以尽最大限度的提升监控运维质量。
环境搭建
对于Prometheus+Grafana环境的搭建,我们采用docker容器化进行部署管理。
考虑到我们可以随意更换告警、被监控项目等配置,我们将Grafana、Prometheus主要配置挂载在容器外部。
文件树:
[root@localhost app]# tree
.
├── docker-compose-prometheus.yaml
├── grafana
│ ├── data
│ │ └── grafana
│ └── grafana.ini
└── prometheus
├── app.json
└── prometheus.yml
docker与docker-compose安装
#安装docker社区版
yum install docker-ce
#版本查看
docker version
#docker-compose插件安装
curl -L https://github.com/docker/compose/releases/download/1.21.2/docker-compose-`uname -s`-`uname -m` -o /usr/local/bin/docker-compose
#可执行权限
chmod +x /usr/local/bin/docker-compose
#版本查看
docker-compose version
docker-compose编写
[root@localhost app]# pwd
/app
[root@localhost app]#
1、创建Prometheus配置文件
可参考 httpspro://metheus.io/docs/prometheus/latest/getting_started
[root@localhost app]# mkdir prometheus
[root@localhost app]# vim prometheus/app.json
[
    {
        "targets": [
            "10.10.18.16:8888"
        ],
        "labels": {
            "instance": "demo",
            "service": "demo-service"
        }
    }
]
[root@localhost app]# vim prometheus/prometheus.yml
global:
  scrape_interval: 10s
  scrape_timeout: 10s
  evaluation_interval: 10m

scrape_configs:
  - job_name: spring-boot # springboot项目
    scrape_interval: 5s
    scrape_timeout: 5s
    metrics_path: /actuator/prometheus
    scheme: http
    file_sd_configs:
      - files:
          - ./*.json
        refresh_interval: 1m

  - job_name: prometheus   # prometheus
    static_configs:
      - targets: ['prometheus:9090']
        labels:
          instance: prometheus


  - job_name: linux  # 采集node exporter监控数据,即linux
    static_configs:
      - targets: ['node-exporter:9100']
        labels:
          instance: localhost
2、创建Grafana配置文件
[root@localhost app]# mkdir -p ./grafana/data/grafana
[root@localhost app]# chmod -R 777 ./grafana/
grafana配置文件下载:
https://github.com/grafana/grafana/blob/main/conf/sample.ini
将下载的配置文件重命名为grafana.ini放在新建的文件夹下面。
修改数据库配置:
[root@localhost app]# vim grafana.ini
#################################### Database ############################
[database]
# You can configure the database connection by specifying type, host, name, user and password
# as separate properties or as on string using the url property.

# Either "mysql", "postgres" or "sqlite3", it's your choice
type = mysql
host = 10.10.10.202:6456
name = grafana
user = root
# If the password contains # or ; you have to wrap it with triple quotes. Ex """#password;"""
passw0ord =MyNewPass2021
# Use either URL or the previous fields to configure the database
# Example: mysql://user:secret@host:port/database
url =mysql://root:MyNewPass2021@10.10.10.202:6456/grafana


# Max idle conn setting default is 2
max_idle_conn = 2

# Max conn setting default is 0 (mean not set)
max_open_conn =100

# Connection Max Lifetime default is 14400 (means 14400 seconds or 4 hours)
conn_max_lifetime = 14400
# Set to true to log the sql calls and execution times.
log_queries =

# For "postgres", use either "disable", "require" or "verify-full"
# For "mysql", use either "true", "false", or "skip-verify".
ssl_mode = disable

# Database drivers may support different transaction isolation levels.
# Currently, only "mysql" driver supports isolation levels.
# If the value is empty - driver's default isolation level is applied.
# For "mysql" use "READ-UNCOMMITTED", "READ-COMMITTED", "REPEATABLE-READ" or "SERIALIZABLE".
isolation_level =

ca_cert_path =
client_key_path =
client_cert_path =
server_cert_name =

# For "sqlite3" only, path relative to data_path setting
path = grafana.db

# For "sqlite3" only. cache mode setting used for connecting to the database
cache_mode = private

# For "sqlite3" only. Enable/disable Write-Ahead Logging, https://sqlite.org/wal.html. Default is false.
wal = false

# For "mysql" only if migrationLocking feature toggle is set. How many seconds to wait before failing to lock the database for the migrations, default is 0.
locking_attempt_timeout_sec = 0

# For "sqlite" only. How many times to retry query in case of database is locked failures. Default is 0 (disabled).
query_retries = 0

# For "sqlite" only. How many times to retry transaction in case of database is locked failures. Default is 5.
transaction_retries = 5

# Set to true to add metrics and tracing for database queries.
instrument_queries = false
#################################### SMTP / Emailing #####################
[smtp]
enabled = false
host = localhost:25
user =
# If the password contains # or ; you have to wrap it with triple quotes. Ex """#password;"""
password =
cert_file =
key_file =
skip_verify = false
from_address = admin@grafana.localhost
from_name = Grafana
ehlo_identity =
startTLS_policy =

[emails]
welcome_email_on_sign_up = false
templates_pattern = emails/*.html
content_types = text/html
3、docker-compose
[root@localhost app]# vim docker-compose-prometheus.yaml
version: "3"
networks: # 网桥
  prometheus:
    ipam:
      driver: default
      config:
        - subnet: "172.22.0.0/24"

services:
  prometheus: # prometheus
    image: registry.cn-hangzhou.aliyuncs.com/senfel/prometheus:v2.34.0
    container_name: prometheus
    restart: unless-stopped
    volumes:
      - ./prometheus/app.json:/etc/prometheus/app.json
      - ./prometheus/prometheus.yml:/etc/prometheus/prometheus.yml
    command: "--config.file=/etc/prometheus/prometheus.yml --storage.tsdb.path=/prometheus"
    ports:
      - "9090:9090"
    depends_on:
      - node-exporter
    networks:
      prometheus:
        ipv4_address: 172.22.0.11

  node-exporter:  # 采集服务器层面的运行指标
    image: registry.cn-hangzhou.aliyuncs.com/senfel/node-exporter:v1.3.1
    container_name: prometheus-node-exporter
    restart: unless-stopped
    volumes:
      - /proc:/host/proc"
      - /sys:/host/sys"
    ports:
      - "9100:9100"
    networks:
      prometheus:
        ipv4_address: 172.22.0.22

  grafana:  # 用于UI展示
    image: registry.cn-hangzhou.aliyuncs.com/senfel/grafana:8.0.0
    container_name: prometheus-grafana
    restart: unless-stopped
    ports:
      - "3000:3000"
    volumes:
      - ./grafana/data/grafana:/var/lib/grafana
      - /etc/localtime:/etc/localtime
      - ./grafana/plugins:/var/lib/grafana/plugins
      - ./grafana/grafana.ini:/etc/grafana/grafana.ini
    environment:
      GF_EXPLORE_ENABLED: "true"
      GF_SECURITY_ADMIN_PASSWORD: "admin"
      GF_INSTALL_PLUGINS: "grafana-clock-panel,grafana-simple-json-datasource,alexanderzobnin-zabbix-app"
    depends_on:
      - prometheus
    networks:
      prometheus:
        ipv4_address: 172.22.0.33
4、部署Prometheus+Grafana+Exporter容器
[root@localhost app]# docker-compose -f docker-compose-prometheus.yaml up -d
prometheus-node-exporter is up-to-date
Recreating prometheus … done
Recreating prometheus-grafana … done
[root@localhost app]# docker ps
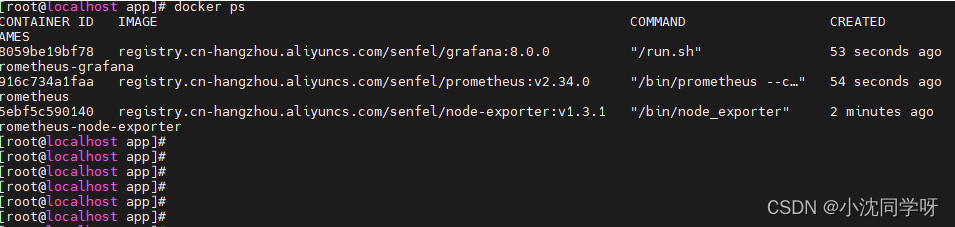
浏览器访问 http://10.10.22.91:3000/login
监控配置
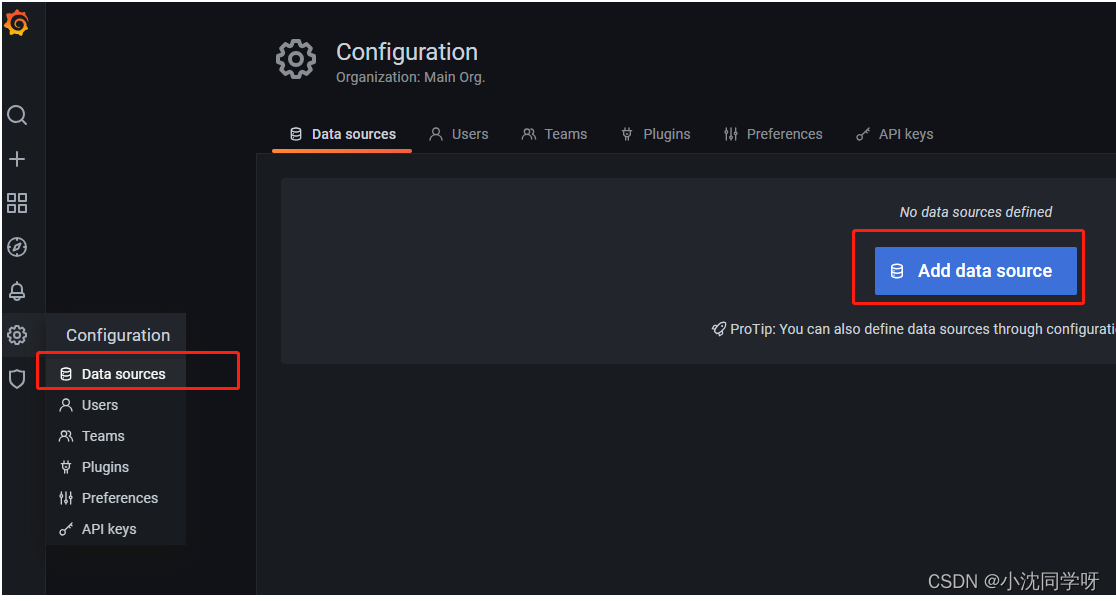
grafana配置prometheus数据源
1、点击 设置-data source 增加一个数据源
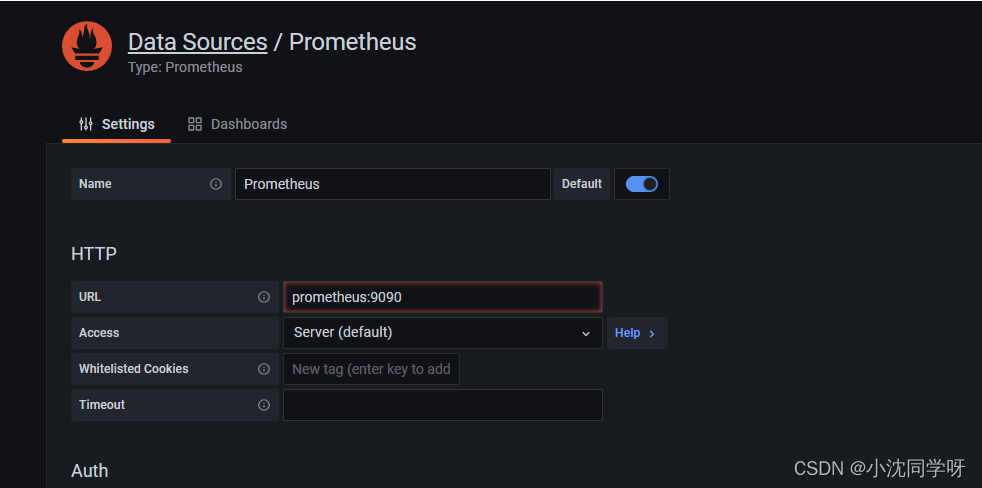
2、选择 prometheus 并配置路径
grafana配置dashboard
Spring Boot 2.1 Statistics:https://grafana.com/grafana/dashboards/10280
JVM (Micrometer):https://grafana.com/grafana/dashboards/4701
Linux Hosts Metrics: https://grafana.com/grafana/dashboards/10180-kds-linux-hosts/
Linux Host Metrics监控
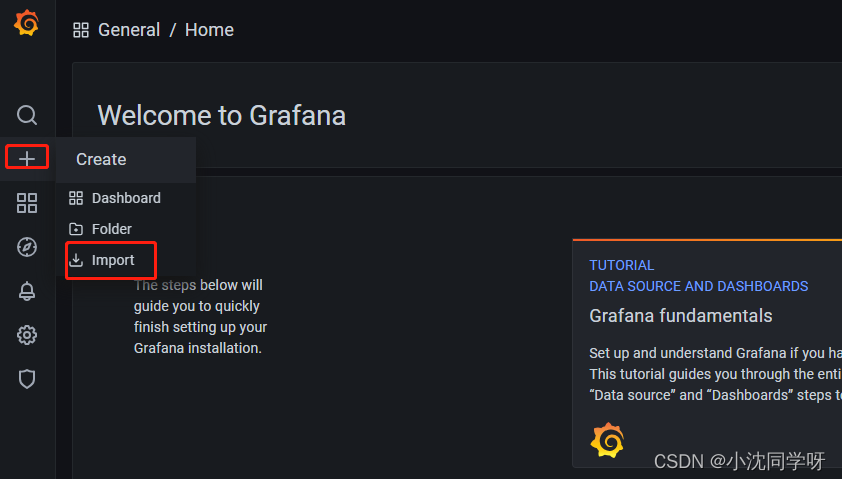
1、点击侧边栏 增加 import
2、输入模板ID 10180
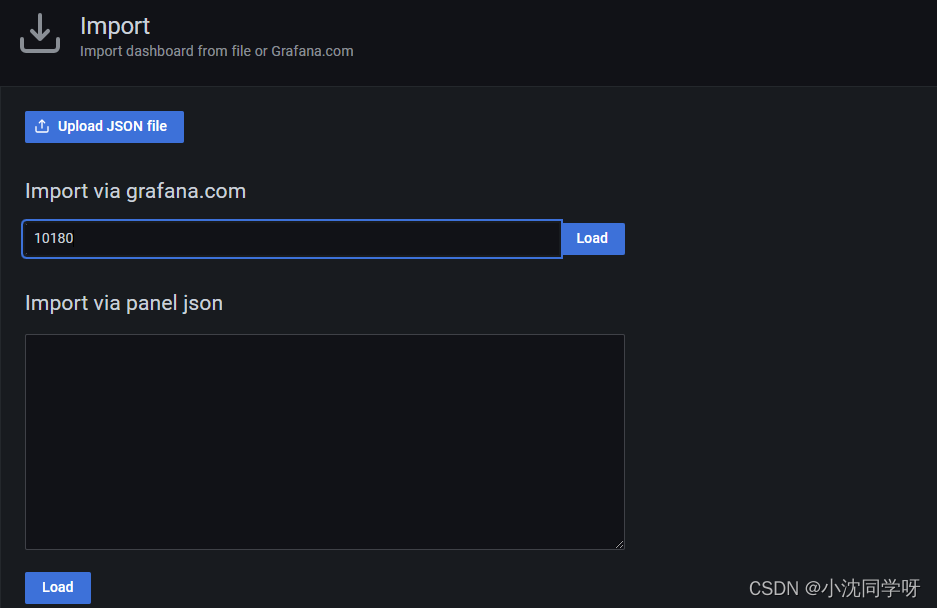
3、点击load加载
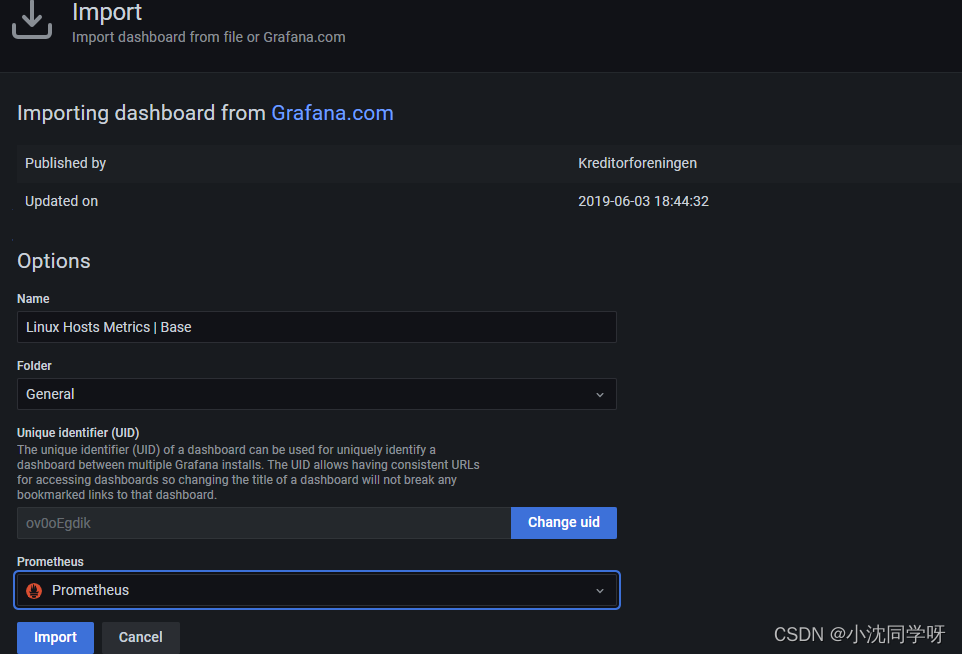
4、点击import导入
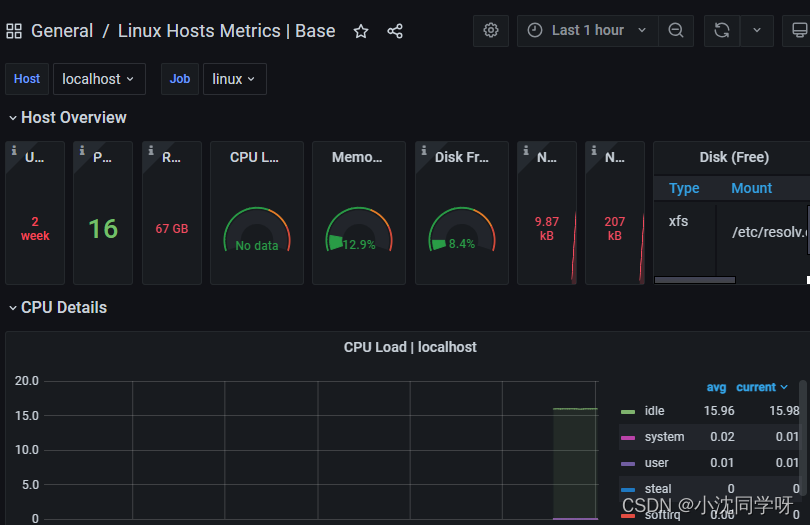
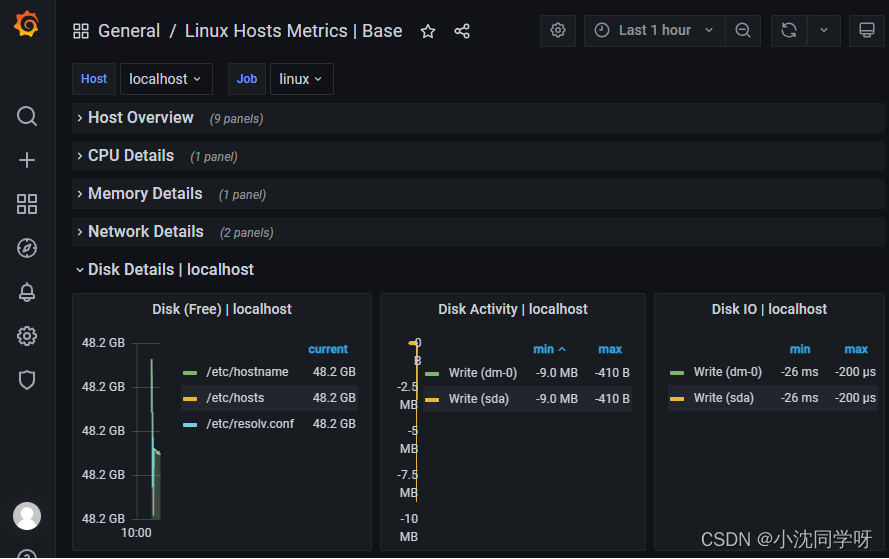
如图所示基本涵盖服务器主要参数监控信息。
Spring Boot 监控
由于prometheus主动拉群我们项目指标,故需要暴露监控端口,且需要对项目进行改造。
Spring Boot增加监控配置
1、引入pom依赖
org.springframework.boot
spring-boot-starter-actuator
io.micrometer
micrometer-registry-prometheus
2、增加application配置
management:
  endpoints:
    web:
      exposure:
        include: health,prometheus
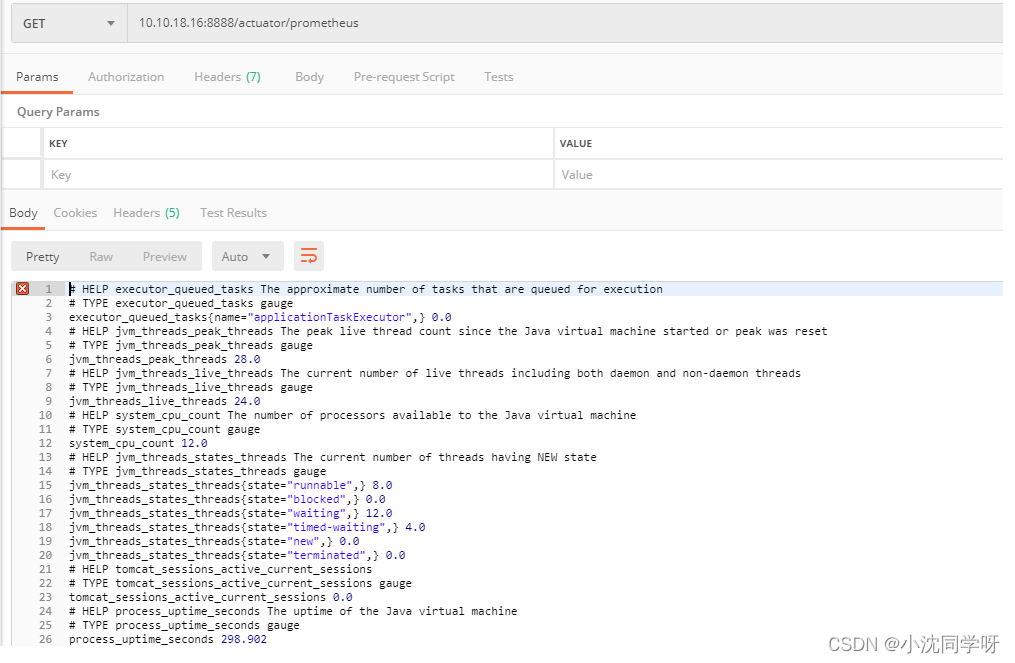
3、测试监控信息
启动项目
postman请求 10.10.18.16:8888/actuator/prometheus
导入Spring Boot 2.1 Statistics
1、点击侧边栏导入按钮-输入模板ID 10280
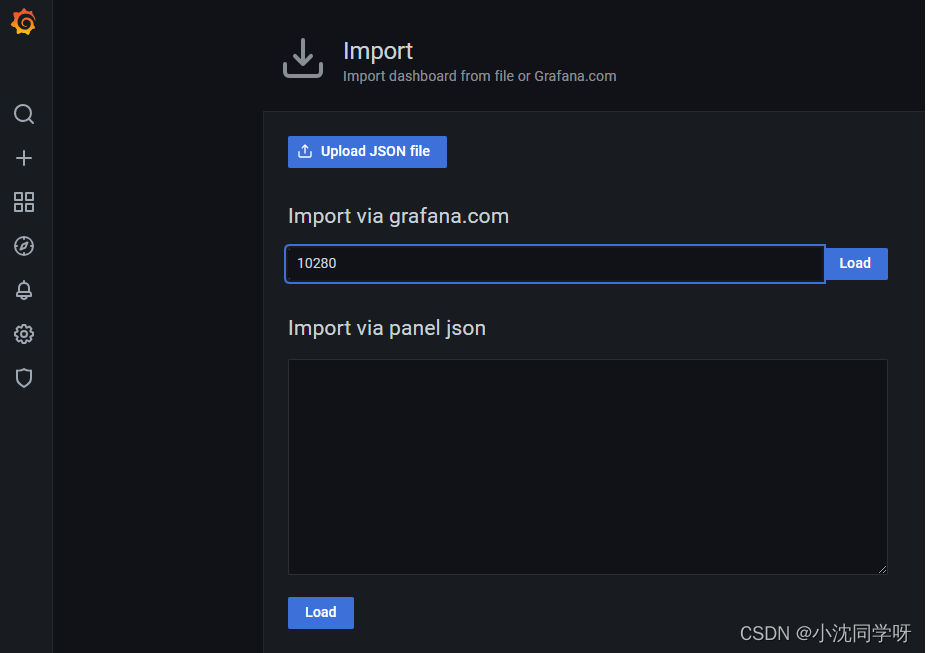
2、点击load加载仪表盘模板
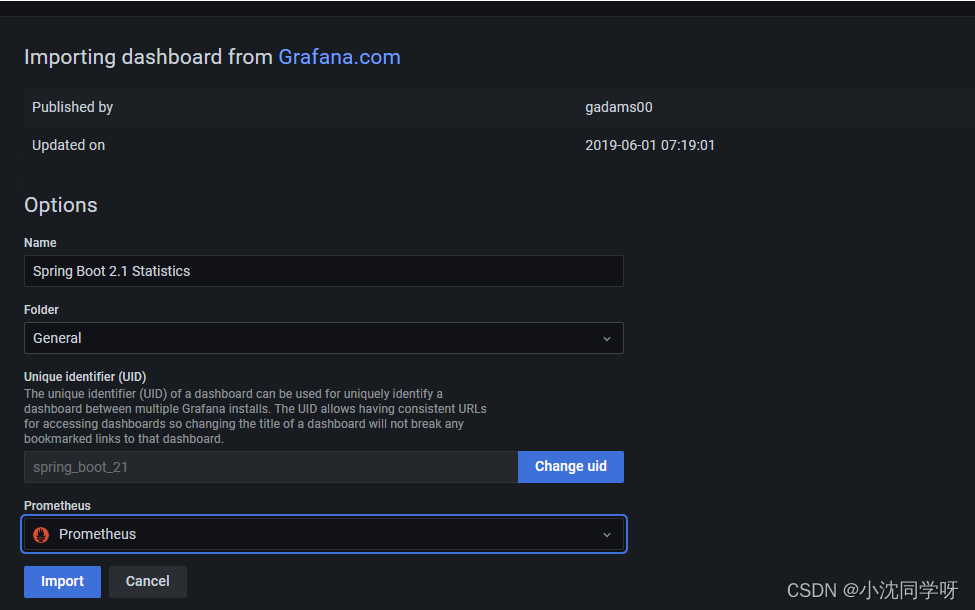
3、点击import导入即可
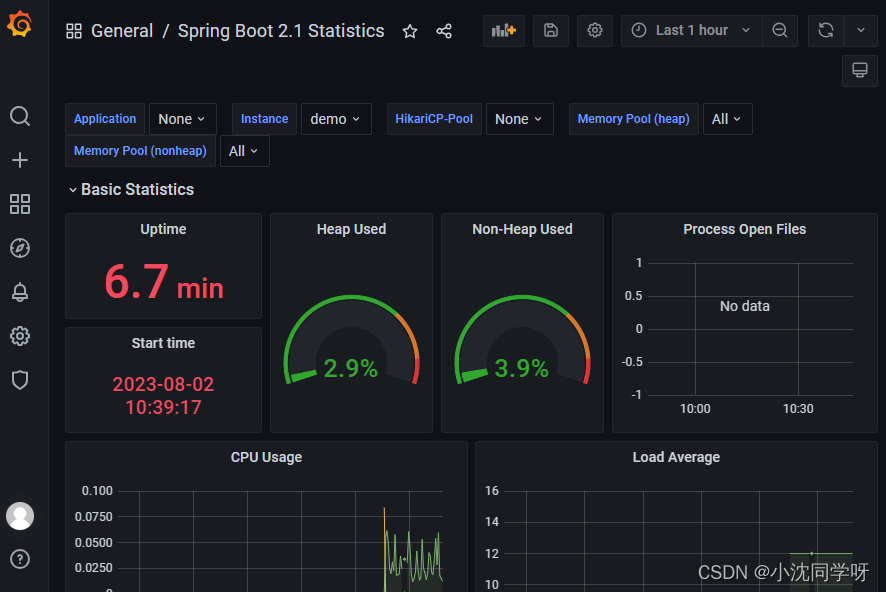
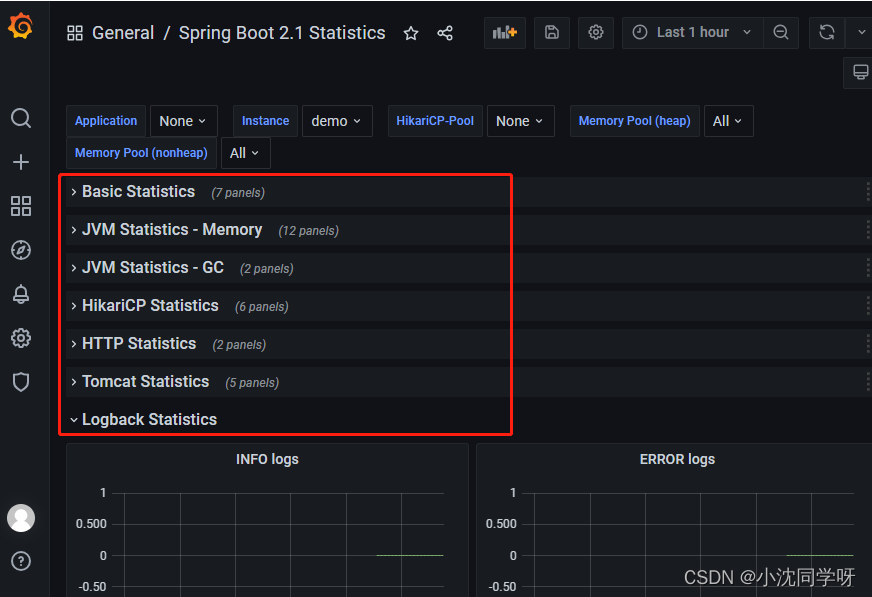
如图所示:基本涵盖所有的项目监控信息。
写在最后
本篇实战博文主要讲解了用docker-compose编排Prometheus、node-exporter、Grafana实现监控环境搭建,并叙述了Linux系统服务器指标监控,Springboot项目暴露指标接口进行全链路指标数据监控。当然,采用Grafana提供的Linux、Springboot监控仪表盘模板完全可以直接投入生产。