Bar - Bar_rotate_xaxis_label
解决标签名字过长的问题
from pyecharts import options as opts
from pyecharts.charts import Bar

c = (
    Bar()
    .add_xaxis(
        [
            "高等数学1,2",
            "C语言程序设计",
            "python程序设计",
            "大数据导论",
            "数据结构",
            "大数据与人工智能",
        ]
    )
    .add_yaxis("大一的学习效率", [10, 20, 30, 40, 50, 40])
    .add_yaxis("大二的学习效率", [20, 10, 40, 30, 40, 50])
    .set_global_opts(
        xaxis_opts=opts.AxisOpts(axislabel_opts=opts.LabelOpts(rotate=-15)),   #此行代码旋转标签的角度
        title_opts=opts.TitleOpts(title="信阳农林学院信息工程学院", subtitle="数据科学与大数据技术21-2"),
    )
    .render("bar_rotate_xaxis_label.html")
)
<!DOCTYPE html>
<html>
<head>
    <meta charset="UTF-8">
    <title>Awesome-pyecharts</title>
                <script type="text/javascript" src="https://assets.pyecharts.org/assets/v5/echarts.min.js"></script>

</head>
<body >
    <div id="8601599b79914f0cb28546e9b9a362e3" class="chart-container" style="width:900px; height:500px; "></div>
    <script>
        var chart_8601599b79914f0cb28546e9b9a362e3 = echarts.init(
            document.getElementById('8601599b79914f0cb28546e9b9a362e3'), 'white', {renderer: 'canvas'});
        var option_8601599b79914f0cb28546e9b9a362e3 = {
    "animation": true,
    "animationThreshold": 2000,
    "animationDuration": 1000,
    "animationEasing": "cubicOut",
    "animationDelay": 0,
    "animationDurationUpdate": 300,
    "animationEasingUpdate": "cubicOut",
    "animationDelayUpdate": 0,
    "aria": {
        "enabled": false
    },
    "color": [
        "#5470c6",
        "#91cc75",
        "#fac858",
        "#ee6666",
        "#73c0de",
        "#3ba272",
        "#fc8452",
        "#9a60b4",
        "#ea7ccc"
    ],
    "series": [
        {
            "type": "bar",
            "name": "\u5927\u4e00\u7684\u5b66\u4e60\u6548\u7387",
            "legendHoverLink": true,
            "data": [
                10,
                20,
                30,
                40,
                50,
                40
            ],
            "realtimeSort": false,
            "showBackground": false,
            "stackStrategy": "samesign",
            "cursor": "pointer",
            "barMinHeight": 0,
            "barCategoryGap": "20%",
            "barGap": "30%",
            "large": false,
            "largeThreshold": 400,
            "seriesLayoutBy": "column",
            "datasetIndex": 0,
            "clip": true,
            "zlevel": 0,
            "z": 2,
            "label": {
                "show": true,
                "margin": 8
            }
        },
        {
            "type": "bar",
            "name": "\u5927\u4e8c\u7684\u5b66\u4e60\u6548\u7387",
            "legendHoverLink": true,
            "data": [
                20,
                10,
                40,
                30,
                40,
                50
            ],
            "realtimeSort": false,
            "showBackground": false,
            "stackStrategy": "samesign",
            "cursor": "pointer",
            "barMinHeight": 0,
            "barCategoryGap": "20%",
            "barGap": "30%",
            "large": false,
            "largeThreshold": 400,
            "seriesLayoutBy": "column",
            "datasetIndex": 0,
            "clip": true,
            "zlevel": 0,
            "z": 2,
            "label": {
                "show": true,
                "margin": 8
            }
        }
    ],
    "legend": [
        {
            "data": [
                "\u5927\u4e00\u7684\u5b66\u4e60\u6548\u7387",
                "\u5927\u4e8c\u7684\u5b66\u4e60\u6548\u7387"
            ],
            "selected": {},
            "show": true,
            "padding": 5,
            "itemGap": 10,
            "itemWidth": 25,
            "itemHeight": 14,
            "backgroundColor": "transparent",
            "borderColor": "#ccc",
            "borderWidth": 1,
            "borderRadius": 0,
            "pageButtonItemGap": 5,
            "pageButtonPosition": "end",
            "pageFormatter": "{current}/{total}",
            "pageIconColor": "#2f4554",
            "pageIconInactiveColor": "#aaa",
            "pageIconSize": 15,
            "animationDurationUpdate": 800,
            "selector": false,
            "selectorPosition": "auto",
            "selectorItemGap": 7,
            "selectorButtonGap": 10
        }
    ],
    "tooltip": {
        "show": true,
        "trigger": "item",
        "triggerOn": "mousemove|click",
        "axisPointer": {
            "type": "line"
        },
        "showContent": true,
        "alwaysShowContent": false,
        "showDelay": 0,
        "hideDelay": 100,
        "enterable": false,
        "confine": false,
        "appendToBody": false,
        "transitionDuration": 0.4,
        "textStyle": {
            "fontSize": 14
        },
        "borderWidth": 0,
        "padding": 5,
        "order": "seriesAsc"
    },
    "xAxis": [
        {
            "show": true,
            "scale": false,
            "nameLocation": "end",
            "nameGap": 15,
            "gridIndex": 0,
            "axisLabel": {
                "show": true,
                "rotate": -15,
                "margin": 8
            },
            "inverse": false,
            "offset": 0,
            "splitNumber": 5,
            "minInterval": 0,
            "splitLine": {
                "show": true,
                "lineStyle": {
                    "show": true,
                    "width": 1,
                    "opacity": 1,
                    "curveness": 0,
                    "type": "solid"
                }
            },
            "data": [
                "\u9ad8\u7b49\u6570\u5b661\uff0c2",
                "C\u8bed\u8a00\u7a0b\u5e8f\u8bbe\u8ba1",
                "python\u7a0b\u5e8f\u8bbe\u8ba1",
                "\u5927\u6570\u636e\u5bfc\u8bba",
                "\u6570\u636e\u7ed3\u6784",
                "\u5927\u6570\u636e\u4e0e\u4eba\u5de5\u667a\u80fd"
            ]
        }
    ],
    "yAxis": [
        {
            "show": true,
            "scale": false,
            "nameLocation": "end",
            "nameGap": 15,
            "gridIndex": 0,
            "inverse": false,
            "offset": 0,
            "splitNumber": 5,
            "minInterval": 0,
            "splitLine": {
                "show": true,
                "lineStyle": {
                    "show": true,
                    "width": 1,
                    "opacity": 1,
                    "curveness": 0,
                    "type": "solid"
                }
            }
        }
    ],
    "title": [
        {
            "show": true,
            "text": "\u4fe1\u9633\u519c\u6797\u5b66\u9662\u4fe1\u606f\u5de5\u7a0b\u5b66\u9662",
            "target": "blank",
            "subtext": "\u6570\u636e\u79d1\u5b66\u4e0e\u5927\u6570\u636e\u6280\u672f21-2",
            "subtarget": "blank",
            "padding": 5,
            "itemGap": 10,
            "textAlign": "auto",
            "textVerticalAlign": "auto",
            "triggerEvent": false
        }
    ]
};
        chart_8601599b79914f0cb28546e9b9a362e3.setOption(option_8601599b79914f0cb28546e9b9a362e3);
    </script>
</body>
</html>

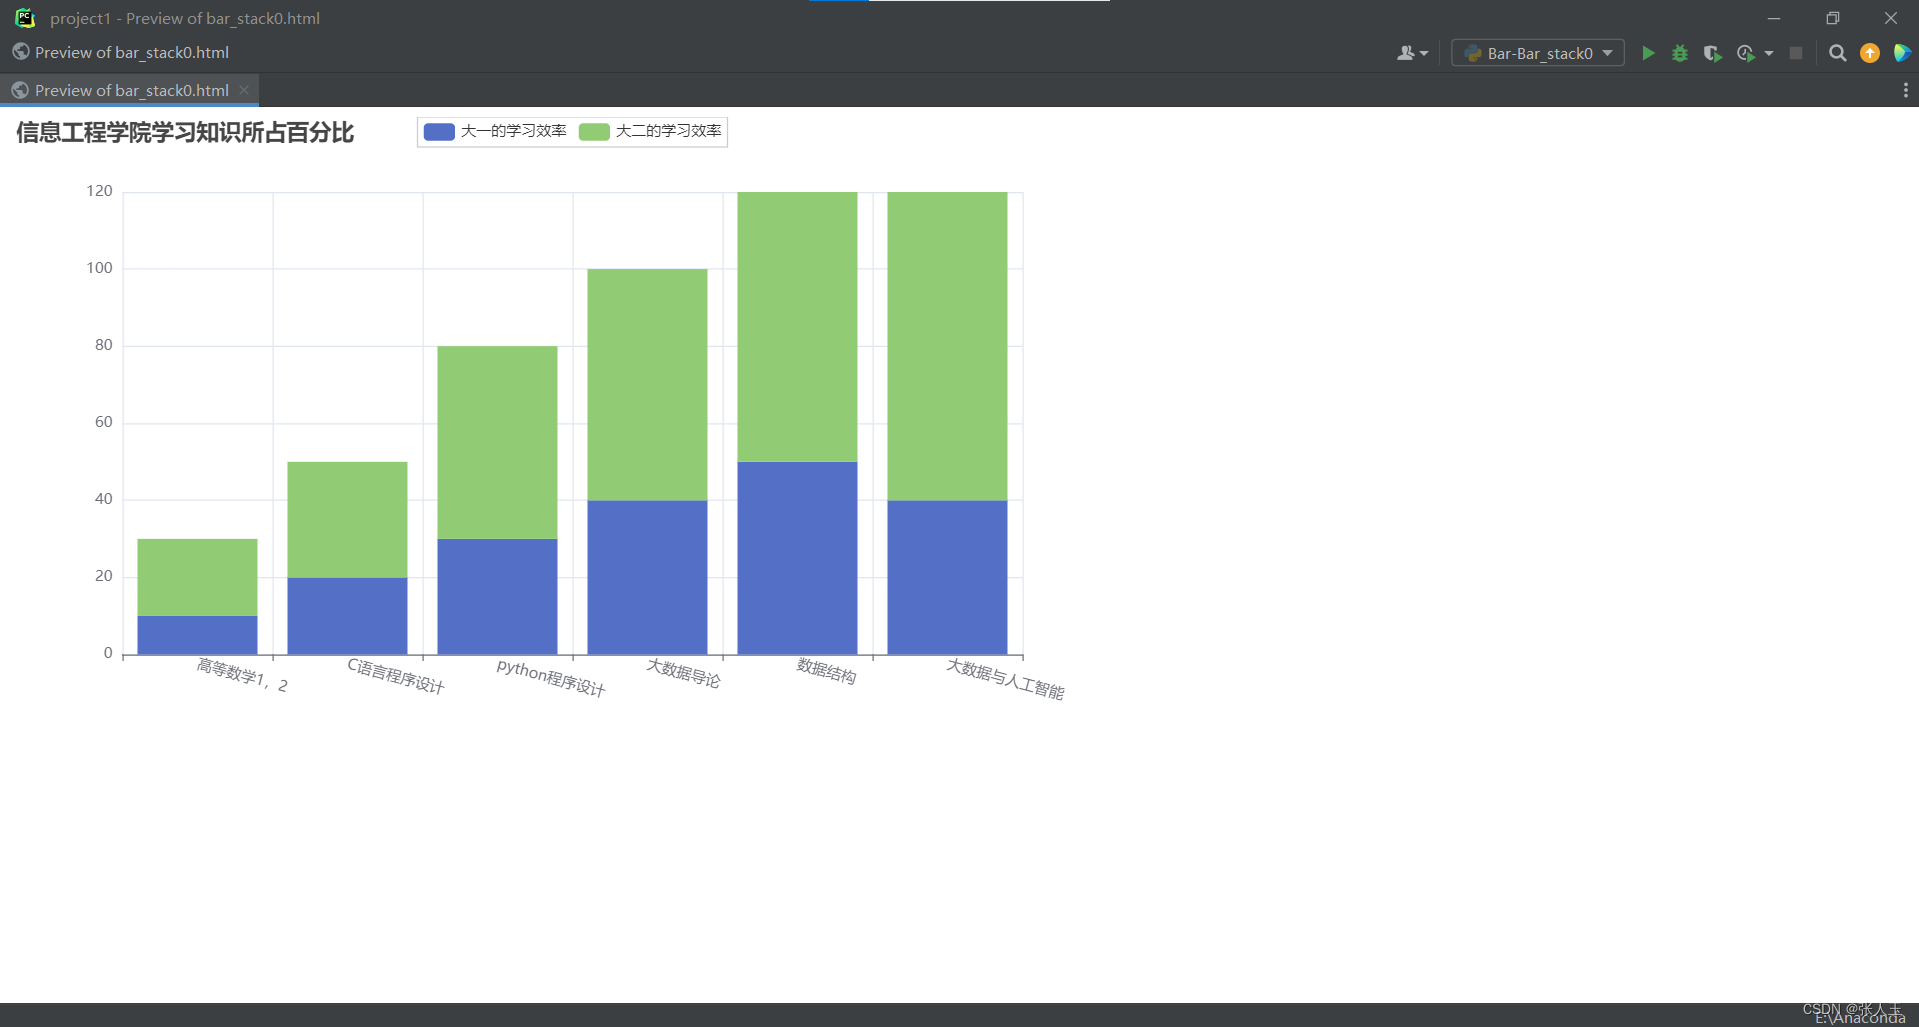
Bar - Bar_stack0
叠层柱状图
可以求比例
from pyecharts import options as opts
from pyecharts.charts import Bar
from pyecharts.faker import Faker

c = (
    Bar()
    .add_xaxis(
        [
            "高等数学1,2",
            "C语言程序设计",
            "python程序设计",
            "大数据导论",
            "数据结构",
            "大数据与人工智能",
        ]
    )
    .add_yaxis("大一的学习效率", [10, 20, 30, 40, 50, 40],stack="stack1")  # stack="stack1" 表示同一列
    .add_yaxis("大二的学习效率", [20, 30, 50, 60, 70, 80],stack="stack1")  #
    .set_series_opts(label_opts=opts.LabelOpts(is_show=False))
    .set_global_opts(
        xaxis_opts=opts.AxisOpts(axislabel_opts=opts.LabelOpts(rotate=-15)),
        title_opts=opts.TitleOpts(title="信息工程学院学习知识所占百分比")
    )
    .render("bar_stack0.html")
)
<!DOCTYPE html>
<html>
<head>
    <meta charset="UTF-8">
    <title>Awesome-pyecharts</title>
                <script type="text/javascript" src="https://assets.pyecharts.org/assets/v5/echarts.min.js"></script>

</head>
<body >
    <div id="ef493756d92b45dcb840f2c58c5f385f" class="chart-container" style="width:900px; height:500px; "></div>
    <script>
        var chart_ef493756d92b45dcb840f2c58c5f385f = echarts.init(
            document.getElementById('ef493756d92b45dcb840f2c58c5f385f'), 'white', {renderer: 'canvas'});
        var option_ef493756d92b45dcb840f2c58c5f385f = {
    "animation": true,
    "animationThreshold": 2000,
    "animationDuration": 1000,
    "animationEasing": "cubicOut",
    "animationDelay": 0,
    "animationDurationUpdate": 300,
    "animationEasingUpdate": "cubicOut",
    "animationDelayUpdate": 0,
    "aria": {
        "enabled": false
    },
    "color": [
        "#5470c6",
        "#91cc75",
        "#fac858",
        "#ee6666",
        "#73c0de",
        "#3ba272",
        "#fc8452",
        "#9a60b4",
        "#ea7ccc"
    ],
    "series": [
        {
            "type": "bar",
            "name": "\u5927\u4e00\u7684\u5b66\u4e60\u6548\u7387",
            "legendHoverLink": true,
            "data": [
                10,
                20,
                30,
                40,
                50,
                40
            ],
            "realtimeSort": false,
            "showBackground": false,
            "stack": "stack1",
            "stackStrategy": "samesign",
            "cursor": "pointer",
            "barMinHeight": 0,
            "barCategoryGap": "20%",
            "barGap": "30%",
            "large": false,
            "largeThreshold": 400,
            "seriesLayoutBy": "column",
            "datasetIndex": 0,
            "clip": true,
            "zlevel": 0,
            "z": 2,
            "label": {
                "show": false,
                "margin": 8
            },
            "rippleEffect": {
                "show": true,
                "brushType": "stroke",
                "scale": 2.5,
                "period": 4
            }
        },
        {
            "type": "bar",
            "name": "\u5927\u4e8c\u7684\u5b66\u4e60\u6548\u7387",
            "legendHoverLink": true,
            "data": [
                20,
                30,
                50,
                60,
                70,
                80
            ],
            "realtimeSort": false,
            "showBackground": false,
            "stack": "stack1",
            "stackStrategy": "samesign",
            "cursor": "pointer",
            "barMinHeight": 0,
            "barCategoryGap": "20%",
            "barGap": "30%",
            "large": false,
            "largeThreshold": 400,
            "seriesLayoutBy": "column",
            "datasetIndex": 0,
            "clip": true,
            "zlevel": 0,
            "z": 2,
            "label": {
                "show": false,
                "margin": 8
            },
            "rippleEffect": {
                "show": true,
                "brushType": "stroke",
                "scale": 2.5,
                "period": 4
            }
        }
    ],
    "legend": [
        {
            "data": [
                "\u5927\u4e00\u7684\u5b66\u4e60\u6548\u7387",
                "\u5927\u4e8c\u7684\u5b66\u4e60\u6548\u7387"
            ],
            "selected": {},
            "show": true,
            "padding": 5,
            "itemGap": 10,
            "itemWidth": 25,
            "itemHeight": 14,
            "backgroundColor": "transparent",
            "borderColor": "#ccc",
            "borderWidth": 1,
            "borderRadius": 0,
            "pageButtonItemGap": 5,
            "pageButtonPosition": "end",
            "pageFormatter": "{current}/{total}",
            "pageIconColor": "#2f4554",
            "pageIconInactiveColor": "#aaa",
            "pageIconSize": 15,
            "animationDurationUpdate": 800,
            "selector": false,
            "selectorPosition": "auto",
            "selectorItemGap": 7,
            "selectorButtonGap": 10
        }
    ],
    "tooltip": {
        "show": true,
        "trigger": "item",
        "triggerOn": "mousemove|click",
        "axisPointer": {
            "type": "line"
        },
        "showContent": true,
        "alwaysShowContent": false,
        "showDelay": 0,
        "hideDelay": 100,
        "enterable": false,
        "confine": false,
        "appendToBody": false,
        "transitionDuration": 0.4,
        "textStyle": {
            "fontSize": 14
        },
        "borderWidth": 0,
        "padding": 5,
        "order": "seriesAsc"
    },
    "xAxis": [
        {
            "show": true,
            "scale": false,
            "nameLocation": "end",
            "nameGap": 15,
            "gridIndex": 0,
            "axisLabel": {
                "show": true,
                "rotate": -15,
                "margin": 8
            },
            "inverse": false,
            "offset": 0,
            "splitNumber": 5,
            "minInterval": 0,
            "splitLine": {
                "show": true,
                "lineStyle": {
                    "show": true,
                    "width": 1,
                    "opacity": 1,
                    "curveness": 0,
                    "type": "solid"
                }
            },
            "data": [
                "\u9ad8\u7b49\u6570\u5b661\uff0c2",
                "C\u8bed\u8a00\u7a0b\u5e8f\u8bbe\u8ba1",
                "python\u7a0b\u5e8f\u8bbe\u8ba1",
                "\u5927\u6570\u636e\u5bfc\u8bba",
                "\u6570\u636e\u7ed3\u6784",
                "\u5927\u6570\u636e\u4e0e\u4eba\u5de5\u667a\u80fd"
            ]
        }
    ],
    "yAxis": [
        {
            "show": true,
            "scale": false,
            "nameLocation": "end",
            "nameGap": 15,
            "gridIndex": 0,
            "inverse": false,
            "offset": 0,
            "splitNumber": 5,
            "minInterval": 0,
            "splitLine": {
                "show": true,
                "lineStyle": {
                    "show": true,
                    "width": 1,
                    "opacity": 1,
                    "curveness": 0,
                    "type": "solid"
                }
            }
        }
    ],
    "title": [
        {
            "show": true,
            "text": "\u4fe1\u606f\u5de5\u7a0b\u5b66\u9662\u5b66\u4e60\u77e5\u8bc6\u6240\u5360\u767e\u5206\u6bd4",
            "target": "blank",
            "subtarget": "blank",
            "padding": 5,
            "itemGap": 10,
            "textAlign": "auto",
            "textVerticalAlign": "auto",
            "triggerEvent": false
        }
    ]
};
        chart_ef493756d92b45dcb840f2c58c5f385f.setOption(option_ef493756d92b45dcb840f2c58c5f385f);
    </script>
</body>
</html>