Stimulsoft Dashboards.JS--Ω578867473
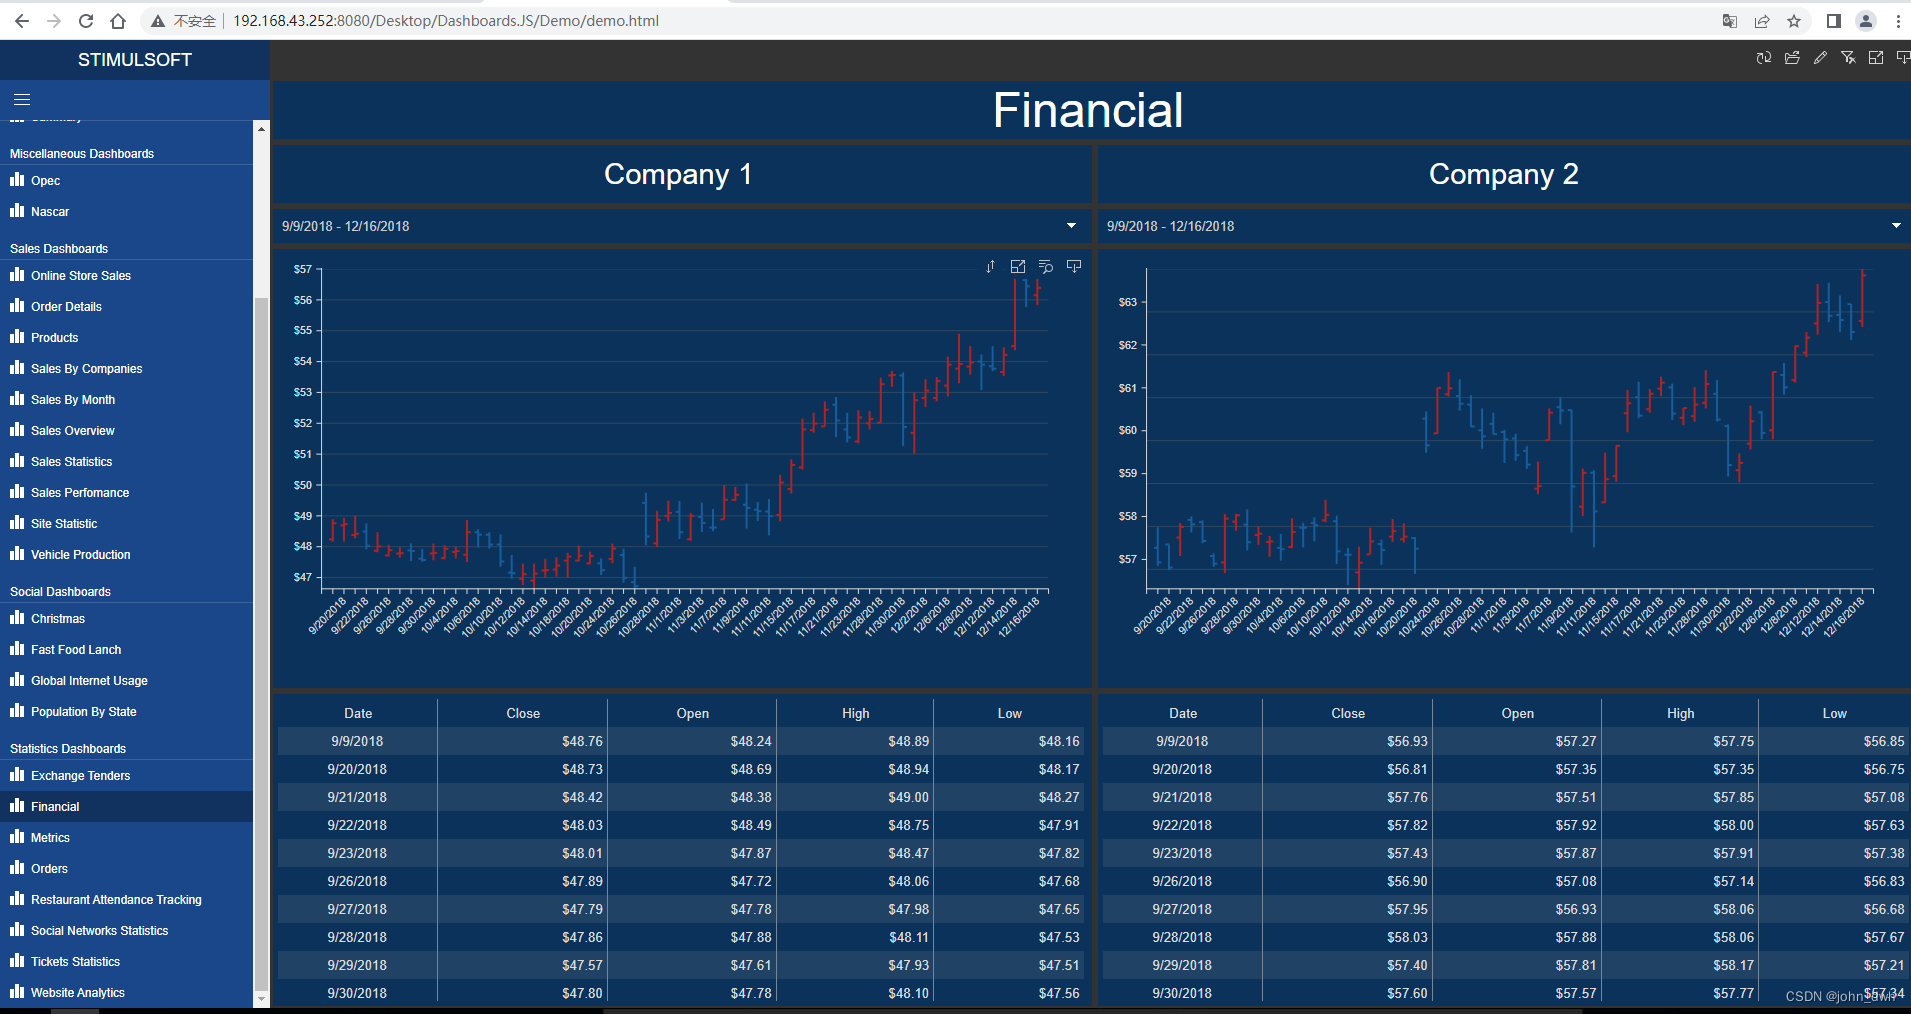
Dashboards.JS 是一个功能齐全的工具,用于为 JavaScript 平台创建仪表板。

JavaScript 仪表板
Dashboards.JS 是一个功能齐全的工具,用于为 JavaScript 平台创建仪表板。要生成和查看仪表板,您需要任何支持 HTML5 和 JavaScript 的 Web 浏览器。它可以在不需要服务器端时用作客户端,也可以在服务器端使用时用作服务器端。

报表设计器
我们提供了一个通用的设计器来创建仪表板和报告。对于那些已经熟悉我们的报告工具的人来说,这将大大简化工作。标准的用户界面和统一的工作方式,包括报告和仪表板,将允许您开始创建分析文档并在短时间内使用所有必要的功能。
仪表板项目
仪表板上的数据可以使用仪表板项进行处理、过滤、显示和可视化风格化。数据的处理和显示是使用以下元素进行的——表格、图表、仪表、数据透视表、指标、进度和地图。您可以使用日期选择器按时间范围过滤数据,使用简单、下拉、分层和下拉分层列表按值列表过滤数据。使用诸如文本、图像、形状之类的项目,您可以为您的仪表板提供个性化的外观。
报告查看器
报表查看器是使用 HTML5 和 JavaScript 设计的。它适用于任何支持这些技术的网络浏览器;它可以在没有服务器端的情况下自主运行。它具有报表查看器的所有优点——仪表板元素的交互性、以全屏模式显示面板、将仪表板导出为 PDF、Excel 和 PNG 文件。
Report Designer
We offer a common designer for creating dashboards and reports. For those who are already familiar with our reporting tool, this will significantly simplify the work. The standard user interface and unified approaches to work, both with reports and dashboards, will allow you to start creating analytical documents and use all the necessary functionality in a short time.

Dashboard Items
The data on the dashboard can be processed, filtered, displayed and visually stylized using the dashboard items. The processing and displaying of data is carried out using the following elements – Table, Chart, Gauge, Pivot, Indicator, Progress, and Map. You can filter data by time range, using the Date Picker, by lists of values using the simple, drop-down, hierarchical, and drop-down hierarchical lists. Using such items as Text, Image, Shape, you can give a personal look for your dashboards.



![[附源码]JAVA毕业设计-心理健康管理-(系统+LW)](https://img-blog.csdnimg.cn/7444b85f87c84c4f90a1716b06b6193b.png)

