需要源码或运行有问题请点赞关注收藏后评论区留言私信~~~
一、imgaug简介
imguag使一个用于机器学习实验中图像增强的Python依赖库,支持Python2.7和Python3.4以上的版本,它支持多种图像增强技术,并允许轻松地组合这些技术,具有简单但功能强大的随机界面,支持关键点(Keypoint)和标准框(Bounding Box)一起变换,并在后台进程中提供增强功能以提高性能
在Pycharm集成开发环境中直接install即可
二、数据增强库的基本使用
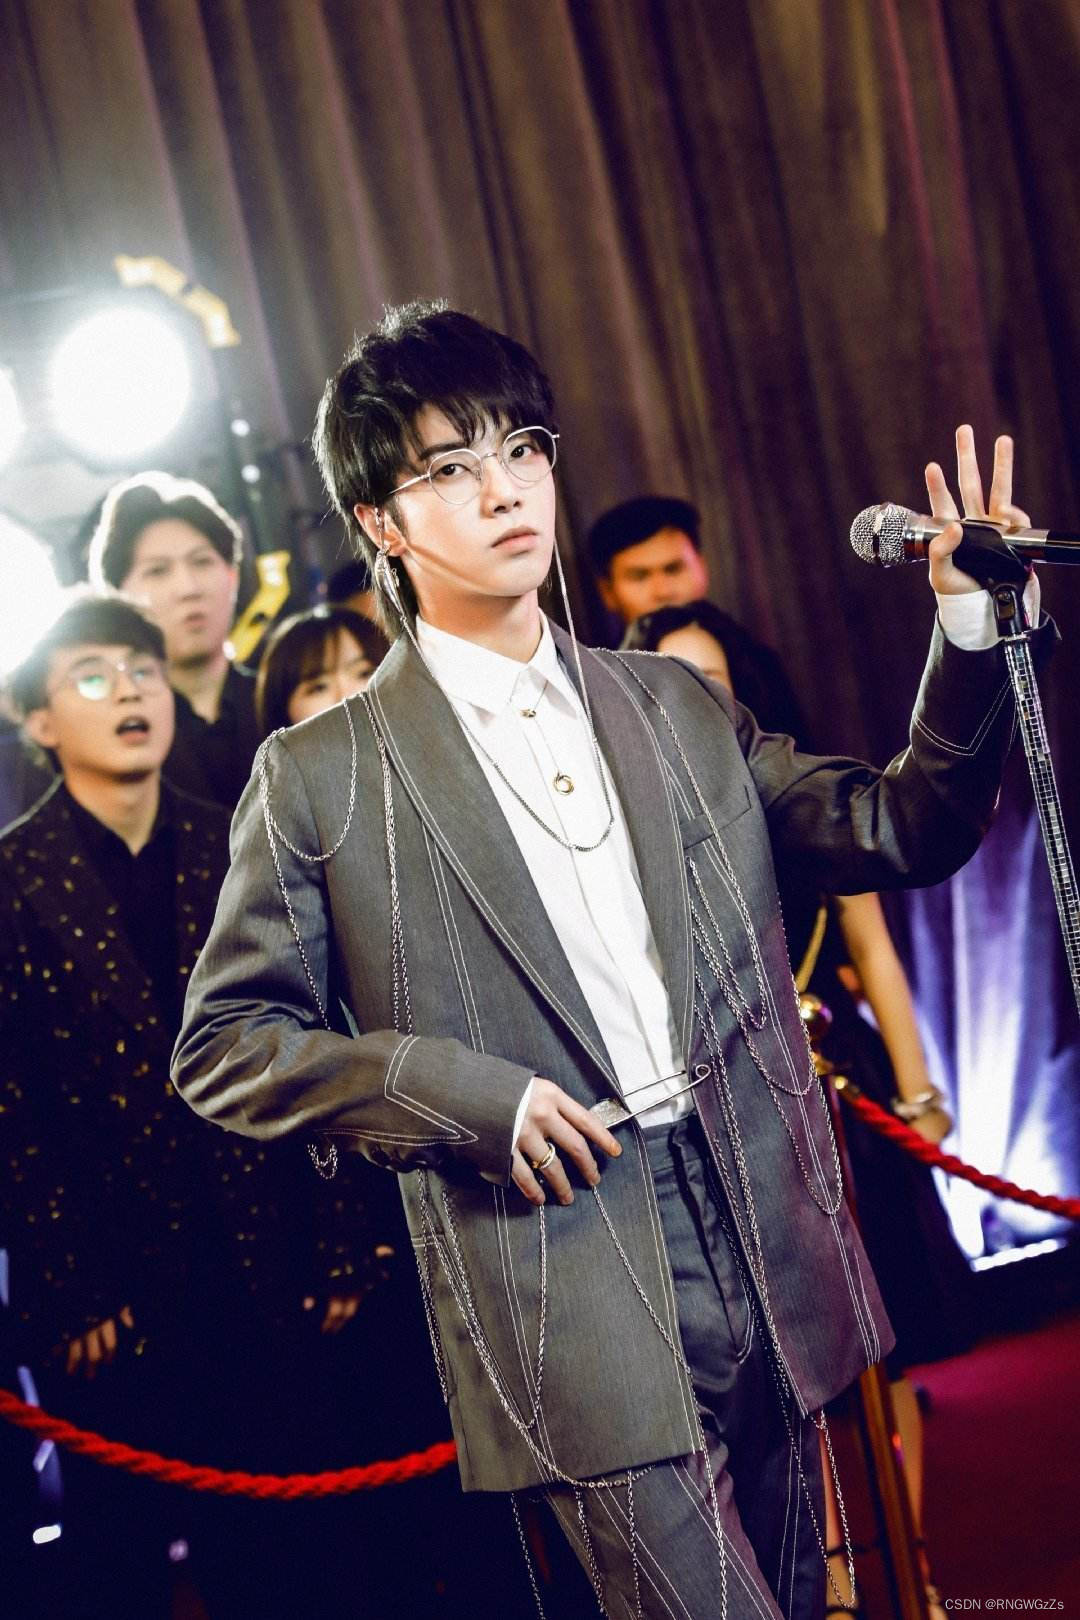
单样本数据增强方法包括空间几何变换以及颜色变换,其中,几何变换的操作主要有翻转,切割,旋转,缩放变形,仿射,颜色变换的操作主要有高斯噪声,模糊,HSV对比度变换,随机擦除法,锐化与浮雕等等,图片处理结果如下

代码如下
import cv2
import  numpy as np
from imgaug import  augmenters as iaa
seq=iaa.Sequential([
    iaa.Crop(px=(0,30)),
    iaa.Fliplr(0.7),
    iaa.GaussianBlur(sigma=(0,2.0)),
    iaa.Dropout(0.3),
    iaa.Grayscale(0.9),
    iaa.Emboss(0.9),
    iaa.EdgeDetect(0.5),
    iaa.AdditiveGaussianNoise(loc=0,scale=50),
    iaa.Multiply(2),
    iaa.contrast.LinearContrast(2),
    iaa.Affine(scale=0.5,translate_percent=-0.2,rotate=1,shear=90,order=1,cval=1,mode='constant')


])
imglist=[]
img=cv2.imread(r'C:\Users\Administrator\Desktop\qq.jpg')
cv2.imshow('img',img)
cv2.waitKey()
imglist.append(img)
images_aug=seq.augment_images(imglist)
#image=np.asarray(images_aug)
#cv2.imshow('image',image)
cv2.imwrite(r"
g",images_aug[0])
三、关键点变换
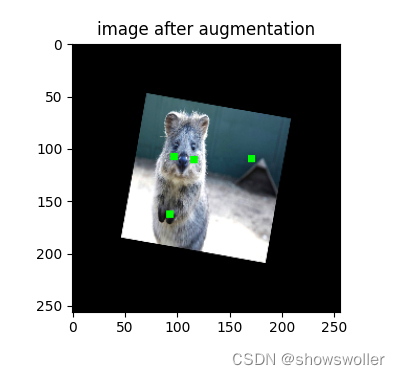
imgaug库支持在图像变换的同时变换图像中的关键点,关键点变换结果如下图所示 分为以下几步
1:导入第三方库
2:导入一张原图
3:定义四个关键点
4:定义一个变换序列
5:取出该图和关键点
6:打印坐标
7:将关键点画在图片上

代码如下
import imgaug as ia
from imgaug import augmenters as iaa
import matplotlib.pyplot as plt


image=ia.data.quokka(size=(256,256))

# 定义4个关键点
keypoints=ia.KeypointsOnImage([
    ia.Keypoint(x=65, y=100),
    ia.Keypoint(x=75, y=200),
    ia.Keypoint(x=100, y=100),
    ia.Keypoint(x=200, y=80)
], shape=image.shape)

# 定义一个变换序列
seq=iaa.Sequential([
    iaa.Multiply((1.2, 1.5)), # 改变亮度,不影响关键点
    iaa.Ae=(0.5, 0.7)
    ) # 旋转10度然后缩放,会影响关键点
])
先变换图像然后变换关键点,这样可以保证两次的变换完全相同。
# 如果调用次函数,需要在每次batch的时候都调用一次,否则不同的batch执行相同的变换。
seq_seq_det.augment_images([image])[0]
keypoints_aug = seq_det.augment_keypoints([keypoints])[0]

# print coordinates before/after augmentation (see below)
# use after.x_int and after.y_int to get rounded integer coordinates
for i in range(len(keypoints.keypoints)):
    before = keypoints.keypoints[i]
    after = keypoints_aug.keypoints[i]
    print("Keypoint %d: (%.8f, %.8f) -> (%.8f, %.8f)" % (
        i, before.x, before.y, after.x, after.y)
    )

# 将关键点画在图片上。
# image with keypoints before/after augmentation (shown below)
image_before = keypoints.draw_on_image(image, size=7)
image_after = keypoints_aug.draw_on_image(image_aug, size=7)

fig, axes = plt.subplots(2, 1, figsize=(20, 15))
plt.subplots_adjust(left=0.2, bottom=0.2, right=0.8, top=0.8, hspace=0.3, wspace=0.0)
axes[0].set_title("image before")
axes[0].imshow(image_before)
axes[1].set_title("image after augmentation")
axes[1].imshow(image_after)

plt.show()
四、标注框(Bounding Box)变换
imgaug在图像变换的同时变换图像中的Bounding Box
1:将Bounding Box封装成对象
2:对Bounding Box进行变换
3:将Bounding Box画在图像上
4:移动Bounding Box的位置上,将变换后的Bounding Box映射到图像上,计算Bounding Box的IoU
变换结果如下

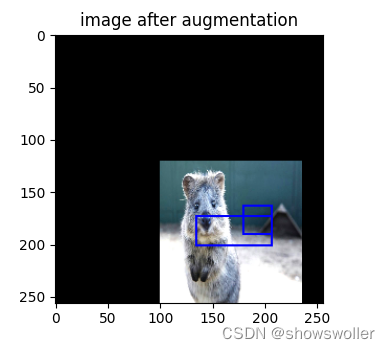
步骤分为以下几步
1:导入第三方库
2:导入quokka的一张原图
3:定义两个Bounding Box
4:定义一个变换序列
5:变换图像和bounding box
6:打印坐标
7:增强前后的图像显示
部分代码如下
import imgaug as ia
from imgaug import augmenters as iaa
import matplotlib.pyplot as plt
ia.seed(1)

image = ia.data.quokka(size=(256, 256))

# 定义2个bounding box
bbs = ia.BoundingBoxesOnImage([
    ia.BoundingBox(x1=65, y1=100, x2=200, y2=150),
    ia.Bound
seq = iaa.Sequential([
    iaa.Multiply((1.2, 1.5)), # 改变亮度, 不影响bounding box
    iaa.Affine(
        translate_px={"x": 40, "y": 60},
        scale=(0.5, 0.7)
    ) # 平移后缩放,会影响bounding box
])

# 固定变换
seq_det = seq.to_deterministic()

# 变换图像和bounding box
image_aug = seq_det.augment_images([image])[0]
bbs_aug = seq_
# 打印坐标
# use .x1_int, .y_int, ... to get integer coordinates
for i in range(len(bbs.bounding_boxes)):
    before = bbs.bounding_boxes[i]
    after = bbs_aug.bounding_boxes[i]
    print("BB %d: (%.4f, %.4f, %.4f, %.4f) -> (%.4f, %.4f, %.4f, %.4f)" % (
        i,
        before.x1, before.y1, before.x2, before.y2,
        after.x1, after.y1, after.x2, after.y2)
    )
# 输出
# BB 0: (65.0000, 100.0000, 200.0000, 150.0000) -> (130.7524, 171.3311, 210.1272, 200.7291)
# BB 1: (150.0000, 80.0000, 200.0000, 130.0000) -> (180.7291, 159.5718, 210.1272, 188.9699)

# image with BBs before/after augmentation (shown below)
image_before = bbs.draw_on_image(image, thickness=2)
image_after = bbs_aug.draw_on_image(image_aug, thickness=2, color=[0, 0, 255])

fig, axes = plt.subplots(2, 1, figsize=(20, 15))
plt.subplots_adjust(left=0.2, bottom=0.2, right=0.8, top=0.8, hspace=0.3, wspace=0.0)
axes[0].set_title("image before")
axes[0].imshow(image_before)
axes[1].set_title("image after augmentation")
axes[1].imshow(image_after)

plt.show()
创作不易 觉得有帮助请点赞关注收藏~~~

