1.简述
数据插值的计算机制
数据插值是一种函数逼近的方法。
一维插值
Y1=interp1(X,Y,X1,method)
二维插值
interp2():二维插值函数。
调用格式:
Z1=interp2(X,Y,Z,X1,Y1,method)
其中,X、Y是两个向量,表示两个参数的采样点, Z是采样点对应的函数值。X1、 Y1是两个标量或向量,表示要插值的点。
数据插值的实现方法
method用于指定插值方法,常用的取值有以下四种:
linear: 线性插值,默认方法。将与插值点靠近的两个数据点用直线 连接,然后在直线上选取对应插值点的数据。
nearest :最近点插值。选择最近样本点的值作为插值数据。
pchip:分段3次埃尔米特插值。采用分段三次多项式,除满足插值条件,还需满足在若干节点处相邻段插值函数的一-阶导数相等,使得曲线光滑的同时,还具有保形性。
spline: 3次样条插值。每个分段内构造一个三次多项式, 使其插值函数除满足插值条件外,还要求在各节点处具有连续的一阶和二阶导数。
2.代码
%% 学习目标:插值
%% 一维多项式插值
clc;
clear all;
x=0:0.2:2;
y=(x.^2-3*x+5).*exp(-3*x).*sin(x);
xi=0:0.03:2; %要插值的数据
yi_nearest=interp1(x,y,xi,'nearest'); %临近点插值
yi_linear=interp1(x,y,xi); %默认为线性插值
yi_spine=interp1(x,y,xi,'spine'); %三次样条插值
yi_pchip=interp1(x,y,xi,'pchip'); %分段三次Hermite插值
yi_v5cubic=interp1(x,y,xi,'v5cubic'); %MATLAB5中三次多项式插值
figure; %画图显示
hold on;
subplot(231);
plot(x,y,'ro');
title('已知数据点');
subplot(232);
plot(x,y,'ro',xi,yi_nearest,'b-');
title('临近点插值');
subplot(233);
plot(x,y,'ro',xi,yi_linear,'b-');
title('线性插值');
subplot(234);
plot(x,y,'ro',xi,yi_spine,'b-');
title('三次样条插值');
subplot(235);
plot(x,y,'ro',xi,yi_pchip,'b-');
title('分段三次Hermite插值');
subplot(236);
plot(x,y,'ro',xi,yi_v5cubic,'b-');
title('MATLAB5中三次多项式插值');
%% 采用一维快速傅立叶插值
clc;
clear all;
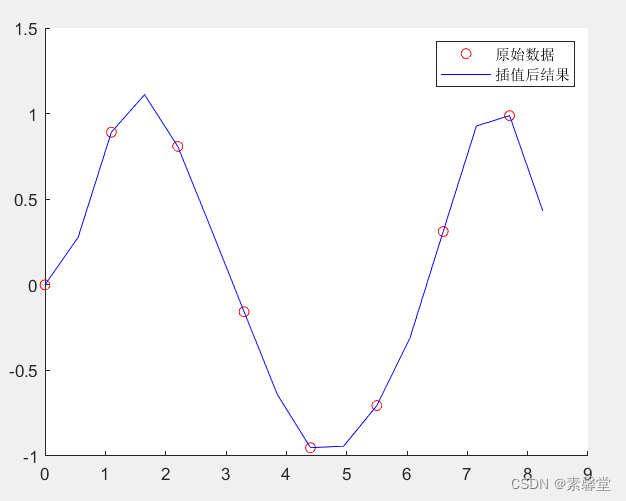
x=0:1.1:8;
y=sin(x);
n=2*length(x); %增采样1倍
yi=interpft(y,n);%采用一维快速傅立叶插值
xi=0:0.55:8.3;%要插值的数据
figure;%画图显示
hold on;
plot(x,y,'ro',xi,yi,'b-');
legend('原始数据','插值后结果');
%% 三次样条插值
clc;
clear all;
x=0:10;%原始数据
y=sin(x);
xi=0:.25:10;%插值数据
yi=spline(x,y,xi);%三次样条插值
pp=spline(x,y);%产生插值函数
y1=ppval(pp,xi); %结果相同y1=yi
y2=interp1(x,y,xi,'spline'); %结果相同y2=yi
figure;%画图显示
plot(x,y,'o',xi,yi);
legend('原始数据','三次样条插值');
3.运行结果


