目录
写在前面:
开始
工作薄 and 工作表
操作单元格
访问(调用)单个单元格
访问(调用)多个单元格
保存工作薄
用例
例:简单数据和条形图
操作样式
样式的默认值
单元格样式和命名样式
单元格样式
命名样式(模板样式)
内置样式
富文本
创建一个富文本单元格
编辑富文本单元格
富文本可以直接赋值给单元格
写在前面:
在查看openpyxl文档时,对平时需要用到的语法做记录,方便以后查阅。本文不会有执行代码,可以理解为是随笔记录。误入的同学可以走啦,哈哈。
官方文档地址:Tutorial — openpyxl 3.1.2 documentation
开始
安装包 pip install openpyxl
安装时会检查依赖包lxml是否有,没有的话会安装。【本人之前在独立创建的虚拟环境里安装时就遇到lxml安装报错,后来是通过升级pip的版本解决的。】
如果要在Excel文档中插入图片,需要安装pillow包 pip install pillow,如果在线安装不成功,可以到Pillow · PyPI, 下载本地包安装
工作薄 and 工作表
创建Excel文件(工作薄)
>>>from openpyxl import Workbook
>>>wb=Workbook()
workbook中总是有一个worksheet(工作表)是激活状态,也可以理解为是当前编辑状态,可以通过Workbook.active定位到这个工作表
>>>ws=wb.active
默认这个工作表索引是0,除非你做了更改,不然调用wb.active这个方法得到的一直都会是这个工作表。
创建新的工作表 Workbook.create_sheet()
>>>ws1=wb.create_sheet("Mysheet") #默认新建的工作表追加在后面
>>>ws2=wb.create_sheet("Mysheet",0) #将新建的工作表设置为索引0的位置,也就是文件中排在第一个的工作表
>>>ws3=wb.create_sheet("Mysheet",-1) #将新建的工作表放在倒数第二的位置
工作表的名称如果创建的时候没有设定,程序会自动用(Sheet,Sheet1,Sheet2,...)序列进行填充。后续要改变工作表名字可以通过Worksheet.title进行修改
>>>ws.title="New Title"
只要你确定知道某个工作表的名称,就可以通过名称调用该工作表
>>>ws3=wb["New Title"]
可以通过Workbook.sheetname获取所有工作表的名称,返回一个列表
>>>print(wb.sheetnames)
out: ['Sheet2','New Title','Sheet1']
遍历调用工作表
>>> for sheet in wb:
··· print(sheet.title)
在同一个工作薄里可以复制工作表,如果工作薄是以只读或只写模式打开不能复制。
>>>source = wb.active
>>>target = wb.copy_worksheet(source)
注意:只有单元格和工作表部分属性可以复制,其他的属性不能复制。单元格属性包括值、样式、超链接、评论,工作表可复制属性包括尺寸、格式和特性。工作薄属性和工作表其他属性不能复制,例如图片、折线图。
也就是说复制整个工作表,如果工作表里携带了图片或绘制折线图,黏贴到新的工作表上这些是没有的。
操作单元格
访问(调用)单个单元格
>>>c=ws['A4']
返回A4单元格,没有则创建。
>>>ws['A4']=4
在A4单元格中填充数字4
>>>d=ws.cell(row=4,column=2,value=10)
在第4行第2列填充数字10
注意:在内存中创建工作薄时工作薄中是没有单元格的,所以首次调用单元格程序同时执行创建操作。所以如果在还没有单元格时,就遍历单元格,那么遍历的这些单元格就会被创建。例如创建工作薄后直接就100行100列遍历每个单元格,那内存中会创建100*100个单元格。
访问(调用)多个单元格
>>> cell_range = ws['A1':'C2']

>>>colC=ws['C'] # 获取C列
>>>col_range=ws['C:D'] # 获取C到D列
>>>row10=ws[10] # 获取第10行
>>>row_range=ws[5:10] # 获取5到10行
可以使用Worksheet.iter_rows()方法获取多行单元格
>>>for row in ws.iter_rows(min_row=1,max_col=3,max_row=2):
··· for cell in row:
··· print(cell)
out:
<Cell Sheet1.A1>
<Cell Sheet1.B1>
<Cell Sheet1.C1>
<Cell Sheet1.A2>
<Cell Sheet1.B2>
<Cell Sheet1.C2>
可以使用Worksheet.iter_cols()方法获取多列单元格
>>>for col in ws.iter_cols(min_row=1,max_col=3,max_row=2):
··· for cell in col:
··· print(cell)
out:
<Cell Sheet1.A1>
<Cell Sheet1.A2>
<Cell Sheet1.B1>
<Cell Sheet1.B2>
<Cell Sheet1.C1>
<Cell Sheet1.C2>
遍历工作表所有的行,可以使用Worksheet.rows
>>>tuple(ws.rows)
out:
((<Cell Sheet.A1>, <Cell Sheet.B1>, <Cell Sheet.C1>),
(<Cell Sheet.A2>, <Cell Sheet.B2>, <Cell Sheet.C2>),
(<Cell Sheet.A3>, <Cell Sheet.B3>, <Cell Sheet.C3>),
(<Cell Sheet.A4>, <Cell Sheet.B4>, <Cell Sheet.C4>),
(<Cell Sheet.A5>, <Cell Sheet.B5>, <Cell Sheet.C5>),
(<Cell Sheet.A6>, <Cell Sheet.B6>, <Cell Sheet.C6>),
(<Cell Sheet.A7>, <Cell Sheet.B7>, <Cell Sheet.C7>),
(<Cell Sheet.A8>, <Cell Sheet.B8>, <Cell Sheet.C8>),
(<Cell Sheet.A9>, <Cell Sheet.B9>, <Cell Sheet.C9>))
遍历工作表所有的列,可以使用Worksheet.columns
>>>tuple(ws.columns)
out:
((<Cell Sheet.A1>,
<Cell Sheet.A2>,
<Cell Sheet.A3>,
<Cell Sheet.A4>,
<Cell Sheet.A5>,
<Cell Sheet.A6>,
...
<Cell Sheet.B7>,
<Cell Sheet.B8>,
<Cell Sheet.B9>),
(<Cell Sheet.C1>,
<Cell Sheet.C2>,
<Cell Sheet.C3>,
<Cell Sheet.C4>,
<Cell Sheet.C5>,
<Cell Sheet.C6>,
<Cell Sheet.C7>,
<Cell Sheet.C8>,
<Cell Sheet.C9>))
只想要返回值,不要返回单元格,可以使用Worksheet.values
for row in ws.values:
for value in row:
print(value)
Worksheet.iter_rows()和Worksheet.iter_cols(),将参数values_only设置为True,就只返回单元格中的值
>>>for row in ws.iter_rows(min_row=1,max_col=3,max_row=2,values_only=True):
··· print(row)
out:
(None,None,None)
(None,None,None)
往单元格中写入值
>>>c.value='hello,world'
>>>print(c.value)
out:'hello,world'
>>>d.value=3.14
>>>print(d.value)
out:3.14
保存工作薄
>>>wb=Workbook()
>>>wb.save('balances.xlsx')
加载已存在的工作薄
>>>from openpyxl import load_workbook
>>>wb=load_workbook(filename='empty_book.xlsx')
>>>sheet_ranges=wb['range names']
>>>print(sheet_ranges['D18'].value)
out: 3
用例
例:简单数据和条形图
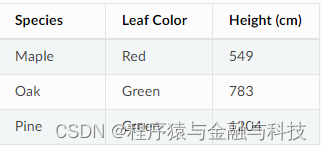
原始数据
代码
# 填充数据
from openpyxl import Workbook
wb = Workbook()
ws = wb.active
treeData = [["Type", "Leaf Color", "Height"], ["Maple", "Red", 549], ["Oak", "Green", 783], ["Pine", "Green", 1204]]
for row in treeData:
    ws.append(row)

# 单元格字体
from openpyxl.styles import Font
ft = Font(bold=True)
for row in ws["A1:C1"]:
    for cell in row:
        cell.font=ft

# 条形图
# 1 设置条形图基础属性
from openpyxl.chart import BarChart, Series, Reference
chart = BarChart()
chart.type = "col"
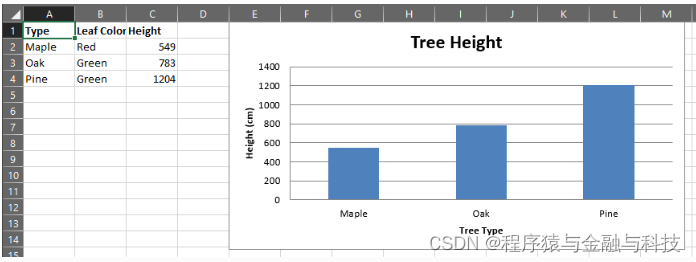
chart.title = "Tree Height"
chart.y_axis.title = 'Height (cm)'
chart.x_axis.title = 'Tree Type'
chart.legend = None
# 2 映射要展示的数据
data = Reference(ws, min_col=3, min_row=2, max_row=4, max_col=3)
categories = Reference(ws, min_col=1, min_row=2, max_row=4, max_col=1)
chart.add_data(data)
chart.set_categories(categories)
# 3 将条形图插入工作表
ws.add_chart(chart, "E1")
# 保存工作薄
wb.save("TreeData.xlsx")
结果
操作样式
样式的默认值
>>> from openpyxl.styles import PatternFill, Border, Side, Alignment, Protection, Font
>>> font = Font(name='Calibri',
...                 size=11,
...                 bold=False,
...                 italic=False,
...                 vertAlign=None,
...                 underline='none',
...                 strike=False,
...                 color='FF000000')
>>> fill = PatternFill(fill_type=None,
...                 start_color='FFFFFFFF',
...                 end_color='FF000000')
>>> border = Border(left=Side(border_style=None,
...                           color='FF000000'),
...                 right=Side(border_style=None,
...                            color='FF000000'),
...                 top=Side(border_style=None,
...                          color='FF000000'),
...                 bottom=Side(border_style=None,
...                             color='FF000000'),
...                 diagonal=Side(border_style=None,
...                               color='FF000000'),
...                 diagonal_direction=0,
...                 outline=Side(border_style=None,
...                              color='FF000000'),
...                 vertical=Side(border_style=None,
...                               color='FF000000'),
...                 horizontal=Side(border_style=None,
...                                color='FF000000')
...                )
>>> alignment=Alignment(horizontal='general',
...                     vertical='bottom',
...                     text_rotation=0,
...                     wrap_text=False,
...                     shrink_to_fit=False,
...                     indent=0)
>>> number_format = 'General'
>>> protection = Protection(locked=True,
...                         hidden=False)
>>>
单元格样式和命名样式
两种类型的样式,单元格样式,和命名样式,命名样式可以理解为样式模板
单元格样式
>>> from openpyxl.styles import colors
>>> from openpyxl.styles import Font, Color
>>> from openpyxl import Workbook
>>> wb = Workbook()
>>> ws = wb.active
>>>
>>> a1 = ws['A1']
>>> d4 = ws['D4']
>>> ft = Font(color="FF0000")
>>> a1.font = ft
>>> d4.font = ft
>>>
>>> a1.font.italic = True # is not allowed # doctest: +SKIP
>>>
>>> # If you want to change the color of a Font, you need to reassign it::
>>>
>>> a1.font = Font(color="FF0000", italic=True) # the change only affects A1
复制样式
>>> from openpyxl.styles import Font
>>> from copy import copy
>>>
>>> ft1 = Font(name='Arial', size=14)
>>> ft2 = copy(ft1)
>>> ft2.name = "Tahoma"
>>> ft1.name
'Arial'
>>> ft2.name
'Tahoma'
>>> ft2.size # copied from the
14.0
颜色
>>> from openpyxl.styles import Font
>>> font = Font(color="FF0000")

>>> from openpyxl.styles import Font
>>> font = Font(color="00FF00")
>>> font.color.rgb
'0000FF00'

>>> from openpyxl.styles.colors import Color
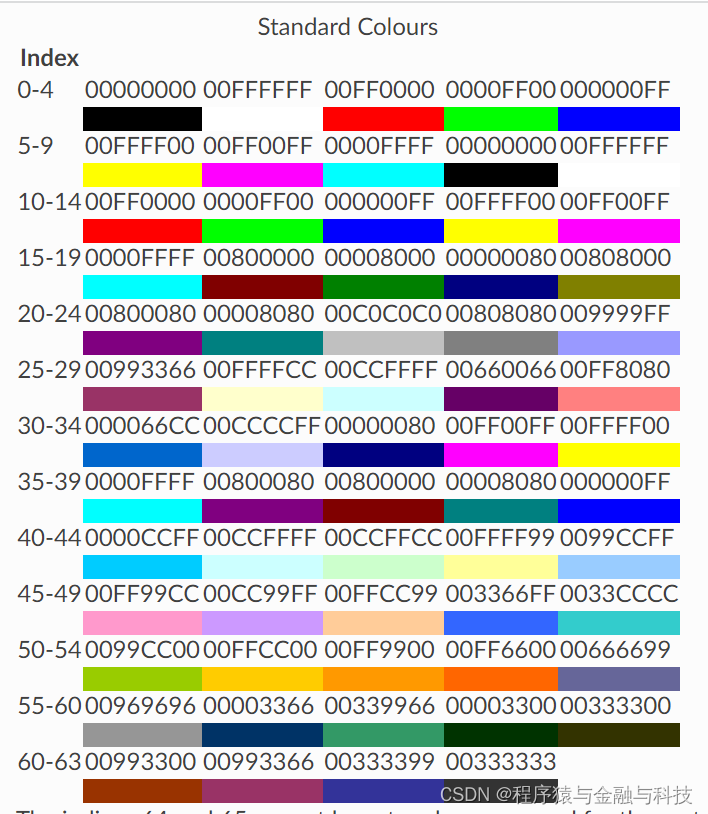
>>> c = Color(indexed=32)
>>> c = Color(theme=6, tint=0.5)
该代码中indexed的值和color的值看下图
样式应用
# 单个单元格设置样式
>>> from openpyxl.workbook import Workbook
>>> from openpyxl.styles import Font, Fill
>>> wb = Workbook()
>>> ws = wb.active
>>> c = ws['A1']
>>> c.font = Font(size=12)

#整列、整行设置样式
>>> col = ws.column_dimensions['A']
>>> col.font = Font(bold=True)
>>> row = ws.row_dimensions[1]
>>> row.font = Font(underline="single")
给“合并单元格”设置样式
合并单元格的样式属性都绑定在左上角那个单元格上,所以定位某个合并单元格,就是定位到该合并单元格左上角单元格的索引位置
>>> from openpyxl.styles import Border, Side, PatternFill, Font, GradientFill, Alignment
>>> from openpyxl import Workbook
>>>
>>> wb = Workbook()
>>> ws = wb.active
>>> ws.merge_cells('B2:F4')
>>>
>>> top_left_cell = ws['B2']
>>> top_left_cell.value = "My Cell"
>>>
>>> thin = Side(border_style="thin", color="000000")
>>> double = Side(border_style="double", color="ff0000")
>>>
>>> top_left_cell.border = Border(top=double, left=thin, right=thin, bottom=double)
>>> top_left_cell.fill = PatternFill("solid", fgColor="DDDDDD")
>>> top_left_cell.fill = fill = GradientFill(stop=("000000", "FFFFFF"))
>>> top_left_cell.font  = Font(b=True, color="FF0000")
>>> top_left_cell.alignment = Alignment(horizontal="center", vertical="center")
>>>
>>> wb.save("styled.xlsx")
单元格赋值时间、浮点数等非字符
>>> import datetime
>>> from openpyxl import Workbook
>>> wb = Workbook()
>>> ws = wb.active
>>> # set date using a Python datetime
>>> ws['A1'] = datetime.datetime(2010, 7, 21)
>>>
>>> ws['A1'].number_format
'yyyy-mm-dd h:mm:ss'
>>>
>>> ws["A2"] = 0.123456
>>> ws["A2"].number_format = "0.00" # Display to 2dp
启动时初始工作表样式
>>> from openpyxl.workbook import Workbook
>>>
>>> wb = Workbook()
>>> ws = wb.active
>>>
>>> ws.page_setup.orientation = ws.ORIENTATION_LANDSCAPE
>>> ws.page_setup.paperSize = ws.PAPERSIZE_TABLOID
>>> ws.page_setup.fitToHeight = 0
>>> ws.page_setup.fitToWidth = 1
命名样式(模板样式)
模板样式可以在批量单元格中复用,而且一旦某些单元格使用了该模板样式,后续模板样式更新不会影响前序已经使用的单元格,也就是说已经使用了该模板样式的单元格不会同步更新,还是旧版本的样式。
创建模板样式
>>> from openpyxl.styles import NamedStyle, Font, Border, Side
>>> highlight = NamedStyle(name="highlight")
>>> highlight.font = Font(bold=True, size=20)
>>> bd = Side(style='thick', color="000000")
>>> highlight.border = Border(left=bd, top=bd, right=bd, bottom=bd)
模板样式创建后,可以添加到工作簿中
>>> wb.add_named_style(highlight)
如果没有执行 wb.add_named_style(highlight) 直接调用,程序会自动添加到工作簿中
>>> ws['A1'].style = highlight
如果已经执行了 wb.add_named_stype(highlight) 那么调用的时候可以直接使用模板样式的名称
>>> ws['D5'].style = 'highlight'
内置样式
注意:有些翻译成中文怪怪的,直接附有英文
| 没有样式 same as no style | Normal |
| 数值格式 Number format |
|
| 信息 Informative |
|
| 文本样式 Text styles |
|
| 比较 Comparisons |
|
| 高亮 Highlights |
|
富文本
创建一个富文本单元格
>>> from openpyxl.cell.text import InlineFont
>>> from openpyxl.cell.rich_text import TextBlock, CellRichText
>>> rich_string1 = CellRichText(
...    'This is a test ',
...    TextBlock(InlineFont(b=True), 'xxx'),
...   'yyy'
... )
InlineFont行内字体属性默认值
>>> inline_font = InlineFont(rFont='Calibri', # Font name
...                          sz=22,           # in 1/144 in. (1/2 point) units, must be integer
...                          charset=None,    # character set (0 to 255), less required with UTF-8
...                          family=None,     # Font family
...                          b=True,          # Bold (True/False)
...                          i=None,          # Italics (True/False)
...                          strike=None,     # strikethrough
...                          outline=None,
...                          shadow=None,
...                          condense=None,
...                          extend=None,
...                          color=None,
...                          u=None,
...                          vertAlign=None,
...                          scheme=None,
...                          )
也可以创建一个Font对象,将这个Font对象作为InlineFont的参数
>>> from openpyxl.cell.text import Font
>>> font = Font(name='Calibri',
...             size=11,
...             bold=False,
...             italic=False,
...             vertAlign=None,
...             underline='none',
...             strike=False,
...             color='00FF0000')
>>> inline_font = InlineFont(font)
也可以先创建InLineFont放着,要使用时再调用
>>> big = InlineFont(sz="30.0")
>>> medium = InlineFont(sz="20.0")
>>> small = InlineFont(sz="10.0")
>>> bold = InlineFont(b=True)
>>> b = TextBlock
>>> rich_string2 = CellRichText(
...       b(big, 'M'),
...       b(medium, 'i'),
...       b(small, 'x'),
...       b(medium, 'e'),
...       b(big, 'd')
... )
例子
>>> red = InlineFont(color='FF000000')
>>> rich_string1 = CellRichText(['When the color ', TextBlock(red, 'red'), ' is used, you can expect ', TextBlock(red, 'danger')])
富文本单元格,不能在两个元素之间添加空格
>>> t = CellRichText()
>>> t.append('xx')
>>> t.append(TextBlock(red, "red"))
如果只想得到单元格中的文本,不要格式
>>> str(t)
'xxred'
编辑富文本单元格
>>> l = rich_string1.as_list()
>>> l
['When the color ', 'red', ' is used, you can expect ', 'danger']
>>> l.index("danger")
3
>>> rich_string1[3].text = "fun"
>>> str(rich_string1)
'When the color red is used, you can expect fun'
富文本可以直接赋值给单元格
>>> from openpyxl import Workbook
>>> wb = Workbook()
>>> ws = wb.active
>>> ws['A1'] = rich_string1
>>> ws['A2'] = 'Simple string'
先整理到这,后续内容得空再另开文章
