目录
说明
背景
问题复现
环境
sql
排查
分析过程
结果分析
总结
说明
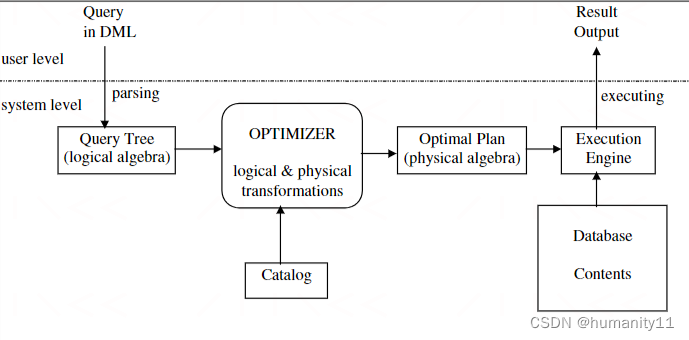
sql优化中重要的一环是查询改写,一个表的元数据有利于sql优化器准确的评估sql代价,获取最佳的sql执行计划,如下图所示,本文验证通过加载刷新impala 元数据可以显著性提高sql查询性能。
背景
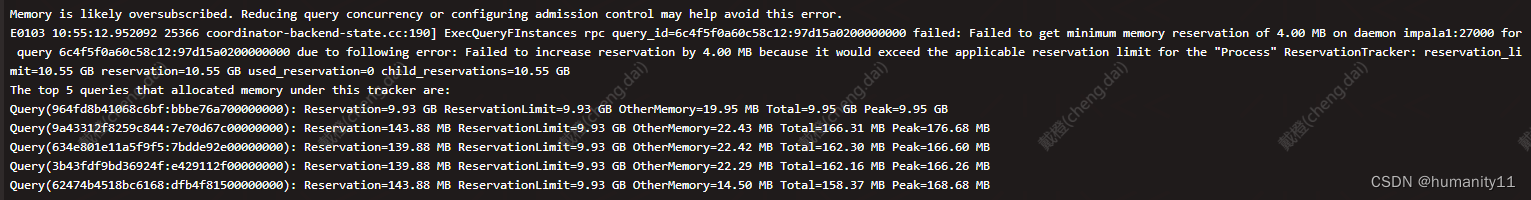
最新生产环境出现一次因为impala sql 评估内存过大,导致查询失败的情况,问题如图所示,通过排查发现impala元数据缺少导致。
问题复现
环境
centos 7,
impala 3G
kudu_tserver 2G
sql
with v as (
  select group_id,group_value_id,item_id from test__mdm__t_mdm_item_value group by group_id,group_value_id,item_id
),
g as(
  select id,count(*) gc from test__mdm__t_mdm_group group by id
),
gv as (
  select id,count(*) gvc from test__mdm__t_mdm_group_value group by id
)
select tenant_id,count(*),sum(gc),sum(gvc) from test__mdm__t_mdm_item i inner join  v on i.id=v.item_id inner join g on g.id=v.group_id  inner join gv on v.group_value_id=gv.id group by tenant_id;
运行上述sql抛出了如下报错信息
Query submitted at: 2023-01-05 10:14:31 (Coordinator: http://172.22.0.11:25000)
Query progress can be monitored at: http://172.22.0.11:25000/query_plan?query_id=1742a9d3516ad2cc:70b622c700000000
ERROR: Failed to get minimum memory reservation of 1.07 GB on daemon 172.22.0.11:27000 for query 1742a9d3516ad2cc:70b622c700000000 due to following error: Memory limit exceeded: Could not allocate memory while trying to increase reservation.
Query(1742a9d3516ad2cc:70b622c700000000) could not allocate 1.07 GB without exceeding limit.
Error occurred on backend 172.22.0.11:27000
Memory left in process limit: 1.19 GB
Query(1742a9d3516ad2cc:70b622c700000000): Reservation=0 ReservationLimit=1.92 GB OtherMemory=0 Total=0 Peak=0
Memory is likely oversubscribed. Reducing query concurrency or configuring admission control may help avoid this error.
排查
通过impala日志查看该查询sql,发现日志中如下内容
Query (id=1742a9d3516ad2cc:70b622c700000000):
   - InactiveTotalTime: 0.000ns
   - TotalTime: 0.000ns
  Summary:
    Session ID: 12477a75e446d208:c0896fa42acdd28c
    Session Type: BEESWAX
    Start Time: 2023-01-05 02:14:31.375765000
    End Time: 2023-01-05 02:14:31.404789000
    Query Type: QUERY
    Query State: EXCEPTION
    Impala Query State: ERROR
    Query Status: Failed to get minimum memory reservation of 1.07 GB on daemon 172.22.0.11:27000 for query 1742a9d3516ad2cc:70b622c700000000 due to following error: Memory limit exceeded: Could not allocate memory while trying to increase reservation.
Query(1742a9d3516ad2cc:70b622c700000000) could not allocate 1.07 GB without exceeding limit.
Error occurred on backend 172.22.0.11:27000
Memory left in process limit: 1.19 GB
Query(1742a9d3516ad2cc:70b622c700000000): Reservation=0 ReservationLimit=1.92 GB OtherMemory=0 Total=0 Peak=0
Memory is likely oversubscribed. Reducing query concurrency or configuring admission control may help avoid this error.
    Impala Version: impalad version 4.0.0-SNAPSHOT RELEASE (build d2253013f9aae0057a07fe045d90aca440053583)
    User: root
    Connected User: root
    Delegated User:
    Network Address: 192.168.104.95:51982
    Default Db: default
    Sql Statement: with v as (
select group_id,group_value_id,item_id from test__mdm__t_mdm_item_value group by group_id,group_value_id,item_id
),
g as(
select id,count(*) gc from test__mdm__t_mdm_group group by id
),
gv as (
select id,count(*) gvc from test__mdm__t_mdm_group_value group by id
)
select tenant_id,count(*),sum(gc),sum(gvc) from test__mdm__t_mdm_item i inner join  v on i.id=v.item_id inner join g on g.id=v.group_id  inner join gv on v.group_value_id=gv.id group by tenant_id
    Coordinator: 172.22.0.11:27000
    Query Options (set by configuration): MT_DOP=4,TIMEZONE=UCT,DEFAULT_FILE_FORMAT=4,DEFAULT_TRANSACTIONAL_TYPE=1,USE_LOCAL_TZ_FOR_UNIX_TIMESTAMP_CONVERSIONS=1,CONVERT_LEGACY_HIVE_PARQUET_UTC_TIMESTAMPS=1
    Query Options (set by configuration and planner): MT_DOP=4,TIMEZONE=UCT,DEFAULT_FILE_FORMAT=4,DEFAULT_TRANSACTIONAL_TYPE=1,USE_LOCAL_TZ_FOR_UNIX_TIMESTAMP_CONVERSIONS=1,CONVERT_LEGACY_HIVE_PARQUET_UTC_TIMESTAMPS=1
    Plan:
----------------
Max Per-Host Resource Reservation: Memory=1.07GB Threads=24
Per-Host Resource Estimates: Memory=8.51GB
WARNING: The following tables are missing relevant table and/or column statistics.
default.test__mdm__t_mdm_item_value
Analyzed query: WITH v AS (SELECT group_id, group_value_id, item_id FROM
`default`.test__mdm__t_mdm_item_value GROUP BY group_id, group_value_id,
item_id),g AS (SELECT id, count(*) gc FROM `default`.test__mdm__t_mdm_group
GROUP BY id),gv AS (SELECT id, count(*) gvc FROM
`default`.test__mdm__t_mdm_group_value GROUP BY id) SELECT tenant_id, count(*),
sum(gc), sum(gvc) FROM `default`.test__mdm__t_mdm_item i INNER JOIN v ON i.id =
v.item_id INNER JOIN g ON g.id = v.group_id INNER JOIN gv ON v.group_value_id =
gv.id GROUP BY tenant_id

F08:PLAN FRAGMENT [UNPARTITIONED] hosts=1 instances=1
|  Per-Instance Resources: mem-estimate=79.96KB mem-reservation=0B thread-reservation=1
PLAN-ROOT SINK
|  output exprs: tenant_id, count(*), sum(gc), sum(gvc)
|  mem-estimate=0B mem-reservation=0B thread-reservation=0
|
22:EXCHANGE [UNPARTITIONED]
|  mem-estimate=79.96KB mem-reservation=0B thread-reservation=0
|  tuple-ids=10 row-size=36B cardinality=unavailable
|  in pipelines: 21(GETNEXT)
|
F07:PLAN FRAGMENT [HASH(tenant_id)] hosts=1 instances=2
Per-Instance Resources: mem-estimate=128.08MB mem-reservation=34.00MB thread-reservation=1
21:AGGREGATE [FINALIZE]
|  output: count:merge(*), sum:merge(gc), sum:merge(gvc)
|  group by: tenant_id
|  mem-estimate=128.00MB mem-reservation=34.00MB spill-buffer=2.00MB thread-reservation=0
|  tuple-ids=10 row-size=36B cardinality=unavailable
|  in pipelines: 21(GETNEXT), 00(OPEN)
|
20:EXCHANGE [HASH(tenant_id)]
|  mem-estimate=79.96KB mem-reservation=0B thread-reservation=0
|  tuple-ids=10 row-size=36B cardinality=unavailable
|  in pipelines: 00(GETNEXT)
|
F00:PLAN FRAGMENT [RANDOM] hosts=1 instances=2
Per-Host Shared Resources: mem-estimate=1.00MB mem-reservation=1.00MB thread-reservation=0 runtime-filters-memory=1.00MB
Per-Instance Resources: mem-estimate=128.75MB mem-reservation=34.00MB thread-reservation=1
10:AGGREGATE [STREAMING]
|  output: count(*), sum(count(*)), sum(count(*))
|  group by: tenant_id
|  mem-estimate=128.00MB mem-reservation=34.00MB spill-buffer=2.00MB thread-reservation=0
|  tuple-ids=10 row-size=36B cardinality=unavailable
|  in pipelines: 00(GETNEXT)
|
09:HASH JOIN [INNER JOIN, BROADCAST]
|  hash-table-id=00
|  hash predicates: group_value_id = id
|  fk/pk conjuncts: assumed fk/pk
|  mem-estimate=0B mem-reservation=0B spill-buffer=2.00MB thread-reservation=0
|  tuple-ids=0,2,5,8 row-size=108B cardinality=unavailable
|  in pipelines: 00(GETNEXT), 18(OPEN)
|
|--F09:PLAN FRAGMENT [RANDOM] hosts=1 instances=1
|  |  Per-Instance Resources: mem-estimate=2.00GB mem-reservation=137.00MB thread-reservation=1 runtime-filters-memory=1.00MB
|  JOIN BUILD
|  |  join-table-id=00 plan-id=01 cohort-id=01
|  |  build expressions: id
|  |  runtime filters: RF000[bloom] <- id, RF001[min_max] <- id
|  |  mem-estimate=2.00GB mem-reservation=136.00MB spill-buffer=2.00MB thread-reservation=0
|  |
|  19:EXCHANGE [BROADCAST]
|  |  mem-estimate=47.98KB mem-reservation=0B thread-reservation=0
|  |  tuple-ids=8 row-size=20B cardinality=unavailable
|  |  in pipelines: 18(GETNEXT)
|  |
|  F06:PLAN FRAGMENT [HASH(id)] hosts=1 instances=2
|  Per-Instance Resources: mem-estimate=128.05MB mem-reservation=34.00MB thread-reservation=1
|  18:AGGREGATE [FINALIZE]
|  |  output: count:merge(*)
|  |  group by: id
|  |  mem-estimate=128.00MB mem-reservation=34.00MB spill-buffer=2.00MB thread-reservation=0
|  |  tuple-ids=8 row-size=20B cardinality=unavailable
|  |  in pipelines: 18(GETNEXT), 05(OPEN)
|  |
|  17:EXCHANGE [HASH(id)]
|  |  mem-estimate=47.98KB mem-reservation=0B thread-reservation=0
|  |  tuple-ids=8 row-size=20B cardinality=unavailable
|  |  in pipelines: 05(GETNEXT)
|  |
|  F05:PLAN FRAGMENT [RANDOM] hosts=1 instances=2
|  Per-Instance Resources: mem-estimate=128.38MB mem-reservation=34.00MB thread-reservation=1
|  06:AGGREGATE [STREAMING]
|  |  output: count(*)
|  |  group by: id
|  |  mem-estimate=128.00MB mem-reservation=34.00MB spill-buffer=2.00MB thread-reservation=0
|  |  tuple-ids=8 row-size=20B cardinality=unavailable
|  |  in pipelines: 05(GETNEXT)
|  |
|  05:SCAN KUDU [default.test__mdm__t_mdm_group_value]
|     mem-estimate=384.00KB mem-reservation=0B thread-reservation=0
|     tuple-ids=7 row-size=16B cardinality=unavailable
|     in pipelines: 05(GETNEXT)
|
08:HASH JOIN [INNER JOIN, BROADCAST]
|  hash-table-id=01
|  hash predicates: group_id = id
|  fk/pk conjuncts: assumed fk/pk
|  mem-estimate=0B mem-reservation=0B spill-buffer=2.00MB thread-reservation=0
|  tuple-ids=0,2,5 row-size=88B cardinality=unavailable
|  in pipelines: 00(GETNEXT), 15(OPEN)
|
|--F10:PLAN FRAGMENT [RANDOM] hosts=1 instances=1
|  |  Per-Instance Resources: mem-estimate=2.00GB mem-reservation=137.00MB thread-reservation=1 runtime-filters-memory=1.00MB
|  JOIN BUILD
|  |  join-table-id=01 plan-id=02 cohort-id=01
|  |  build expressions: id
|  |  runtime filters: RF002[bloom] <- id, RF003[min_max] <- id
|  |  mem-estimate=2.00GB mem-reservation=136.00MB spill-buffer=2.00MB thread-reservation=0
|  |
|  16:EXCHANGE [BROADCAST]
|  |  mem-estimate=47.98KB mem-reservation=0B thread-reservation=0
|  |  tuple-ids=5 row-size=20B cardinality=unavailable
|  |  in pipelines: 15(GETNEXT)
|  |
|  F04:PLAN FRAGMENT [HASH(id)] hosts=1 instances=2
|  Per-Instance Resources: mem-estimate=128.05MB mem-reservation=34.00MB thread-reservation=1
|  15:AGGREGATE [FINALIZE]
|  |  output: count:merge(*)
|  |  group by: id
|  |  mem-estimate=128.00MB mem-reservation=34.00MB spill-buffer=2.00MB thread-reservation=0
|  |  tuple-ids=5 row-size=20B cardinality=unavailable
|  |  in pipelines: 15(GETNEXT), 03(OPEN)
|  |
|  14:EXCHANGE [HASH(id)]
|  |  mem-estimate=47.98KB mem-reservation=0B thread-reservation=0
|  |  tuple-ids=5 row-size=20B cardinality=unavailable
|  |  in pipelines: 03(GETNEXT)
|  |
|  F03:PLAN FRAGMENT [RANDOM] hosts=1 instances=2
|  Per-Instance Resources: mem-estimate=128.38MB mem-reservation=34.00MB thread-reservation=1
|  04:AGGREGATE [STREAMING]
|  |  output: count(*)
|  |  group by: id
|  |  mem-estimate=128.00MB mem-reservation=34.00MB spill-buffer=2.00MB thread-reservation=0
|  |  tuple-ids=5 row-size=20B cardinality=unavailable
|  |  in pipelines: 03(GETNEXT)
|  |
|  03:SCAN KUDU [default.test__mdm__t_mdm_group]
|     mem-estimate=384.00KB mem-reservation=0B thread-reservation=0
|     tuple-ids=4 row-size=16B cardinality=unavailable
|     in pipelines: 03(GETNEXT)
|
07:HASH JOIN [INNER JOIN, BROADCAST]
|  hash-table-id=02
|  hash predicates: i.id = item_id
|  fk/pk conjuncts: assumed fk/pk
|  mem-estimate=0B mem-reservation=0B spill-buffer=2.00MB thread-reservation=0
|  tuple-ids=0,2 row-size=68B cardinality=unavailable
|  in pipelines: 00(GETNEXT), 12(OPEN)
|
|--F11:PLAN FRAGMENT [RANDOM] hosts=1 instances=1
|  |  Per-Instance Resources: mem-estimate=2.00GB mem-reservation=137.00MB thread-reservation=1 runtime-filters-memory=1.00MB
|  JOIN BUILD
|  |  join-table-id=02 plan-id=03 cohort-id=01
|  |  build expressions: item_id
|  |  runtime filters: RF004[bloom] <- item_id, RF005[min_max] <- item_id
|  |  mem-estimate=2.00GB mem-reservation=136.00MB spill-buffer=2.00MB thread-reservation=0
|  |
|  13:EXCHANGE [BROADCAST]
|  |  mem-estimate=159.96KB mem-reservation=0B thread-reservation=0
|  |  tuple-ids=2 row-size=36B cardinality=unavailable
|  |  in pipelines: 12(GETNEXT)
|  |
|  F02:PLAN FRAGMENT [HASH(group_id,group_value_id,item_id)] hosts=1 instances=4
|  Per-Instance Resources: mem-estimate=128.16MB mem-reservation=34.00MB thread-reservation=1
|  12:AGGREGATE [FINALIZE]
|  |  group by: group_id, group_value_id, item_id
|  |  mem-estimate=128.00MB mem-reservation=34.00MB spill-buffer=2.00MB thread-reservation=0
|  |  tuple-ids=2 row-size=36B cardinality=unavailable
|  |  in pipelines: 12(GETNEXT), 01(OPEN)
|  |
|  11:EXCHANGE [HASH(group_id,group_value_id,item_id)]
|  |  mem-estimate=159.96KB mem-reservation=0B thread-reservation=0
|  |  tuple-ids=2 row-size=36B cardinality=unavailable
|  |  in pipelines: 01(GETNEXT)
|  |
|  F01:PLAN FRAGMENT [RANDOM] hosts=1 instances=4
|  Per-Host Shared Resources: mem-estimate=2.00MB mem-reservation=2.00MB thread-reservation=0 runtime-filters-memory=2.00MB
|  Per-Instance Resources: mem-estimate=129.12MB mem-reservation=34.00MB thread-reservation=1
|  02:AGGREGATE [STREAMING]
|  |  group by: group_id, group_value_id, item_id
|  |  mem-estimate=128.00MB mem-reservation=34.00MB spill-buffer=2.00MB thread-reservation=0
|  |  tuple-ids=2 row-size=36B cardinality=unavailable
|  |  in pipelines: 01(GETNEXT)
|  |
|  01:SCAN KUDU [default.test__mdm__t_mdm_item_value]
|     runtime filters: RF000[bloom] -> default.test__mdm__t_mdm_item_value.group_value_id, RF001[min_max] -> default.test__mdm__t_mdm_item_value.group_value_id, RF002[bloom] -> default.test__mdm__t_mdm_item_value.group_id, RF003[min_max] -> default.test__mdm__t_mdm_item_value.group_id
|     mem-estimate=1.12MB mem-reservation=0B thread-reservation=0
|     tuple-ids=1 row-size=48B cardinality=unavailable
|     in pipelines: 01(GETNEXT)
|
00:SCAN KUDU [default.test__mdm__t_mdm_item i]
   runtime filters: RF004[bloom] -> i.id, RF005[min_max] -> i.id
   mem-estimate=768.00KB mem-reservation=0B thread-reservation=0
   tuple-ids=0 row-size=32B cardinality=unavailable
   in pipelines: 00(GETNEXT)
----------------
    Estimated Per-Host Mem: 9142320744
    Tables Missing Stats: default.test__mdm__t_mdm_item_value
    Request Pool: default-pool
    Per Host Min Memory Reservation: 172.22.0.11:27000(1.07 GB)
    Per Host Number of Fragment Instances: 172.22.0.11:27000(24)
    Admission result: Admitted immediately
    Cluster Memory Admitted: 8.51 GB
    Executor Group: default
    Query Compilation: 23.923ms
       - Metadata of all 4 tables cached: 9.454ms (9.454ms)
       - Analysis finished: 15.354ms (5.900ms)
       - Authorization finished (noop): 15.393ms (39.181us)
       - Value transfer graph computed: 15.683ms (290.036us)
       - Single node plan created: 19.031ms (3.347ms)
       - Runtime filters computed: 20.664ms (1.632ms)
       - Distributed plan created: 20.710ms (46.366us)
       - Parallel plans created: 20.761ms (50.311us)
       - Planning finished: 23.923ms (3.162ms)
    Query Timeline: 127.023ms
       - Query submitted: 30.030us (30.030us)
       - Planning finished: 25.914ms (25.884ms)
       - Submit for admission: 26.110ms (196.571us)
       - Completed admission: 26.759ms (648.916us)
       - Ready to start on 1 backends: 27.204ms (444.470us)
       - Execution error: 28.898ms (1.693ms)
       - Released admission control resources: 29.015ms (116.989us)
       - Rows available: 29.144ms (129.042us)
       - Unregister query: 127.023ms (97.879ms)
     - AdmissionControlTimeSinceLastUpdate: 11.000ms
     - ComputeScanRangeAssignmentTimer: 242.391us
     - InactiveTotalTime: 0.000ns
     - TotalTime: 0.000ns
    Frontend:
       - CatalogFetch.ColumnStats.Hits: 181
       - CatalogFetch.ColumnStats.Misses: 0
       - CatalogFetch.ColumnStats.Requests: 181
       - CatalogFetch.ColumnStats.Time: 0
       - CatalogFetch.DatabaseList.Hits: 1
       - CatalogFetch.DatabaseList.Misses: 0
       - CatalogFetch.DatabaseList.Requests: 1
       - CatalogFetch.DatabaseList.Time: 0
       - CatalogFetch.TableList.Hits: 1
       - CatalogFetch.TableList.Misses: 0
       - CatalogFetch.TableList.Requests: 1
       - CatalogFetch.TableList.Time: 0
       - CatalogFetch.Tables.Hits: 4
       - CatalogFetch.Tables.Misses: 0
       - CatalogFetch.Tables.Requests: 4
       - CatalogFetch.Tables.Time: 0
       - InactiveTotalTime: 0.000ns
       - TotalTime: 0.000ns
  ImpalaServer:
     - ClientFetchWaitTimer: 0.000ns
     - InactiveTotalTime: 0.000ns
     - NumRowsFetched: 0 (0)
     - NumRowsFetchedFromCache: 0 (0)
     - RowMaterializationRate: 0
     - RowMaterializationTimer: 0.000ns
     - TotalTime: 0.000ns
  Execution Profile 1742a9d3516ad2cc:70b622c700000000:
    Number of filters: 6
    Filter routing table:
 ID  Src. Node  Tgt. Node(s)  Target type  Partition filter  Pending (Expected)  First arrived  Completed  Enabled  Bloom Size   Est fpp
----------------------------------------------------------------------------------------------------------------------------------------
  3          8             1       REMOTE             false               1 (1)            N/A        N/A     true     MIN_MAX
  2          8             1       REMOTE             false               1 (1)            N/A        N/A     true     1.00 MB         1
  1          9             1       REMOTE             false               1 (1)            N/A        N/A     true     MIN_MAX
  0          9             1       REMOTE             false               1 (1)            N/A        N/A     true     1.00 MB         1
  5          7             0        LOCAL             false               0 (1)            N/A        N/A     true     MIN_MAX
  4          7             0        LOCAL             false               0 (1)            N/A        N/A     true     1.00 MB         1
    Final filter table:
 ID  Src. Node  Tgt. Node(s)  Target type  Partition filter  Pending (Expected)  First arrived  Completed  Enabled  Bloom Size   Est fpp
----------------------------------------------------------------------------------------------------------------------------------------
  3          8             1       REMOTE             false               1 (1)            N/A        N/A     true     MIN_MAX
  2          8             1       REMOTE             false               1 (1)            N/A        N/A     true     1.00 MB         1
  1          9             1       REMOTE             false               1 (1)            N/A        N/A     true     MIN_MAX
  0          9             1       REMOTE             false               1 (1)            N/A        N/A     true     1.00 MB         1
  5          7             0        LOCAL             false               0 (1)            N/A        N/A     true     MIN_MAX
  4          7             0        LOCAL             false               0 (1)            N/A        N/A     true     1.00 MB         1
     - FiltersReceived: 0 (0)
     - FinalizationTimer: 0.000ns
     - InactiveTotalTime: 0.000ns
     - NumBackends: 1 (1)
     - NumCompletedBackends: 0 (0)
     - NumFragmentInstances: 24 (24)
     - NumFragments: 12 (12)
     - TotalTime: 2.231ms
    Per Node Profiles:
       - InactiveTotalTime: 0.000ns
       - TotalTime: 0.000ns
      172.22.0.11:27000:
         - AdmissionSlots: 4 (4)
         - InactiveTotalTime: 0.000ns
         - TotalTime: 0.000ns
    Averaged Fragment F08:
       - InactiveTotalTime: 0.000ns
       - TotalTime: 0.000ns
    Coordinator Fragment F08:
       - InactiveTotalTime: 0.000ns
       - TotalTime: 0.000ns
      Instance 1742a9d3516ad2cc:70b622c700000000 (host=172.22.0.11:27000):
        Last report received time: 2023-01-05 02:14:31.402
         - BytesAssigned: 0
         - InactiveTotalTime: 0.000ns
         - TotalTime: 0.000ns
    Averaged Fragment F07 [2 instances]:
       - InactiveTotalTime: 0.000ns
       - TotalTime: 0.000ns
    Fragment F07:
       - InactiveTotalTime: 0.000ns
       - TotalTime: 0.000ns
      Instance 1742a9d3516ad2cc:70b622c700000003 (host=172.22.0.11:27000):
        Last report received time: 2023-01-05 02:14:31.402
         - BytesAssigned: 0
         - InactiveTotalTime: 0.000ns
         - TotalTime: 0.000ns
      Instance 1742a9d3516ad2cc:70b622c700000004 (host=172.22.0.11:27000):
        Last report received time: 2023-01-05 02:14:31.402
         - BytesAssigned: 0
         - InactiveTotalTime: 0.000ns
         - TotalTime: 0.000ns
    Averaged Fragment F00 [2 instances]:
       - InactiveTotalTime: 0.000ns
       - TotalTime: 0.000ns
    Fragment F00:
       - InactiveTotalTime: 0.000ns
       - TotalTime: 0.000ns
      Instance 1742a9d3516ad2cc:70b622c700000001 (host=172.22.0.11:27000):
        Last report received time: 2023-01-05 02:14:31.402
         - BytesAssigned: 0
         - InactiveTotalTime: 0.000ns
         - TotalTime: 0.000ns
      Instance 1742a9d3516ad2cc:70b622c700000002 (host=172.22.0.11:27000):
        Last report received time: 2023-01-05 02:14:31.402
         - BytesAssigned: 0
         - InactiveTotalTime: 0.000ns
         - TotalTime: 0.000ns
    Averaged Fragment F09:
       - InactiveTotalTime: 0.000ns
       - TotalTime: 0.000ns
    Fragment F09:
       - InactiveTotalTime: 0.000ns
       - TotalTime: 0.000ns
      Instance 1742a9d3516ad2cc:70b622c700000009 (host=172.22.0.11:27000):
        Last report received time: 2023-01-05 02:14:31.402
         - BytesAssigned: 0
         - InactiveTotalTime: 0.000ns
         - TotalTime: 0.000ns
    Averaged Fragment F06 [2 instances]:
       - InactiveTotalTime: 0.000ns
       - TotalTime: 0.000ns
    Fragment F06:
       - InactiveTotalTime: 0.000ns
       - TotalTime: 0.000ns
      Instance 1742a9d3516ad2cc:70b622c700000007 (host=172.22.0.11:27000):
        Last report received time: 2023-01-05 02:14:31.402
         - BytesAssigned: 0
         - InactiveTotalTime: 0.000ns
         - TotalTime: 0.000ns
      Instance 1742a9d3516ad2cc:70b622c700000008 (host=172.22.0.11:27000):
        Last report received time: 2023-01-05 02:14:31.402
         - BytesAssigned: 0
         - InactiveTotalTime: 0.000ns
         - TotalTime: 0.000ns
    Averaged Fragment F05 [2 instances]:
       - InactiveTotalTime: 0.000ns
       - TotalTime: 0.000ns
    Fragment F05:
       - InactiveTotalTime: 0.000ns
       - TotalTime: 0.000ns
      Instance 1742a9d3516ad2cc:70b622c700000005 (host=172.22.0.11:27000):
        Last report received time: 2023-01-05 02:14:31.402
         - BytesAssigned: 0
         - InactiveTotalTime: 0.000ns
         - TotalTime: 0.000ns
      Instance 1742a9d3516ad2cc:70b622c700000006 (host=172.22.0.11:27000):
        Last report received time: 2023-01-05 02:14:31.402
         - BytesAssigned: 0
         - InactiveTotalTime: 0.000ns
         - TotalTime: 0.000ns
    Averaged Fragment F10:
       - InactiveTotalTime: 0.000ns
       - TotalTime: 0.000ns
    Fragment F10:
       - InactiveTotalTime: 0.000ns
       - TotalTime: 0.000ns
      Instance 1742a9d3516ad2cc:70b622c70000000e (host=172.22.0.11:27000):
        Last report received time: 2023-01-05 02:14:31.402
         - BytesAssigned: 0
         - InactiveTotalTime: 0.000ns
         - TotalTime: 0.000ns
    Averaged Fragment F04 [2 instances]:
       - InactiveTotalTime: 0.000ns
       - TotalTime: 0.000ns
    Fragment F04:
       - InactiveTotalTime: 0.000ns
       - TotalTime: 0.000ns
      Instance 1742a9d3516ad2cc:70b622c70000000c (host=172.22.0.11:27000):
        Last report received time: 2023-01-05 02:14:31.402
         - BytesAssigned: 0
         - InactiveTotalTime: 0.000ns
         - TotalTime: 0.000ns
      Instance 1742a9d3516ad2cc:70b622c70000000d (host=172.22.0.11:27000):
        Last report received time: 2023-01-05 02:14:31.402
         - BytesAssigned: 0
         - InactiveTotalTime: 0.000ns
         - TotalTime: 0.000ns
    Averaged Fragment F03 [2 instances]:
       - InactiveTotalTime: 0.000ns
       - TotalTime: 0.000ns
    Fragment F03:
       - InactiveTotalTime: 0.000ns
       - TotalTime: 0.000ns
      Instance 1742a9d3516ad2cc:70b622c70000000a (host=172.22.0.11:27000):
        Last report received time: 2023-01-05 02:14:31.402
         - BytesAssigned: 0
         - InactiveTotalTime: 0.000ns
         - TotalTime: 0.000ns
      Instance 1742a9d3516ad2cc:70b622c70000000b (host=172.22.0.11:27000):
        Last report received time: 2023-01-05 02:14:31.402
         - BytesAssigned: 0
         - InactiveTotalTime: 0.000ns
         - TotalTime: 0.000ns
    Averaged Fragment F11:
       - InactiveTotalTime: 0.000ns
       - TotalTime: 0.000ns
    Fragment F11:
       - InactiveTotalTime: 0.000ns
       - TotalTime: 0.000ns
      Instance 1742a9d3516ad2cc:70b622c700000017 (host=172.22.0.11:27000):
        Last report received time: 2023-01-05 02:14:31.402
         - BytesAssigned: 0
         - InactiveTotalTime: 0.000ns
         - TotalTime: 0.000ns
    Averaged Fragment F02 [4 instances]:
       - InactiveTotalTime: 0.000ns
       - TotalTime: 0.000ns
    Fragment F02:
       - InactiveTotalTime: 0.000ns
       - TotalTime: 0.000ns
      Instance 1742a9d3516ad2cc:70b622c700000013 (host=172.22.0.11:27000):
        Last report received time: 2023-01-05 02:14:31.402
         - BytesAssigned: 0
         - InactiveTotalTime: 0.000ns
         - TotalTime: 0.000ns
      Instance 1742a9d3516ad2cc:70b622c700000014 (host=172.22.0.11:27000):
        Last report received time: 2023-01-05 02:14:31.402
         - BytesAssigned: 0
         - InactiveTotalTime: 0.000ns
         - TotalTime: 0.000ns
      Instance 1742a9d3516ad2cc:70b622c700000015 (host=172.22.0.11:27000):
        Last report received time: 2023-01-05 02:14:31.402
         - BytesAssigned: 0
         - InactiveTotalTime: 0.000ns
         - TotalTime: 0.000ns
      Instance 1742a9d3516ad2cc:70b622c700000016 (host=172.22.0.11:27000):
        Last report received time: 2023-01-05 02:14:31.402
         - BytesAssigned: 0
         - InactiveTotalTime: 0.000ns
         - TotalTime: 0.000ns
    Averaged Fragment F01 [4 instances]:
       - InactiveTotalTime: 0.000ns
       - TotalTime: 0.000ns
    Fragment F01:
       - InactiveTotalTime: 0.000ns
       - TotalTime: 0.000ns
      Instance 1742a9d3516ad2cc:70b622c70000000f (host=172.22.0.11:27000):
        Last report received time: 2023-01-05 02:14:31.402
         - BytesAssigned: 0
         - InactiveTotalTime: 0.000ns
         - TotalTime: 0.000ns
      Instance 1742a9d3516ad2cc:70b622c700000010 (host=172.22.0.11:27000):
        Last report received time: 2023-01-05 02:14:31.402
         - BytesAssigned: 0
         - InactiveTotalTime: 0.000ns
         - TotalTime: 0.000ns
      Instance 1742a9d3516ad2cc:70b622c700000011 (host=172.22.0.11:27000):
        Last report received time: 2023-01-05 02:14:31.402
         - BytesAssigned: 0
         - InactiveTotalTime: 0.000ns
         - TotalTime: 0.000ns
      Instance 1742a9d3516ad2cc:70b622c700000012 (host=172.22.0.11:27000):
        Last report received time: 2023-01-05 02:14:31.402
         - BytesAssigned: 0
         - InactiveTotalTime: 0.000ns
         - TotalTime: 0.000ns
分析过程
(1)在上面的日志中,我们发现如下:
Max Per-Host Resource Reservation: Memory=1.07GB
Threads=24 Per-Host Resource Estimates: Memory=8.51GB
即该主机内存评估为8.51G,但该sql资源只能获取1.07G,导致无法查询
(2)在往下就是一个warinng如下,说该表缺乏统计
WARNING: The following tables are missing relevant table and/or column statistics. default.test__mdm__t_mdm_item_value
其中impala对表的统计信息非常敏感,可以帮助我们实现各种优化,原文如下:
Impala can do better optimization for complex or multi-table queries when it has access to statistics about the volume of data and how the values are distributed. Impala uses this information to help parallelize and distribute the work for a query. For example, optimizing join queries requires a way of determining if one table is "bigger" than another, which is a function of the number of rows and the average row size for each table. The following sections describe the categories of statistics Impala can work with, and how to produce them and keep them up to date.
从上面的问题来看,我们知道impala对于test__mdm__t_mdm_item_value统计不准确,导致评估该表内存过大,sql直接退出,知道问题后,接下来就容易了,对表做统计信息处理
(3)生产统计信息
default > COMPUTE STATS default.test__mdm__t_mdm_item_value;
//生成统计信息
Query: COMPUTE STATS default.test__mdm__t_mdm_item_value
+------------------------------------------+
| summary                                  |
+------------------------------------------+
| Updated 1 partition(s) and 24 column(s). |
+------------------------------------------+
Fetched 1 row(s) in 9.16s
//查看统计信息的生成
default> show table stats  default.test__mdm__t_mdm_item_value;
Query: show table stats  default.test__mdm__t_mdm_item_value
+---------+-------------+----------+--------+------------------+
| #Rows   | #Partitions | Size     | Format | Location         |
+---------+-------------+----------+--------+------------------+
| 2926088 | 60          | 742.19MB | KUDU   | kudu-master:7051 |
+---------+-------------+----------+--------+------------------+
Fetched 1 row(s) in 0.04s

//查看column 统计信息
default> show column stats  default.test__mdm__t_mdm_item_value;
Query: show column stats  default.test__mdm__t_mdm_item_value
+------------------------+-----------+------------------+---------+----------+-------------------+--------+---------+
| Column                 | Type      | #Distinct Values | #Nulls  | Max Size | Avg Size          | #Trues | #Falses |
+------------------------+-----------+------------------+---------+----------+-------------------+--------+---------+
| id                     | STRING    | 2821811          | 0       | 32       | 32                | -1     | -1      |
| kudu_change_time       | TIMESTAMP | 58787            | 0       | 16       | 16                | -1     | -1      |
| kudu_update_time       | TIMESTAMP | 17043            | 0       | 16       | 16                | -1     | -1      |
| kudu_is_deleted        | BOOLEAN   | 2                | 0       | 1        | 1                 | 0      | 2926088 |
| item_id                | STRING    | 77462            | 0       | 36       | 32.02651214599609 | -1     | -1      |
| group_value_id         | STRING    | 735403           | 277     | 32       | 32                | -1     | -1      |
| form_value_id          | STRING    | 212071           | 0       | 49       | 32.00002670288086 | -1     | -1      |
| raw_value              | STRING    | 174919           | 1403335 | 62030    | 15.37378692626953 | -1     | -1      |
| unit_id                | STRING    | 73               | 2924383 | 32       | 23.78709602355957 | -1     | -1      |
| dictionary_entry_id    | STRING    | 2034             | 2830824 | 428      | 25.59265899658203 | -1     | -1      |
| group_id               | STRING    | 26469            | 16180   | 43       | 32.02720260620117 | -1     | -1      |
| form_id                | STRING    | 20445            | 15896   | 32       | 32                | -1     | -1      |
| tenant_id              | STRING    | 147              | 0       | 36       | 28.61221885681152 | -1     | -1      |
| version                | BIGINT    | 206              | 0       | 8        | 8                 | -1     | -1      |
| create_by              | STRING    | 1224             | 175439  | 45       | 30.86287117004395 | -1     | -1      |
| create_time            | TIMESTAMP | 2220653          | 584     | 16       | 16                | -1     | -1      |
| update_by              | STRING    | 1217             | 151318  | 39       | 30.99948310852051 | -1     | -1      |
| update_time            | TIMESTAMP | 2035502          | 0       | 16       | 16                | -1     | -1      |
| is_deleted             | INT       | 2                | 0       | 4        | 4                 | -1     | -1      |
| dictionary_entry_text  | STRING    | 918              | 2851468 | 342      | 12.24979877471924 | -1     | -1      |
| item_name              | STRING    | 5959             | 145501  | 54       | 10.45911979675293 | -1     | -1      |
| unit_text              | STRING    | 30               | 2921182 | 15       | 5.158173561096191 | -1     | -1      |
| raw_value_json         | STRING    | 179212           | 472657  | 60189    | 28.20155334472656 | -1     | -1      |
| last_update_version_no | INT       | 93               | 1809021 | 4        | 4                 | -1     | -1      |
+------------------------+-----------+------------------+---------+----------+-------------------+--------+---------+
Fetched 24 row(s) in 0.01s
Impala performs some optimizations using this metadata on its own, and other optimizations by using a combination of table and column statistics.
有了上面的统计,然后我们在来执行上面一样的sql:
Query submitted at: 2023-01-05 10:51:13 (Coordinator: http://172.22.0.11:25000)
Query progress can be monitored at: http://172.22.0.11:25000/query_plan?query_id=d5493fbec1f733ae:b7373d0c00000000
+--------------------------------------+------
...
...
Fetched 154 row(s) in 3.38s
结果分析
现在sql正常的执行了,接下来查看下query plan
(1)首先是涉及到了4个表
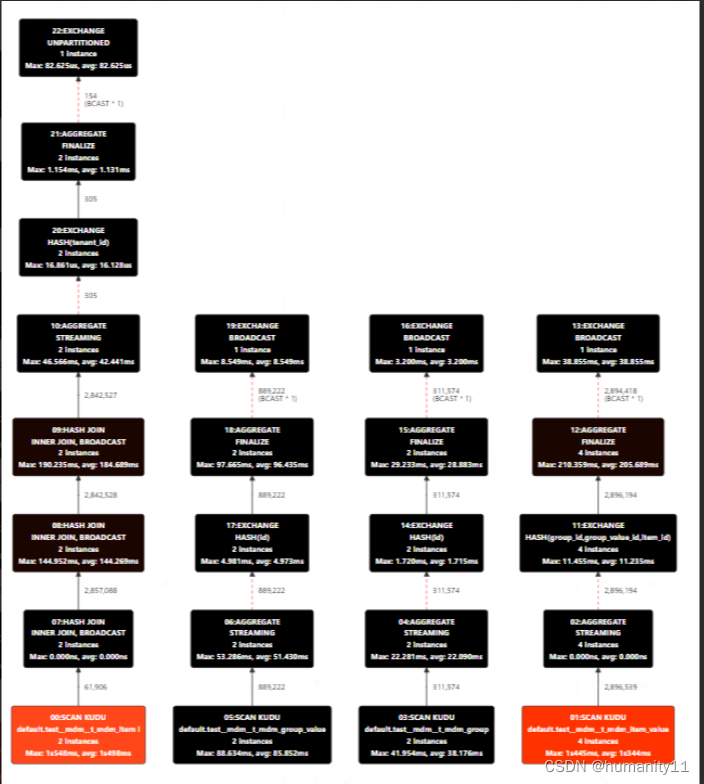
(2)然后看profile、summary
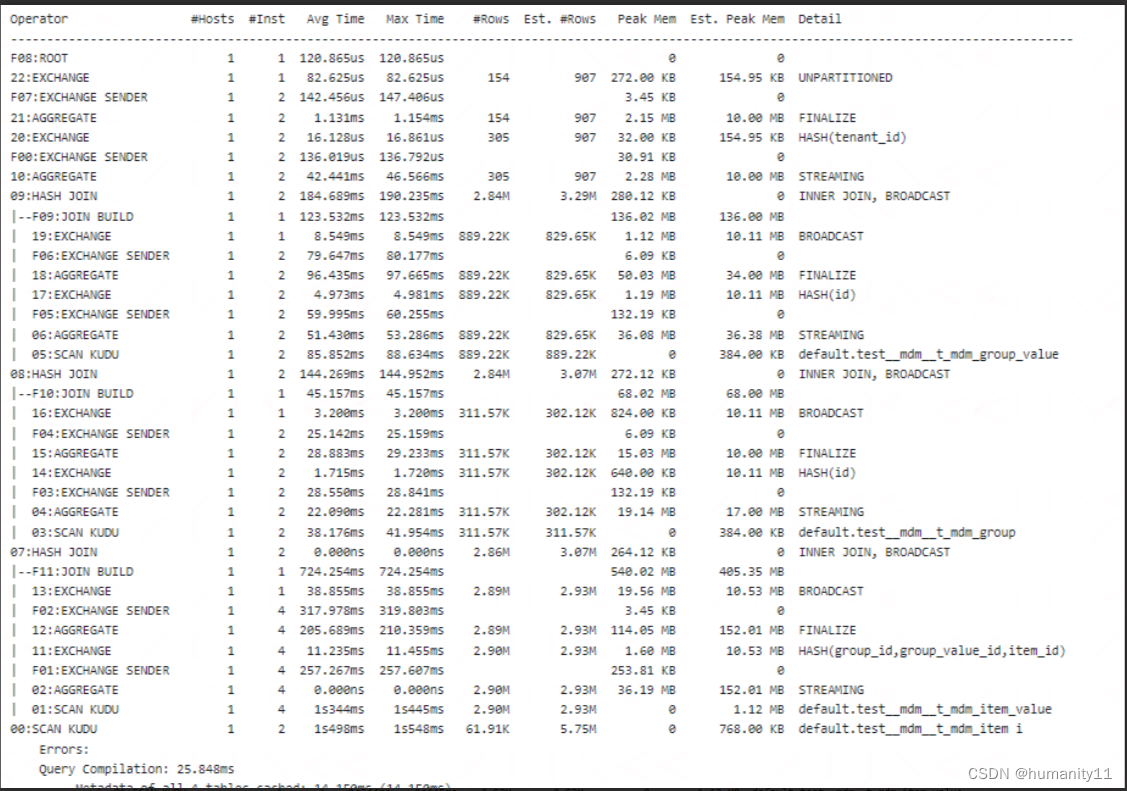
内容有点长,截取一些关键部分,注意看avg_time 与max_time,rows与est_rows,-1表示未获取到统计信息,由于我们对表执行了统计,故评估的rows与实际rows是接近的。
在profile中关键信息:
Max Per-Host Resource Reservation: Memory=812.88MB
Threads=24 Per-Host Resource Estimates: Memory=2.14GB
这时候评估内存从原理的8G变成了2.14G,说明sql执行内存已经评估生效了
(3)sql可以正常执行
此时整个sql完成时间只用了3.18s
总结
Impala performs some optimizations using this metadata on its own, and other optimizations by using a combination of table and column statistics.
COMPUTE STATS is intended to be run periodically, e.g. weekly, or on-demand when the contents of a table have changed significantly
正如上面我们测试的结果那样,周期性的执行表统计对于查询可以极大的提高性能,规避查询失败。考虑执行表统计会占用一定的资源,故建议夜间操作,每2周或一个月使用任务调度方式执行一次即可。