1.修改的样式如下:
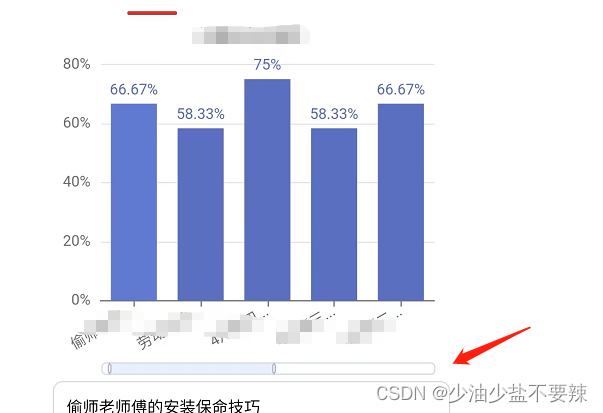
2.相关代码
const myChart = echarts.init(this.$refs.tasksChart)
myChart.setOption({
grid: {
top: '4%',
left: '12%',
right: '4%',
bottom: '23%'
},
xAxis: {
data: xAxisLabel,
axisTick: {
show: true,
alignWithLabel: true
},
boundaryGap: true,
axisLabel: {
hideOverlap: false,
interval: 0,
rotate: 30,
formatter: (value) => {
if (value && value.length > 4) {
return value.slice(0, 4) + '...'
} else {
return value
}
},
fontSize: 12
}
},
yAxis: {
type: 'value',
axisLabel: {
show: true,
interval: 'auto',
formatter: '{value}%'
},
show: true
},
dataZoom: [{
type: 'inside',
start: 0,
end: 50,
zoomLock: true
}, {
type: 'slider',
height: 10,
bottom: 0,
brushSelect: false,
showDetail: false,
showDataShadow: false,
zoomLock: true,
show: true
}],
series: [
{
name: '',
type: 'bar',
data: xAxisValue,
itemStyle: {
color: '#40a9ff',
normal: {
label: {
show: true,
position: 'top',
textStyle: {
color: '#5470c6',
fontSize: 12
},
formatter: '{c}%'
}
}
}
}
]
})



![ruoyi若依 组织架构设计--[ 菜单管理 ]](https://img-blog.csdnimg.cn/3fffdef07a60461fafab48745137f543.png)


