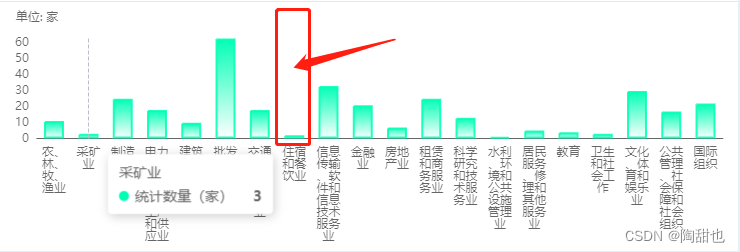
点击红框里的空白区域:
再data里定义的idlist变量:
 idList: [
        800, 300, 500, 400, 800, 300, 500, 400, 800, 300, 500, 400, 800, 300,
        500, 400, 800, 300, 500, 400,
      ]

//以下是js代码

     var chartDom = document.getElementById('echartsOne')
      this.myChart = echarts.init(chartDom)

      this.option = {
        // 提示牌
        tooltip: {
          confine: true, //是否将 tooltip 框限制在图表的区域内。
          trigger: 'axis',
          extraCssText: 'z-index:3',
          axisPointer: {
            type: 'line',
            label: {
              backgroundColor: '#283b56'
            }
          }
        },
        xAxis: [
          {
            type: 'category',
            boundaryGap: true,
            data:[
        "农、林、牧、渔业",
        "采矿业",
        "制造业",
        "电力、热力、燃气及水生产和供应业",
        "建筑业",
        "批发和零售业",
        "交通运输、仓储和邮政业",
        "住宿和餐饮业",
        "信息传输、软件和信息技术服务业",
        "金融业",
        "房地产业",
        "租赁和商务服务业",
        "科学研究和技术服务业",
        "水利、环境和公共设施管理业",
        "居民服务、修理和其他服务业",
        "教育",
        "卫生和社会工作",
        "文化、体育和娱乐业",
      ],
            // 设置x轴字体颜色和大小
            axisLabel: {
              textStyle: {
                color: 'rgba(51,51,51, 0.75)',
                fontSize: 12
              },
              interval: 0, //代表显示所有x轴标签显示

              formatter: function(params) {
                var newParamsName = '' // 最终拼接成的字符串
                var paramsNameNumber = params.length // 实际标签的个数
                var provideNumber = 2 // 每行能显示的字的个数
                var rowNumber = Math.ceil(paramsNameNumber / provideNumber) // 换行的话,需要显示几行,向上取整
                /**
                 * 判断标签的个数是否大于规定的个数, 如果大于,则进行换行处理 如果不大于,即等于或小于,就返回原标签
                 */
                // 条件等同于rowNumber>1
                if (paramsNameNumber > provideNumber) {
                  /** 循环每一行,p表示行 */
                  for (var p = 0; p < rowNumber; p++) {
                    var tempStr = '' // 表示每一次截取的字符串
                    var start = p * provideNumber // 开始截取的位置
                    var end = start + provideNumber // 结束截取的位置
                    // 此处特殊处理最后一行的索引值
                    if (p == rowNumber - 1) {
                      // 最后一次不换行
                      tempStr = params.substring(start, paramsNameNumber)
                    } else {
                      // 每一次拼接字符串并换行
                      tempStr = params.substring(start, end) + '\n'
                    }
                    newParamsName += tempStr // 最终拼成的字符串
                  }
                } else {
                  // 将旧标签的值赋给新标签
                  newParamsName = params
                }
                //将最终的字符串返回
                return newParamsName
              }
            },
            axisTick: {
              //x轴刻度线
              show: false
            },
            axisLine: {
              lineStyle: {
                color: 'rgba(51,51,51, 0.75)', //左边线的颜色
                width: '1' //坐标线的宽度
              }
            }
          }
        ],
        yAxis: [
          {
            type: 'value',
            scale: true,
            name: '单位: 家',
            // 设置y轴顶部文字样式
            nameTextStyle: {
              color: 'rgba(51,51,51, 0.75)',
              fontSize: 12
            },
            max: function(value) {
              return Math.ceil(value.max)
            },
            min: 0,
            boundaryGap: [0.2, 0.2],
            // 设置y轴字体颜色和大小
            axisLabel: {
              textStyle: {
                color: 'rgba(51,51,51, 0.75)',
                fontSize: 12
              }
            },
            axisTick: {
              //x轴刻度线
              show: false
            },
            axisLine: {
              //y轴坐标轴,false为隐藏,true为显示
              show: false,
              lineStyle: {
                color: '#1b3b30' //左边线的颜色
                // width: "2", //坐标线的宽度
              }
            },
            // y轴分割线的设置
            splitLine: {
              show: false,
              lineStyle: {
                color: '#1b3b30' //左边线的颜色
                // width: "2", //坐标线的宽度
              }
            }
          }
        ],
        // 改变图表的位置
        grid: {
          top: '15%',
          left: '8%',
          right: '2%',
          bottom: '45%'
        },

        series: [
          // 柱状图
          {
            name:  '统计数量(家)',
            type: 'bar',
            barWidth: 20, //柱图宽度
            itemStyle: {
              normal: {
                barBorderRadius: [0, 0, 0, 0],
                borderColor: 'rgba(0, 255, 181, 0.87)',
                borderWidth: 2,
                // 拐点渐变色
                color: {
                  type: 'linear',
                  x: 0,
                  y: 0,
                  x2: 0,
                  y2: 1,
                  colorStops: [
                    {
                      offset: 0,
                      color: 'rgba(0, 255, 181, 1)' // 0% 处的颜色
                    },
                    {
                      offset: 0.5,
                      color: 'rgba(0, 255, 181, 0.5)' // 0% 处的颜色
                    },
                    {
                      offset: 1,
                      color: 'rgba(0, 255, 181, 0)' // 100% 处的颜色
                    }
                  ],
                  global: false // 缺省为 false
                }
              }
            },
            data:  [
        800, 300, 500, 400, 800, 300, 500, 400, 800, 300, 500, 400, 800, 300,
        500, 400, 800, 300, 500, 400,
      ]
          }
        ]
      }

      this.option && this.myChart.setOption(this.option)
      // 屏幕适配
      window.addEventListener('resize', () => {
        this.myChart.resize()
      })
      //主要的点击代码在这-----------------------------------------------
      this.myChart.getZr().on('click', param => {
        //获取自定义变量barIds的值,barIds要和option的series里自定义的一样
        const pointInPixel = [param.offsetX, param.offsetY]
        if (this.myChart.containPixel('grid', pointInPixel)) {
          const xIndex = this.myChart.convertFromPixel({ seriesIndex: 0 }, [param.offsetX, param.offsetY])[0]
          // console.log(xIndex, 'x轴')
          this.myChart.resize()
          this.firmid = this.idList[xIndex]
          // console.log(xIndex, this.firmid, 'x轴')
          this.getList()
          this.visible = true
        }
      })


