👨🎓个人主页:研学社的博客
💥💥💞💞欢迎来到本博客❤️❤️💥💥
🏆博主优势:🌞🌞🌞博客内容尽量做到思维缜密,逻辑清晰,为了方便读者。
⛳️座右铭:行百里者,半于九十。
📋📋📋本文目录如下:🎁🎁🎁
目录
💥1 概述
📚2 运行结果
🌈3 Matlab代码实现
🎉4 参考文献
💥1 概述
参考文献:

边缘检测是计算机视觉中的一个重要领域,检测噪声图像中的连续边缘是一个难题。自2009年以来,规范粒子群优化(CanPSO)一直用于边缘检测。尽管裸骨PSO(BBPSO)和完全知情粒子群(FIPS)作为PSO的两个知名版本,具有克服噪声的有趣功能,但它们从未应用于噪声图像中的边缘检测。本文在三个版本的PSO中实现了六种不同的静态拓扑和两种动态拓扑,并在基于PSO的边缘检测器中研究了它们在噪声图像中的影响。计算实验表明,在大多数情况下,采用环形拓扑的FIPS优于具有各种静态和动态拓扑的规范和裸骨PSO,并且对噪声的鲁棒性更强。
📚2 运行结果


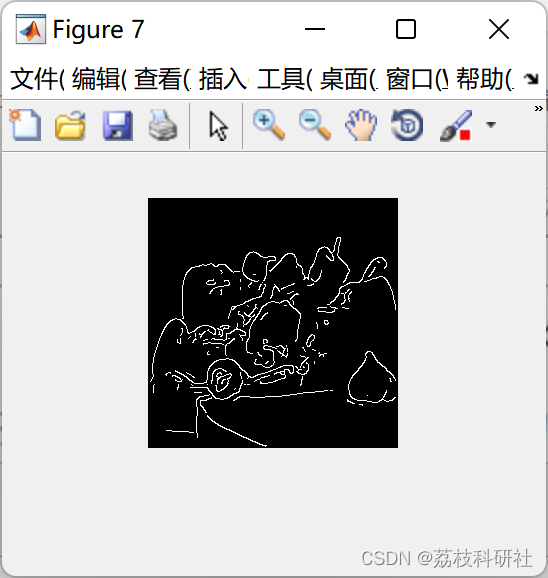
部分代码:
clear all;
close all;
clc;
%Input image
% img = imread ('coins.png');
img = imresize(imread ('peppers.png'),[250 250]);
%Show input image
figure, imshow(img);
img = rgb2gray(img);
img = double (img);
%Value for Thresholding
T_Low = 0.075;
T_High = 0.175;
%Gaussian Filter Coefficient
B = [2, 4, 5, 4, 2; 4, 9, 12, 9, 4;5, 12, 15, 12, 5;4, 9, 12, 9, 4;2, 4, 5, 4, 2 ];
B = 1/159.* B;
%Convolution of image by Gaussian Coefficient
A=conv2(img, B, 'same');
%Filter for horizontal and vertical direction
KGx = [-1, 0, 1; -2, 0, 2; -1, 0, 1];
KGy = [1, 2, 1; 0, 0, 0; -1, -2, -1];
%Convolution by image by horizontal and vertical filter
Filtered_X = conv2(A, KGx, 'same');
Filtered_Y = conv2(A, KGy, 'same');
%Calculate directions/orientations=atan2(Gx,Gy)
arah = atan2 (Filtered_Y, Filtered_X);
arah = arah*180/pi;
pan=size(A,1);
leb=size(A,2);
%Adjustment for negative directions, making all directions positive
for i=1:pan
for j=1:leb
if (arah(i,j)<0)
arah(i,j)=360+arah(i,j);
end;
end;
end;
arah2=zeros(pan, leb);
%Adjusting directions to nearest 0, 45, 90, or 135 degree
for i = 1 : pan
for j = 1 : leb
if ((arah(i, j) >= 0 ) && (arah(i, j) < 22.5) || (arah(i, j) >= 337.5) && (arah(i, j) <= 360))
arah2(i, j) = 0;
elseif ((arah(i, j) >= 22.5) && (arah(i, j) < 67.5))
arah2(i, j) = 45;
elseif ((arah(i, j) >= 67.5 && arah(i, j) < 112.5))
arah2(i, j) = 90;
elseif ((arah(i, j) >= 112.5 && arah(i, j) < 157.5))
arah2(i, j) = 135;
elseif ((arah(i, j) >= 157.5) && (arah(i, j) < 202.5))
arah2(i, j) = 180;
elseif ((arah(i, j) >= 202.5 && arah(i, j) < 247.5))
arah2(i, j) = 225;
elseif ((arah(i, j) >= 247.5 && arah(i, j) < 292.5))
arah2(i, j) = 270;
elseif ((arah(i, j) >= 292.5 && arah(i, j) < 337.5))
arah2(i, j) = 315;
end;
end;
end;
figure, imagesc(arah2); colorbar;title('Gradient direc')
%Calculate magnitude = sqrt(Gx^2+Gy^2)
magnitude = (Filtered_X.^2) + (Filtered_Y.^2);
magnitude2 = sqrt(magnitude);
figure, imshow(uint8(magnitude2));title('Gradient mag')
BW = zeros (pan, leb);
%Non-Maximum Supression
for i=2:pan-1 % mark the strong pixels as 1
for j=2:leb-1
if (arah2(i,j)==0 ||arah2(i,j)==180 )
BW(i,j) = (magnitude2(i,j) == max([magnitude2(i,j), magnitude2(i,j+1), magnitude2(i,j-1)]));
elseif (arah2(i,j)==45 ||arah2(i,j)==225)
BW(i,j) = (magnitude2(i,j) == max([magnitude2(i,j), magnitude2(i+1,j-1), magnitude2(i-1,j+1)]));
elseif (arah2(i,j)==90 ||arah2(i,j)==270)
BW(i,j) = (magnitude2(i,j) == max([magnitude2(i,j), magnitude2(i+1,j), magnitude2(i-1,j)]));
elseif (arah2(i,j)==135 ||arah2(i,j)==315)
BW(i,j) = (magnitude2(i,j) == max([magnitude2(i,j), magnitude2(i+1,j+1), magnitude2(i-1,j-1)]));
end;
end;
end;
BW = BW.*magnitude2; % get the marked pixel '1' values alone
figure, imshow(BW);title('NMS')
%Hysteresis Thresholding
T_Low = T_Low * max(max(BW));
T_High = T_High * max(max(BW));
h1 = @(cx) edgefitness(cx, img, ki, kj);
h2 = @(cx) curve_constraints(cx, ki, kj);
% ga_opts = gaoptimset(ga_opts,'TolFun', 1e-10,'StallGenLimit', 100, 'FitnessLimit', 1e-5,'display','iter');
ga_opts = gaoptimset( 'Generations', 30);
[cx, err_ga] = ga(h1,5,[],[],[],[],[1;1;0;0;0],[8;8;8;8;8],h2,[1 2 3 4 5],ga_opts); %atleast two neighbour per pixel
% 1 2 3
% 4 0 5
% 6 7 8
🌈3 Matlab代码实现
🎉4 参考文献
部分理论来源于网络,如有侵权请联系删除。
[1]"Particle Swarm Optimisation for Edge Detection in Noisy Images, Mahdi Setayesh thesis" and "Effects of Static and Dynamic Topologies in Particle Swarm Optimisation for Edge Detection in Noisy Images"
Effects of static and dynamic top... preview & related info | Mendeley


