文章目录
- @[TOC](文章目录)
- 前言
- 数据分离
- 混淆矩阵
- 實戰
- 總結
文章目录
- @[TOC](文章目录)
- 前言
- 数据分离
- 混淆矩阵
- 實戰
- 總結
前言
例如:随着人工智能的不断发展,机器学习这门技术也越来越重要,很多人都开启了学习机器学习,本文就介绍了机器学习的基础内容之数据分离与混淆矩阵。
数据分离
前面我们讲过的实例基本流程都是这样的:
数据载入→数据可视化与预处理→模型创建→全数据用于模型训练→模型评估
按照这个流程的前提是我们要有新数据来作为测试数据供我们使用,那么如果我们没有新数据用于模型评估表现怎么办呢?这时就需要用到数据分离了。
简单来说数据分离就是对全数据进行数据分离,部分数据用来训练,部分数据用于新数据的结果预测。一般就是二八分還是三七分吧
通常来说分为3步:

小例
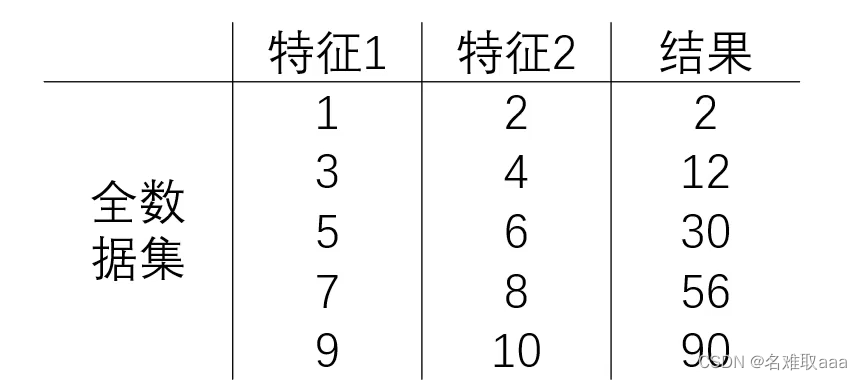
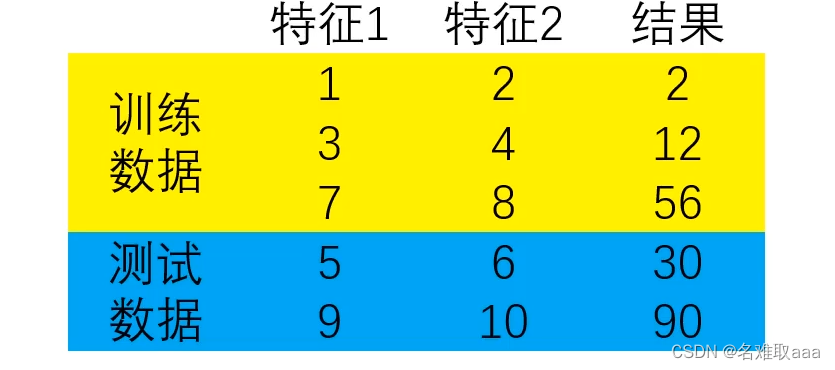
这里就是将3个数据作为训练数据,两个数据作为测试数据。
混淆矩阵
在我们前面的分类任务中,都是计算测试数据集预测准确率(accuracy)以评估模型表现,但如果只用accuracy会有很大的局限性。

举个例子:

如果建立模型如模型1所示,预测准确率就为90%;但如果模型如模型2所示,预测所有的样本结果都是1,也就是说按这个模型无论测试数据是什么,结果都为1,这样就会导致无论数据怎样,我的准确率都是90%,这时得到的准确率就是空准确率。

这就是只用accuracy的局限性,即我们不知道各类型数据的预测情况,就拿上例来说,我们不知道0中预测准确率是多少,也不知道1中预测准确率是多少,我们只知道整体准确率是90%。同时,我们也无法看出模型错误预测的类型,我们并不知道是0预测不对还是1预测不对,这样会给我们优化模型带来很多不便。
所以,为了更好地评估模型,我们可以用混淆矩阵。
混淆矩阵:又称为误差矩阵,用于衡量分类算法的准确程度
具体的混淆矩阵如下图所示:


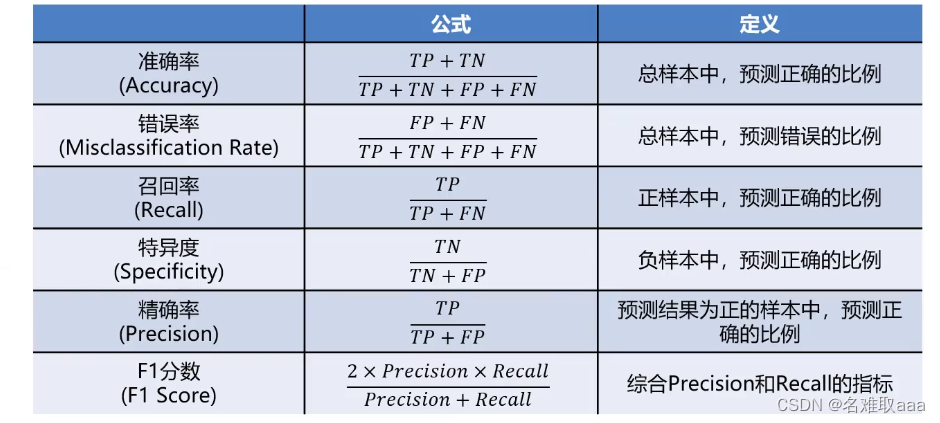
另外,通过混淆矩阵可以计算更丰富的模型评估指标:
举个例子:
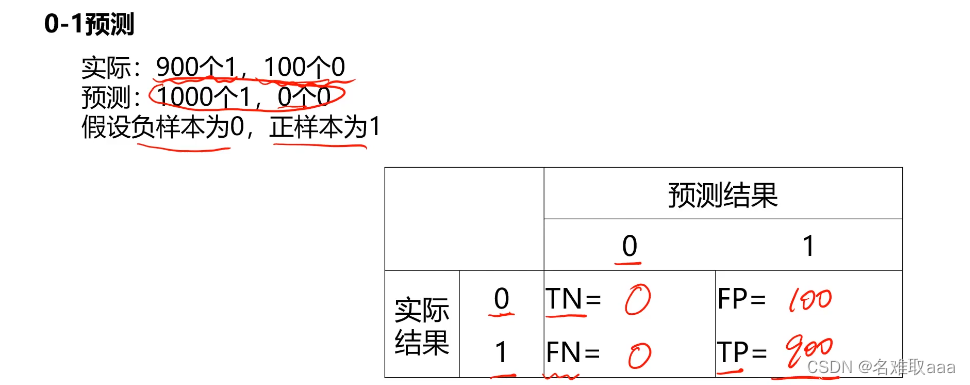
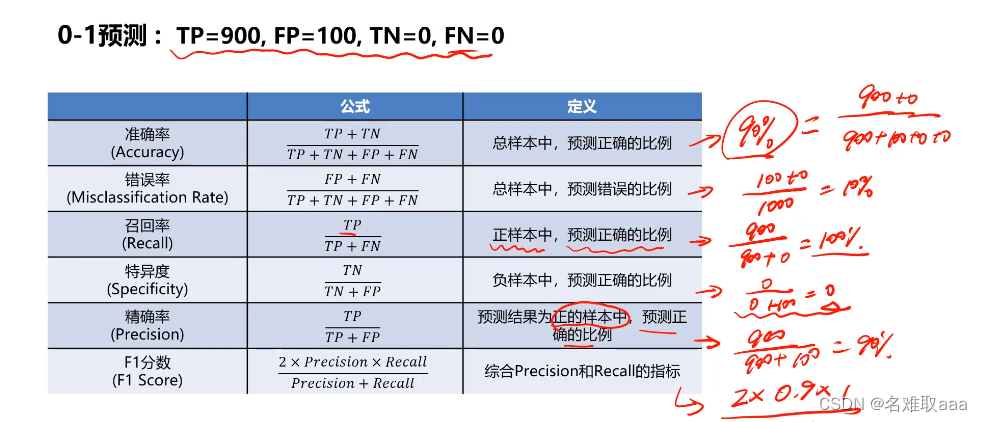
这时我们可以发现负样本中预测正确的比例为0,我们就可以清楚地知道这个指标的预测是有问题的,进而可以修改优化我们的模型。

在这些指标中没有说谁更重要、谁不重要,其重要度取决于应用场景
以上課件來自慕課
實戰
好壞質檢分類實戰task:
- 基於data_class_raw.csv數據,根據高斯分佈概率密度函數,尋找異常點並剔除
- 基於data_class_processed.csv數據,進行PCA處理,確定重要數據維度及成分
- 完成數據分離,數據分離參數:random_state=4,test_size=0.4
- 建立KNN模型完成分類,n_beighbors取10,計算分類準確率,可視化分類邊界
- 計算測試數據集對應的混淆矩陣,計算準確率、召回率、特異度、精確率、F1分數
- 嘗試不同的n_neighbors(1-20),計算其在訓練數據集、測試數據集上的準確率並作圖
#load the data
import pandas as pd
import numpy as np
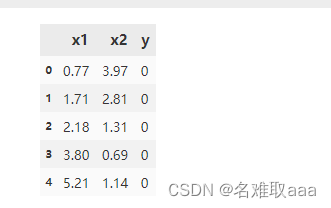
data = pd.read_csv('data_class_raw.csv')
data.head()
#define X and y
X = data.drop(['y'],axis=1)
y = data.loc[:,'y']

#visualize the data
from matplotlib import pyplot as plt
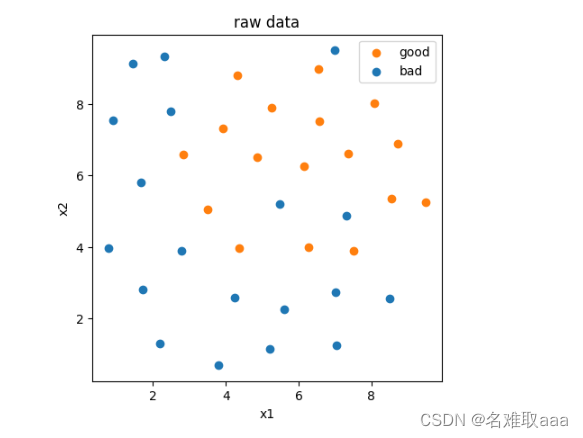
fig1 = plt.figure(figsize=(5,5))
bad = plt.scatter(X.loc[:,'x1'][y==0],X.loc[:,'x2'][y==0])
good = plt.scatter(X.loc[:,'x1'][y==1],X.loc[:,'x2'][y==1])
plt.legend((good,bad),('good','bad'))
plt.title('raw data')
plt.xlabel('x1')
plt.ylabel('x2')
plt.show()
#anomy detection
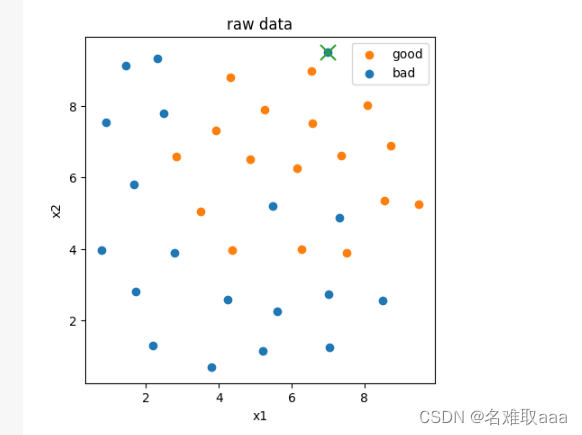
from sklearn.covariance import EllipticEnvelope
ad_model = EllipticEnvelope(contamination=0.02)
ad_model.fit(X[y==0])
y_predict_bad = ad_model.predict(X[y==0])
print(y_predict_bad)
-1為異常點

fig2 = plt.figure(figsize=(5,5))
bad = plt.scatter(X.loc[:,'x1'][y==0],X.loc[:,'x2'][y==0])
good = plt.scatter(X.loc[:,'x1'][y==1],X.loc[:,'x2'][y==1])
plt.scatter(X.loc[:,'x1'][y==0][y_predict_bad==-1],X.loc[:,'x2'][y==0][y_predict_bad==-1],marker='x',s=150)
plt.legend((good,bad),('good','bad'))
plt.title('raw data')
plt.xlabel('x1')
plt.ylabel('x2')
plt.show()
任務二
data = pd.read_csv('data_class_processed.csv')
data.head()
#define X and y
X = data.drop(['y'],axis=1)
y = data.loc[:,'y']
#pca
from sklearn.preprocessing import StandardScaler  #標準化處理
from sklearn.decomposition import PCA
X_norm = StandardScaler().fit_transform(X) #標準化處理
pca = PCA(n_components=2) #二維
X_reduced = pca.fit_transform(X_norm)
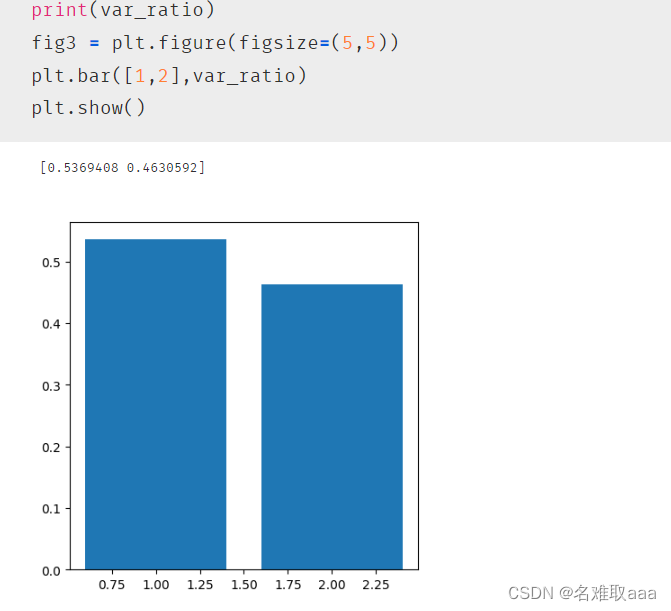
var_ratio = pca.explained_variance_ratio_ #標準差比例
print(var_ratio)
fig3 = plt.figure(figsize=(5,5))
plt.bar([1,2],var_ratio)
plt.show()
可以看出這兩個占比都很大也就沒必要降維了
# train and test split: random_state=4,test_size=0.4
from sklearn.model_selection import train_test_split #數據分離
X_train,X_test,y_train,y_test = train_test_split(X,y,random_state=4,test_size=0.4)
print(X_train.shape,X_test.shape,X.shape) #看一下訓練數據、測試數據占原始數據的多少
數據分離

#knn model
from sklearn.neighbors import KNeighborsClassifier
knn_10 = KNeighborsClassifier(n_neighbors=10)
knn_10.fit(X_train,y_train)
y_train_predict = knn_10.predict(X_train)
y_test_predict = knn_10.predict(X_test)

#calculate the accuracy
from sklearn.metrics import accuracy_score
accuracy_train = accuracy_score(y_train,y_train_predict)
accuracy_test = accuracy_score(y_test,y_test_predict)
print("training accuracy:",accuracy_train)
print("testing accuracy:",accuracy_test)
可以看出訓練數據準確率還可以,測試數據的不太行

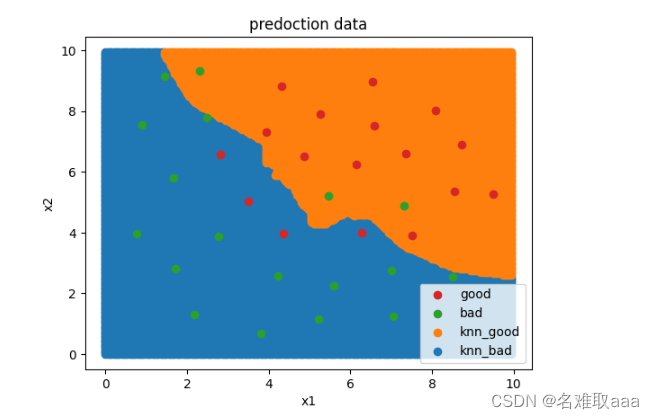
#visualize the knn result and boundary
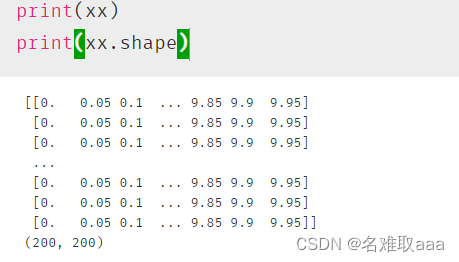
xx, yy = np.meshgrid(np.arange(0,10,0.05),np.arange(0,10,0.05)) #生成0-10間隔0.05的數據
print(xx)
print(xx.shape)
生成佈滿整個圖的點,主要是爲了畫出分類邊界
x_range = np.c_[xx.ravel(),yy.ravel()]
print(x_range.shape)
y_range_predict = knn_10.predict(x_range)

fig4 = plt.figure()
knn_bad = plt.scatter(x_range[:,0][y_range_predict==0],x_range[:,1][y_range_predict==0])
knn_good = plt.scatter(x_range[:,0][y_range_predict==1],x_range[:,1][y_range_predict==1])

bad = plt.scatter(X.loc[:,'x1'][y==0],X.loc[:,'x2'][y==0])
good = plt.scatter(X.loc[:,'x1'][y==1],X.loc[:,'x2'][y==1])
plt.legend((good,bad,knn_good,knn_bad),('good','bad','knn_good','knn_bad'))
plt.title('predoction data')
plt.xlabel('x1')
plt.ylabel('x2')
plt.show()
from sklearn.metrics import confusion_matrix
cm = confusion_matrix(y_test,y_test_predict) #混淆矩陣
print(cm)
直接用sklearn裏面包生成混淆矩陣

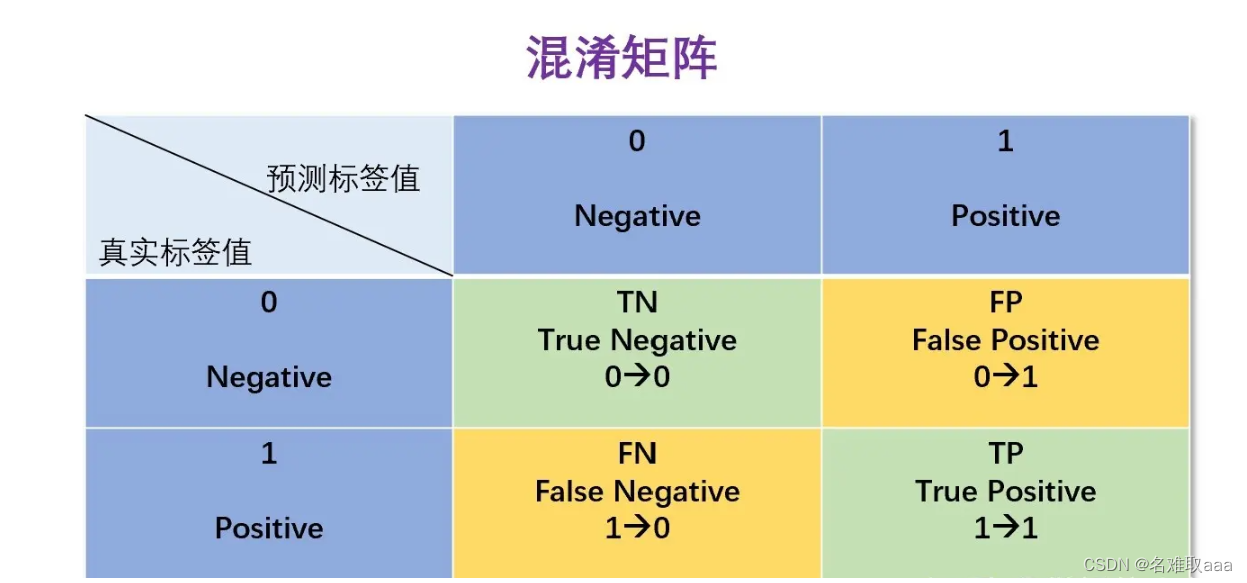
TN = cm[0,0]
FP = cm[0,1]
FN = cm[1,0]
TP = cm[1,1]
print(TN,FP,FN,TP)

算一下各種指標
accuaracy = (TP + TN)/(TP + TN + FP + FN)
print(accuaracy)
可以看出這個跟上面算的是一樣的

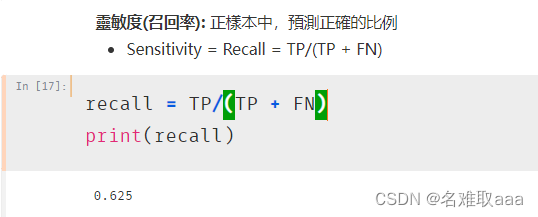
recall = TP/(TP + FN)
print(recall)
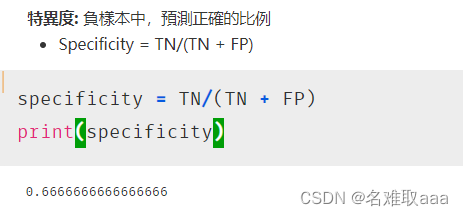
specificity = TN/(TN + FP)
print(specificity)
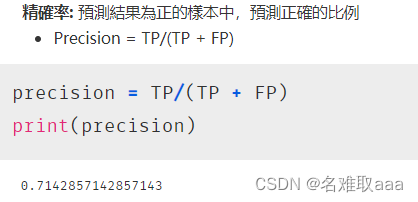
precision = TP/(TP + FP)
print(precision)
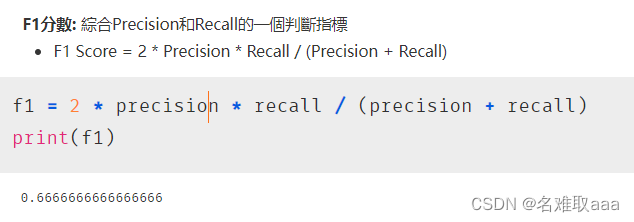
f1 = 2 * precision * recall / (precision + recall)
print(f1)
#try different k and calcualte the accuracy for each
n = [i for i in range(1,21)]
accuaracy_train = []
accuaracy_test = []
for i in n:
    knn = KNeighborsClassifier(n_neighbors=i)
    knn.fit(X_train,y_train)
    y_train_predict = knn.predict(X_train)
    y_test_predict = knn.predict(X_test)
    accuaracy_train_i = accuracy_score(y_train,y_train_predict)
    accuaracy_test_i = accuracy_score(y_test,y_test_predict)
    accuaracy_train.append(accuaracy_train_i)
    accuaracy_test.append(accuaracy_test_i)
print(accuaracy_train,accuaracy_test)
嘗試不同的n_neighbors(1-20),計算其在訓練數據集、測試數據集上的準確率並作圖

fig5 = plt.figure(figsize=(15,5))
plt.subplot(121)
plt.plot(n,accuaracy_train,marker='o')
plt.title('training accuracy vs n_neighbors')
plt.xlabel('n_neighbors')
plt.ylabel('accuaracy')
plt.subplot(122)
plt.plot(n,accuaracy_test,marker='o')
plt.title('testing accuracy vs n_neighbors')
plt.xlabel('n_neighbors')
plt.ylabel('accuaracy')

plt.show()
可視化看一下
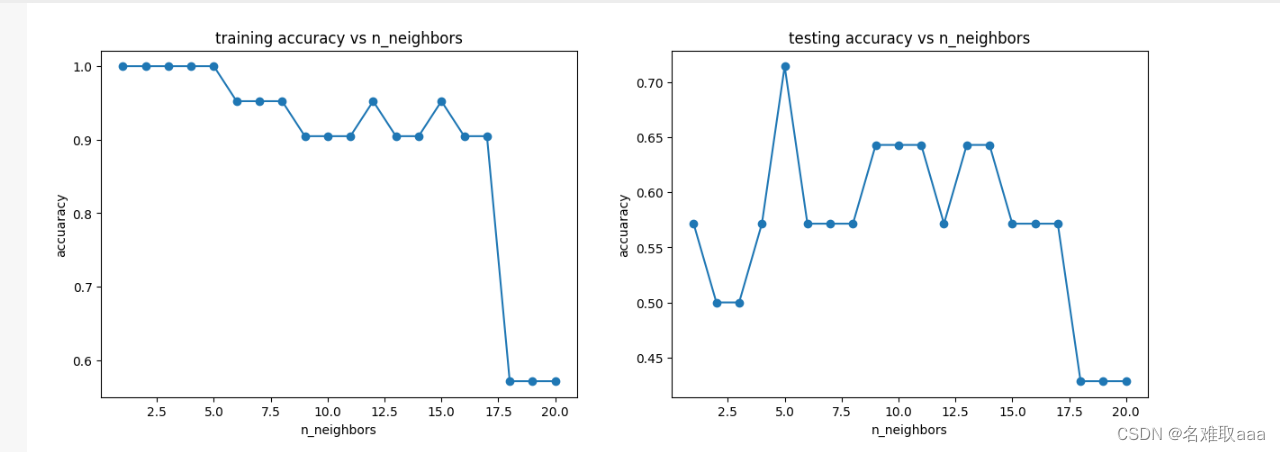
可以看出n_neighbors值在20時效果最差,n_neighbors小時訓練數據效果好測試數據效果差,總體來説n_neighbors值和準確率並沒有很有規律,還是得多嘗試才知道n_neighbors取什麽好
總結
好壞質檢分類實戰summary:
- 通過進行異常監測,幫助找到了潛在的異常數據點
- 通過PCA分析,發現需要保留2維數據集
- 實現了訓練數據與測試數據的分離,並計算模型對於測試數據的預測準確率
- 計算得到混淆矩陣,實現模型更全面的評估
- 通過新的方法,可視化分類的決策邊界
- 通過調整核心參數n_neighbors值(K值),在計算對應的準確率,可以幫助我們更好的確定使用哪個模型
- 核心算法参考链接:
- https://scikit-learn.org.cn/view/695.html
- https://scikit-learn.org/stable/modules/generated/sklearn.neighbors.KNeighborsClassifier.html#sklearn.neighbors.KNeighborsClassifier
這就是本次學習数据分离与混淆矩阵的筆記
附上本次實戰的數據集和源碼:
鏈接:https://github.com/fbozhang/python/tree/master/jupyter


![[安装] HIVE搭建环境](https://img-blog.csdnimg.cn/img_convert/2adc1ff23d4870c9df29f488d7610241.png)
![[rsync] 基于rsync的同步](https://img-blog.csdnimg.cn/e4476499a5df447b80521f4cb78d1912.png)



![[附源码]计算机毕业设计快转二手品牌包在线交易系统Springboot程序](https://img-blog.csdnimg.cn/ac654804a52042d282dfd81f1dbdf63d.png)
