在【机器学习6】和【机器学习9】中,我们使用 TensorFlow 进行了“线性回归模型”和“组合特征”编程实践。本质上,其中采用的都是回归模型,也就是说,我们创建了产生浮点预测的模型,比如“这个社区的房子要花 N 千美元。” 在本篇,我们将创建并评估一个二进制分类模型。
学习目标:
- 将回归问题转换为分类问题。
- 修改分类阈值并确定该修改对模型有什么影响。
- 尝试使用不同的分类指标来确定模型的有效性。
数据集:与【机器学习9】一样,编程练习中也使用加州住房数据集。
目录
1.导入依赖模块
2.载入数据集
3.数据归一化(Normalize values)
4.创建二进制标签
5.将特征表示为输入图层
6.定义构建和训练模型的函数
7.定义打印函数
8.调用创建、训练和绘图函数
9.任务一
10.任务二:添加精确度和召回率作为衡量标准
11.任务三:试验分类阈值
12.任务四:总结模型性能(如果时间允许)
13.参考文献
1.导入依赖模块
import numpy as np
import pandas as pd
import tensorflow as tf
from tensorflow.keras import layers
from matplotlib import pyplot as plt

# The following lines adjust the granularity of reporting.
pd.options.display.max_rows = 10
pd.options.display.float_format = "{:.1f}".format
# tf.keras.backend.set_floatx('float32')

print("Ran the import statements.")
2.载入数据集
本案例中采用的数据集原始地址为如下:
- 训练数据:https://download.mlcc.google.com/mledu-datasets/california_housing_train.csv
- 测试数据:https://download.mlcc.google.com/mledu-datasets/california_housing_test.csv
我们需要将上述数据下载到本地,然后将其路径(数据文件在你电脑的实际路径)写入代码中,如下代码所示:
# 载入数据集
train_df = pd.read_csv("/Users/shulan/Downloads/california_housing_train.csv")
test_df = pd.read_csv("/Users/shulan/Downloads/california_housing_test.csv")
# 打乱训练数据示例
train_df = train_df.reindex(np.random.permutation(train_df.index))
3.数据归一化(Normalize values)
当创建具有多个特征的模型时,每个特征的值应该覆盖大致相同的范围。例如,如果一个特征的范围从 500 到 100000,而另一个特征范围从 2 到 12,那么模型将很难或不可能训练。因此,在训练之前,需要将特征数据进行规范化(归一化)处理。
以下代码单元通过将每个原始值(包括标签)转换为其 Z 分数来规范数据集。Z 分数是特定原始值与平均值之间的标准偏差数。假设数据集满足如下要求:
- 平均值为 60。
- 标准偏差为 10。
那么,原始值 75 的 Z 分数为 +1.5:Z分数=(75-60)/10=+1.5。原始值 38 的 Z 分数为 -2.2:Z分数=(38-60)/10=-2.2。经过上述处理,我们就实现了对数据的归一化处理。
# 计算训练集中每列的Z分数,并将这些Z分数写入名为 train_df_norm 的新 Panda DataFrame 中。
train_df_mean = train_df.mean()
train_df_std = train_df.std()
train_df_norm = (train_df - train_df_mean) / train_df_std

# 检查规范化训练集的一些值。请注意,大多数Z分数都在-2和+2之间。
train_df_norm.head()

# 计算测试集中每列的Z分数,并将这些Z分数写入名为 test_df_norm 的新 Panda DataFrame 中。
test_df_mean = test_df.mean()
test_df_std = test_df.std()
test_df_norm = (test_df - test_df_mean) / test_df_std
4.创建二进制标签
在分类问题中,每个示例的标签必须是 0 或 1。不幸的是,加州住房数据集中的自然标签median_house_value(房价平均值) 包含 80100 或 85700 等浮点值,而不是 0 和 1,而median_house_value 的归一化处理结果属于 -3 和 +3 之间的浮点值。
因此,我们需要在训练集和测试集中创建一个名为 median_house_value_is_high 的新列。如果median_house_value 高于某个任意值(由阈值定义),则将 median_house_value_is_high 设置为 1。否则,将 median_house_value_is_high 设置为 0。
提示:median_house_value_is_high 列中的单元格必须分别包含 1 和 0,而不是 True 和 False。要将 True 和 False 转换为 1 和 0,可调用 pandas DataFrame 函数 astype(float)。
# 根据加州房价平均值,这里将阈值设置为 265000(房价平均值*75%)。房价中值超过 265000 的每个社区都将被标记为 1,所有其他社区都将标记为 0
threshold = 265000
train_df_norm["median_house_value_is_high"] = (train_df["median_house_value"] > threshold).astype(float)
test_df_norm["median_house_value_is_high"] = (test_df["median_house_value"] > threshold).astype(float)
train_df_norm["median_house_value_is_high"].head(8000)

# 除了上面的方法,我们还可以使用Z分数,而不是根据原始房屋值来选择阈值。
# 例如,以下解决方案使用 +1.0 的 Z 分数作为阈值,这意味着 median_house_value_is_high 中不超过 16% 的值将被标记为 1。
# threshold_in_Z = 1.0
# train_df_norm["median_house_value_is_high"] = (train_df_norm["median_house_value"] > threshold_in_Z).astype(float)
# test_df_norm["median_house_value_is_high"] = (test_df_norm["median_house_value"] > threshold_in_Z).astype(float)
5.将特征表示为输入图层
如下代码单元指定了最终训练模型所用的输入特征: median_income 和 total_rooms。这些 Input对象被实例化为 Keras 张量。
inputs = {
# Features used to train the model on.
  'median_income': tf.keras.Input(shape=(1,)),
  'total_rooms': tf.keras.Input(shape=(1,))
}
6.定义构建和训练模型的函数
以下代码单元中,定义了两个函数:
- create_model(...),它定义了模型的拓扑结构。
- train_model(...),使用输入特征和标签来训练模型。
先前的练习使用 ReLU 作为激活函数。相比之下,这个练习使用 sigmoid 作为激活函数。
# 定义模型创建函数
def create_model(my_inputs, my_learning_rate, METRICS):
    # 使用连接层将输入层连接到单个张量中。作为致密层的输入。例如:[input_1[0][0],input_2[0][0]
    concatenated_inputs = tf.keras.layers.Concatenate()(my_inputs.values())
    dense = layers.Dense(units=1, input_shape=(1,), name='dense_layer', activation=tf.sigmoid)
    dense_output = dense(concatenated_inputs)
    """创建并编译一个简单的分类模型."""
    my_outputs = {
        'dense': dense_output,
    }
    model = tf.keras.Model(inputs=my_inputs, outputs=my_outputs)

    # 调用compile方法将层构造为TensorFlow可以执行的模型。注意,这里使用的损失函数(sigmoid)与在回归中使用的(ReLU)不同。
    model.compile(optimizer=tf.keras.optimizers.experimental.RMSprop(learning_rate=my_learning_rate),
                  loss=tf.keras.losses.BinaryCrossentropy(),
                  metrics=METRICS)
    return model


# 定义模型训练函数
def train_model(model, dataset, epochs, label_name,
                batch_size=None, shuffle=True):
    """将数据集输入到模型中以便对其进行训练."""

    # tf.keras.Model.fit的x参数可以是数组列表,其中每个数组包含一个特征的数据。
    # 在这里,我们传递数据集中的每一列。注意,feature_layer将过滤掉这些列中的大部分,只留下所需的列及其表示形式作为特征。
    features = {name: np.array(value) for name, value in dataset.items()}
    label = np.array(features.pop(label_name))
    history = model.fit(x=features, y=label, batch_size=batch_size,
                        epochs=epochs, shuffle=shuffle)

    # 将轮次列表与历史的其余部分分开存储
    epochs = history.epoch

    # 隔离每个轮次的分类结果
    hist = pd.DataFrame(history.history)

    return epochs, hist
7.定义打印函数
为了便于评估模型效果,我们需要将训练+测试结果可视化。在下面的代码单元中,使用 matplotlib 函数绘制了一条或多条曲线,显示了各种分类指标如何随每个轮次而变化。
# 定义打印函数
def plot_curve(epochs, hist, list_of_metrics):
    """绘制一个或多个分类度量相对于训练轮次的曲线"""

    plt.figure()
    plt.xlabel("Epoch")
    plt.ylabel("Value")

    for m in list_of_metrics:
        x = hist[m]
        plt.plot(epochs[1:], x[1:], label=m)

    plt.legend()


print("Defined the plot_curve function.")
8.调用创建、训练和绘图函数
以下代码单元调用指定超参数,然后调用函数来创建和训练模型,然后绘制结果。
# 指定超参数
learning_rate = 0.001
epochs = 20
batch_size = 100
label_name = "median_house_value_is_high"
classification_threshold = 0.35

# 建立模型将衡量的指标
METRICS = [
    tf.keras.metrics.BinaryAccuracy(name='accuracy',
                                    threshold=classification_threshold),
]

# 建立模型的拓扑
my_model = create_model(inputs, learning_rate, METRICS)
# 基于训练数据训练模型
epochs, hist = train_model(my_model, train_df_norm, epochs,
                           label_name, batch_size)

# 绘制模型准确度指标和训练轮次的关系图
list_of_metrics_to_plot = ['accuracy']

plot_curve(epochs, hist, list_of_metrics_to_plot)
9.任务一
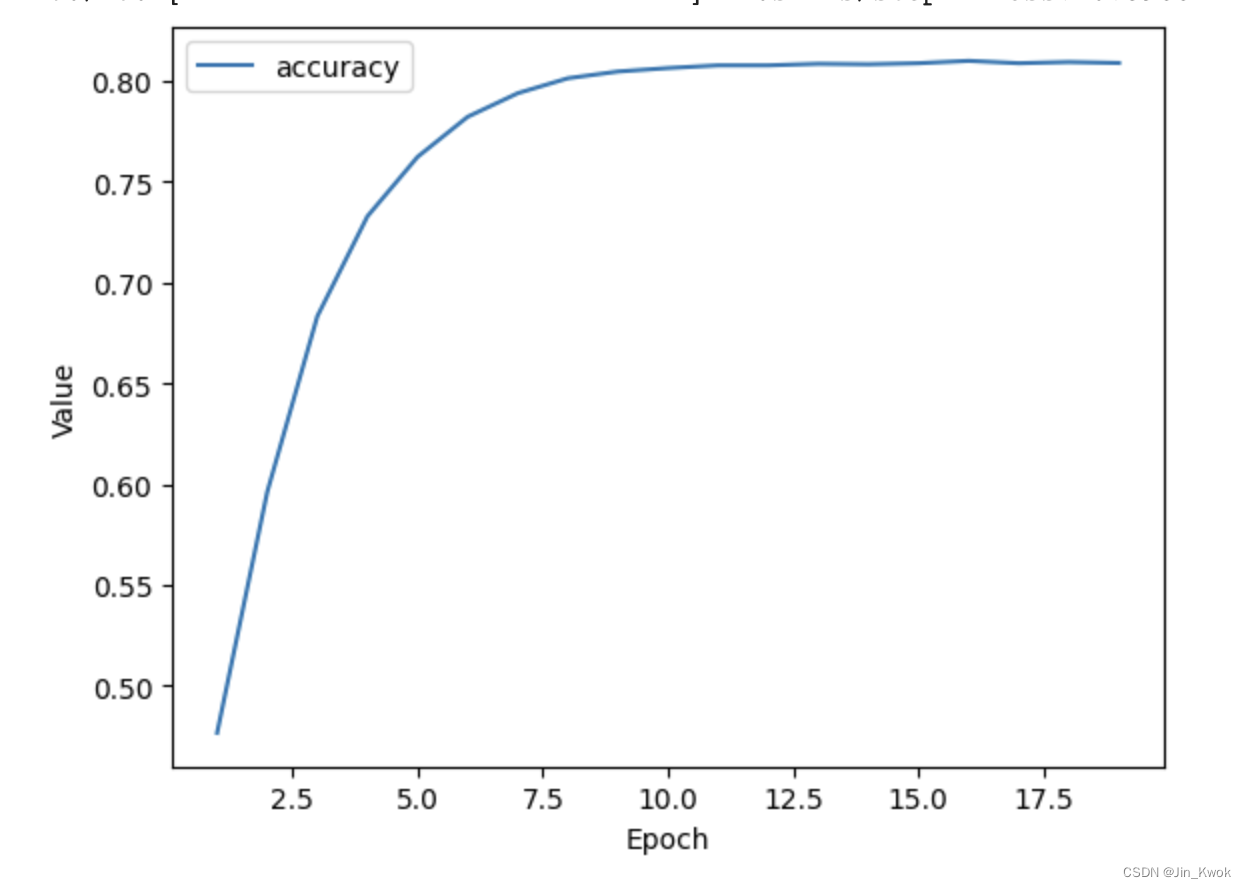
将上面的代码汇总在一起,运行代码,结果如下:从中可以看出,随着训练轮次的增加,模型的准确度(Accuracy)越来越高。关于准确度的定义,在【机器学习12】中有介绍,这里简单回顾一下——对于二元分类,准确率也可以按照正数和负数来计算,如下所示:
其中TP = 真阳性,TN = 真阴性,FP = 假阳性,FN = 假阴性。
10.任务二:添加精确度和召回率作为衡量标准
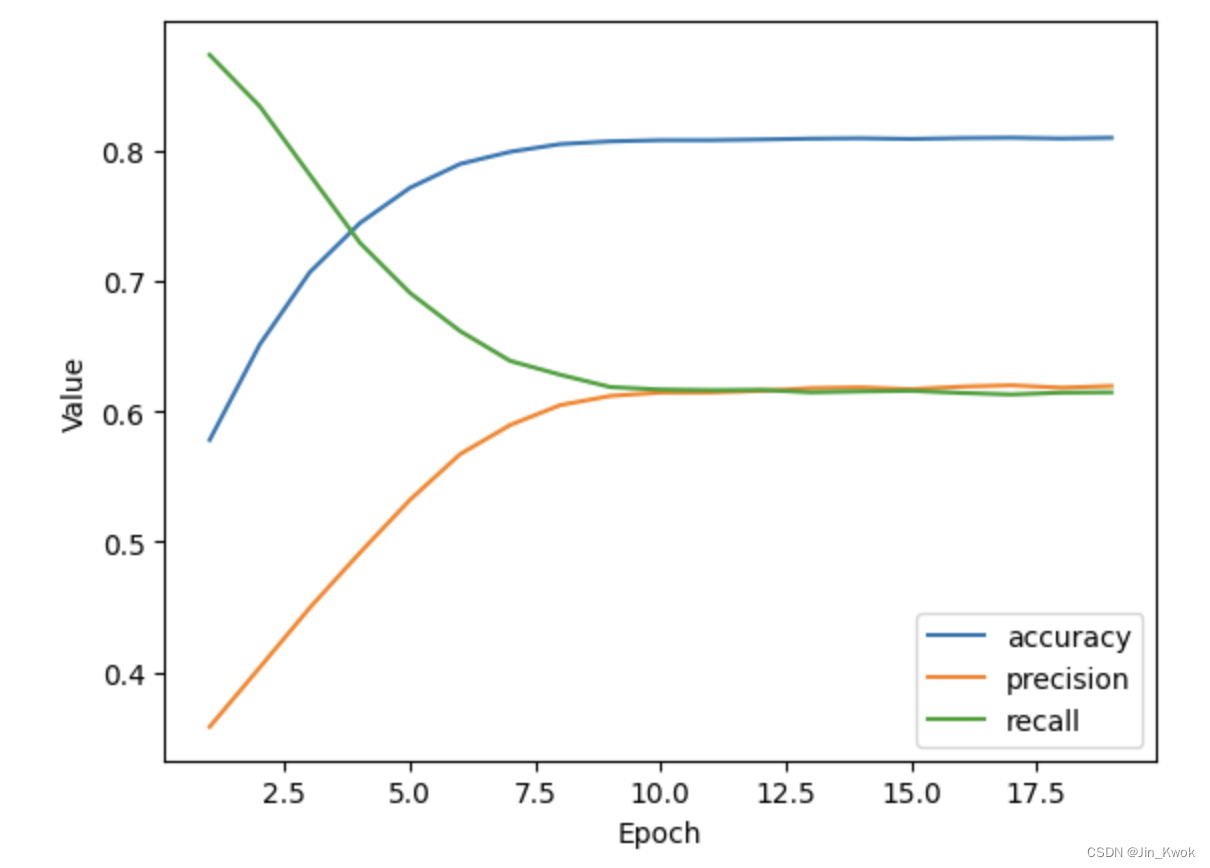
仅仅依靠准确度,尤其是对于类别不平衡的数据集(如我们的数据集),可能无法很好的进行分类。修改上述代码单元中的代码,使模型不仅可以测量准确性,还可以测量精度和召回率。我们增加了准确性和精确性。完整代码如下:
# @title Load the imports

import numpy as np
import pandas as pd
import tensorflow as tf
from tensorflow.keras import layers
from matplotlib import pyplot as plt

# The following lines adjust the granularity of reporting.
pd.options.display.max_rows = 10
pd.options.display.float_format = "{:.1f}".format
# tf.keras.backend.set_floatx('float32')

print("Ran the import statements.")

# 载入数据集
train_df = pd.read_csv("/Users/shulan/Downloads/california_housing_train.csv")
test_df = pd.read_csv("/Users/shulan/Downloads/california_housing_test.csv")
# 打乱训练数据示例
train_df = train_df.reindex(np.random.permutation(train_df.index))

# 计算训练集中每列的Z分数,并将这些Z分数写入名为 train_df_norm 的新 Panda DataFrame 中。
train_df_mean = train_df.mean()
train_df_std = train_df.std()
train_df_norm = (train_df - train_df_mean) / train_df_std

# 检查规范化训练集的一些值。请注意,大多数Z分数都在-2和+2之间。
train_df_norm.head()

# 计算测试集中每列的Z分数,并将这些Z分数写入名为 test_df_norm 的新 Panda DataFrame 中。
test_df_mean = test_df.mean()
test_df_std = test_df.std()
test_df_norm = (test_df - test_df_mean) / test_df_std

# 根据加州房价平均值,这里将阈值设置为 265000(房价平均值*75%)。房价中值超过 265000 的每个社区都将被标记为 1,所有其他社区都将标记为 0
threshold = 265000
train_df_norm["median_house_value_is_high"] = (train_df["median_house_value"] > threshold).astype(float)
test_df_norm["median_house_value_is_high"] = (test_df["median_house_value"] > threshold).astype(float)
train_df_norm["median_house_value_is_high"].head(8000)

# 除了上面的方法,我们还可以使用Z分数,而不是根据原始房屋值来选择阈值。
# 例如,以下解决方案使用 +1.0 的 Z 分数作为阈值,这意味着 median_house_value_is_high 中不超过 16% 的值将被标记为 1。
# threshold_in_Z = 1.0
# train_df_norm["median_house_value_is_high"] = (train_df_norm["median_house_value"] > threshold_in_Z).astype(float)
# test_df_norm["median_house_value_is_high"] = (test_df_norm["median_house_value"] > threshold_in_Z).astype(float)

inputs = {
    # Features used to train the model on.
    'median_income': tf.keras.Input(shape=(1,)),
    'total_rooms': tf.keras.Input(shape=(1,))
}


# 定义模型创建函数
def create_model(my_inputs, my_learning_rate, METRICS):
    # 使用连接层将输入层连接到单个张量中。作为致密层的输入。例如:[input_1[0][0],input_2[0][0]
    concatenated_inputs = tf.keras.layers.Concatenate()(my_inputs.values())
    dense = layers.Dense(units=1, input_shape=(1,), name='dense_layer', activation=tf.sigmoid)
    dense_output = dense(concatenated_inputs)
    """创建并编译一个简单的分类模型."""
    my_outputs = {
        'dense': dense_output,
    }
    model = tf.keras.Model(inputs=my_inputs, outputs=my_outputs)

    # 调用compile方法将层构造为TensorFlow可以执行的模型。注意,这里使用的损失函数(sigmoid)与在回归中使用的(ReLU)不同。
    model.compile(optimizer=tf.keras.optimizers.experimental.RMSprop(learning_rate=my_learning_rate),
                  loss=tf.keras.losses.BinaryCrossentropy(),
                  metrics=METRICS)
    return model


# 定义模型训练函数
def train_model(model, dataset, epochs, label_name,
                batch_size=None, shuffle=True):
    """将数据集输入到模型中以便对其进行训练."""

    # tf.keras.Model.fit的x参数可以是数组列表,其中每个数组包含一个特征的数据。
    # 在这里,我们传递数据集中的每一列。注意,feature_layer将过滤掉这些列中的大部分,只留下所需的列及其表示形式作为特征。
    features = {name: np.array(value) for name, value in dataset.items()}
    label = np.array(features.pop(label_name))
    history = model.fit(x=features, y=label, batch_size=batch_size,
                        epochs=epochs, shuffle=shuffle)

    # 将轮次列表与历史的其余部分分开存储
    epochs = history.epoch

    # 隔离每个轮次的分类结果
    hist = pd.DataFrame(history.history)

    return epochs, hist


print("Defined the create_model and train_model functions.")


# 定义打印函数
def plot_curve(epochs, hist, list_of_metrics):
    """绘制一个或多个分类度量相对于训练轮次的曲线"""

    plt.figure()
    plt.xlabel("Epoch")
    plt.ylabel("Value")

    for m in list_of_metrics:
        x = hist[m]
        plt.plot(epochs[1:], x[1:], label=m)

    plt.legend()


print("Defined the plot_curve function.")

# 指定超参数
learning_rate = 0.001
epochs = 20
batch_size = 100
classification_threshold = 0.35
label_name = "median_house_value_is_high"

# 建立模型将衡量的指标:准确度、精度、召回率
METRICS = [
    tf.keras.metrics.BinaryAccuracy(name='accuracy',
                                    threshold=classification_threshold),
    tf.keras.metrics.Precision(thresholds=classification_threshold,
                               name='precision'
                               ),
    tf.keras.metrics.Recall(thresholds=classification_threshold,
                            name="recall"),
]

# 建立模型的拓扑
my_model = create_model(inputs, learning_rate, METRICS)
# 基于训练数据训练模型
epochs, hist = train_model(my_model, train_df_norm, epochs,
                           label_name, batch_size)

# 绘制模型准确度、精度、召回率指标和训练轮次的关系图
list_of_metrics_to_plot = ['accuracy', "precision", "recall"]
plot_curve(epochs, hist, list_of_metrics_to_plot)

print("\n: Evaluate the new model against the test set:")
执行结果如下所示:
11.任务三:试验分类阈值
在“调用创建、训练和绘图功能”中的代码单元中尝试不同的分类阈值。尝试寻找一个分类阈值,使其产生最高的准确性?经过尝试,我们发现,将其设置为 0.52 时,可以得到较高的准确性。
classification_threshold = 0.52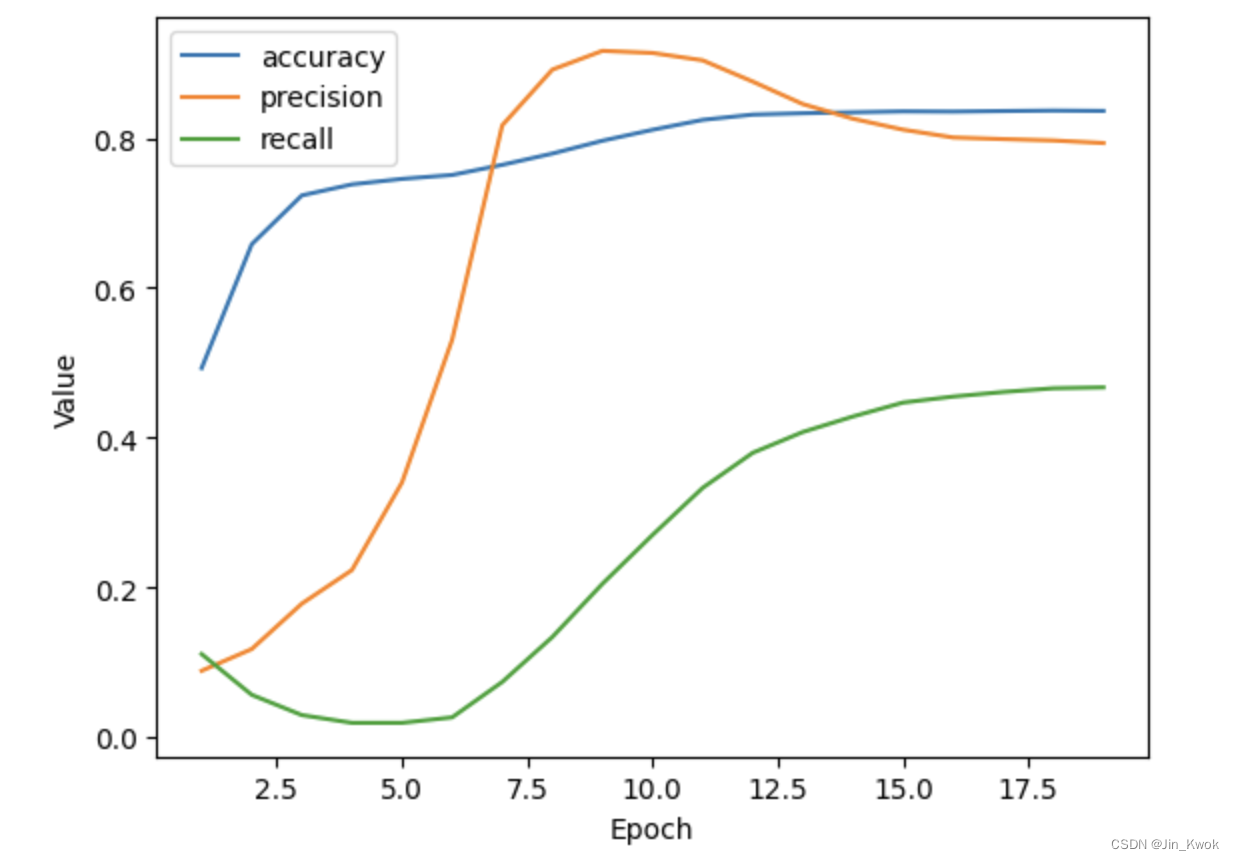
12.任务四:总结模型性能(如果时间允许)
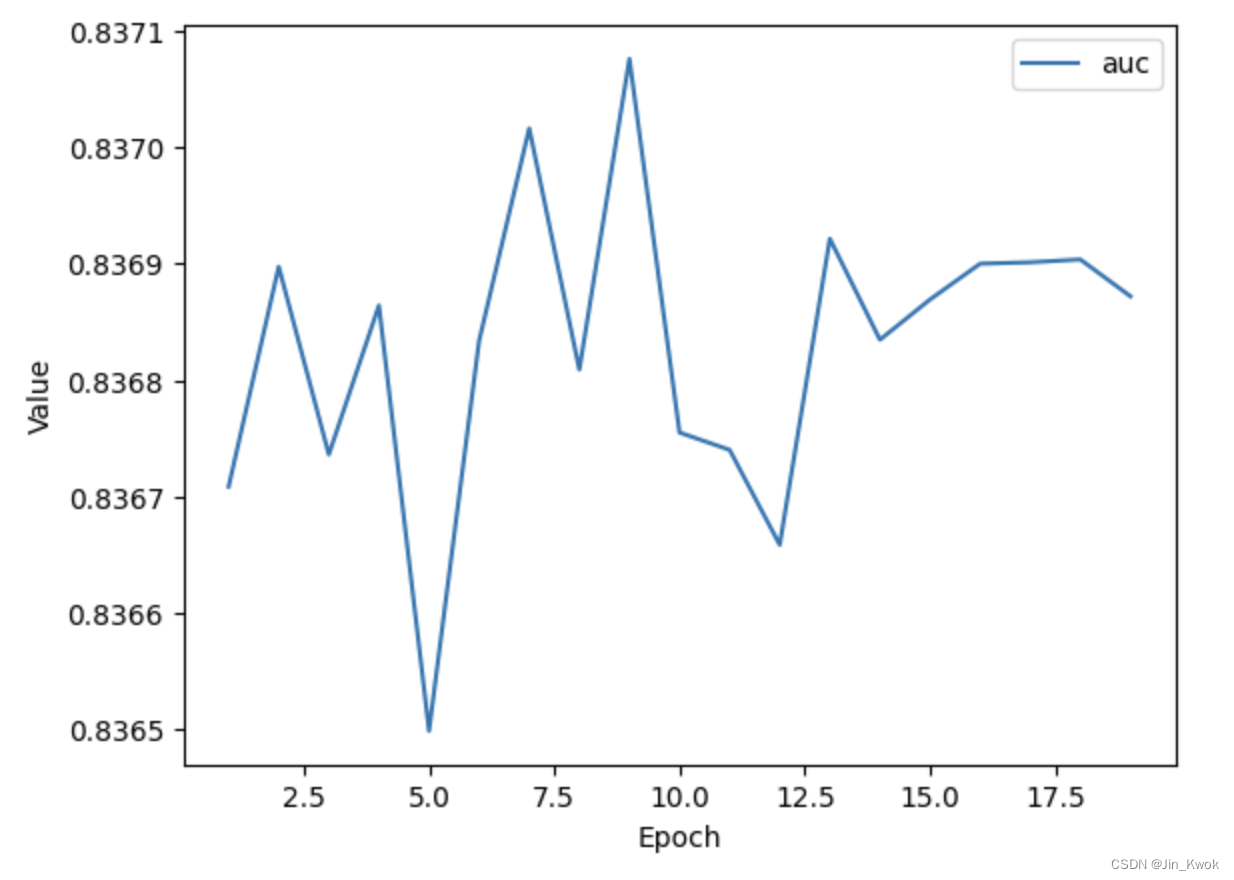
再添加一个指标——AUC,试图总结模型的总体性能。将代码单元换成如下代码:
# 指定超参数
learning_rate = 0.001
epochs = 20
batch_size = 100
label_name = "median_house_value_is_high"

# AUC 作为模型评估指标
METRICS = [
    tf.keras.metrics.AUC(num_thresholds=100, name='auc'),
]

# 创建模型拓扑
my_model = create_model(inputs, learning_rate, METRICS)

# 基于训练数据集训练模型
epochs, hist = train_model(my_model, train_df_norm, epochs,
                           label_name, batch_size)

# 打印AUC与训练轮次的关系图
list_of_metrics_to_plot = ['auc']
plot_curve(epochs, hist, list_of_metrics_to_plot)
运行结果如下所示:
13.参考文献
链接-https://developers.google.cn/machine-learning/crash-course/classification/programming-exercise






![数据结构07:查找[C++][红黑二叉排序树RBT]](https://img-blog.csdnimg.cn/9ff79cfb24c24e3ab0cb282e6b1574fd.png)


