文章目录
- 需求背景
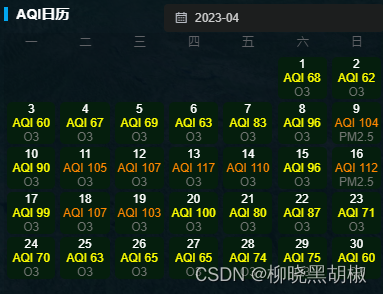
- 解决效果
- 接口地址
- index.vue
- weather.vue
- 图标文件
- 视频效果
需求背景
使用墨迹天气api实现天气预报,空气质量预报功能
解决效果

接口地址
墨迹天气
index.vue
<template>
  <div class="dqhjjc-wrap">
    <div class="first_level_heading">
      <span>大气环境检测</span>
      <el-select v-model="curCity" placeholder="站点类型" size="mini" style="width:130px" @change="getlist">
        <el-option v-for="item in citys" :label="item.label" :value="item.value"></el-option>
      </el-select>
    </div>
    <div class="main-con">
      <weather :sunSetHour="sunSetHour" :sunRiseHour="sunRiseHour" :hourlys="hourlys" :forecasts="forecasts"/>
    </div>
  </div>
</template>
<script>
import Weather from './weather'
import Real from './real'
import SiteAir from './siteAir'
import Wind from './wind'
import qs from 'qs'
import {
  data24hours,
  day15Data,
  aqis
} from './weatherData'

export default {
  name: 'YuxiEnvironmentalDqhjjc',
  components: {
    Weather,
    Real,
    SiteAir,
    Wind
  },
  data() {
    return {
      sunSetHour: 22,//日落小时
      sunRiseHour: 6,//日出小时
      hourlys: [],// 24小时天气数据
      forecasts: [],// 15天天气数据
      headers: {},
      citys: [
        { label: '玉溪市', value: 2851 },
        { label: '江川县', value: 2852 },
        { label: '澄江市', value: 2853 },
        { label: '通海县', value: 2854 },
        { label: '华宁县', value: 2855 },
        { label: '易门县', value: 2856 },
        { label: '峨山彝族自治县', value: 2857 },
        { label: '新平彝族傣族自治县', value: 2858 },
        { label: '元江哈尼族彝族傣族自治县', value: 2859 }
      ],
      curCity: 2851
    }
  },
  methods: {
    getlist() {
      // 天气实况
      fetch('http://aliv18.data.moji.com/whapi/json/alicityweather/condition', {
        method: 'POST',
        headers: this.headers,
        body: qs.stringify({ cityId: this.curCity })
      }).then(response => response.json()).then(res => {
        this.sunSetHour = new Date(res.data.condition.sunSet).getHours()
        this.sunRiseHour = new Date(res.data.condition.sunRise).getHours()
      })
      // 天气预报24小时
      fetch('http://aliv18.data.moji.com/whapi/json/alicityweather/forecast24hours', {
        method: 'POST',
        headers: this.headers,
        body: qs.stringify({ cityId: this.curCity })
      }).then(response => response.json()).then(res => {
        this.hourlys = res.data.hourly
      })
      // 天气预报15天
      fetch('http://aliv18.data.moji.com/whapi/json/alicityweather/forecast15days', {
        method: 'POST',
        headers: this.headers,
        body: qs.stringify({ cityId: this.curCity })
      }).then(response => response.json()).then(res => {
        this.forecasts = res.data.forecast
      })
      // AQI预报5天
      fetch('http://aliv18.data.moji.com/whapi/json/alicityweather/aqiforecast5days', {
        method: 'POST',
        headers: this.headers,
        body: qs.stringify({ cityId: this.curCity })
      }).then(response => response.json()).then(res => {
        // this.forecasts = res.data.forecast
        console.log(res, 3333)
      })
    }
  },
  mounted() {
    this.headers = new Headers()
    this.headers.append('Content-Type', 'application/x-www-form-urlencoded; charset=UTF-8')
    this.headers.append('Authorization', 'APPCODE f70abac0ebcb459588c96c4ec7a8bcad') // 登录凭证
    // this.getlist() // todo 天气接口次数有限
    // 模拟接口
    const self = this
    window.setTimeout(() => {
      self.hourlys = data24hours.data.hourly// 24小时数据
      self.forecasts = day15Data.data.forecast// 15天数据
      self.aqis = aqis.data.data.aqi // 当日aqi数据
    }, 500)
  }
}
</script>
weather.vue
<template>
  <div>
    <div class="wrap">
      <span class="panelSecondTitle">天气预警</span>
      <div class="btn">
        <button
          v-for="item in weatherTypes"
          :key="item.id"
          :class="weatherTypeActiveId === item.id?'select':''"
          @click="weatherTypeActiveId = item.id"
        >
          {{ item.label }}
        </button>
      </div>
    </div>
    <div id="weatherLineChart" :style="{height:weatherTypeActiveId==1?'185px':'230px'}">
      <div v-show="weatherTypeActiveId==1">
        <div class="weather24IconBox">
          <div v-for="(item, index) in weather24Icons" :key="index" class="iconItem">
            <div class="iconImg">
              <img :src="require(`/public/img/weather/${item.icon}.png`)"/>
            </div>
            <div class="iconCon">{{ item.con }}</div>
            <div class="state">良</div>
          </div>
        </div>
        <div id="dqhjjc24WeatherChart" style="width: 1100px;height: 120px"></div>
      </div>
      <div v-show="weatherTypeActiveId!=1">
        <div class="weather15DayBox">
          <div v-for="(item, index) in weather15DayIcons" :key="index" class="iconItem">
            <div class="iconWeek">{{ item.week }}</div>
            <div class="iconDate">{{ item.date }}</div>
            <div class="iconImg">
              <img :src="require(`/public/img/weather/${item.icon}.png`)"/>
            </div>
            <div class="iconCon">{{ item.con }}</div>
          </div>
        </div>
        <div id="dqhjjc15WeatherChart" style="width: 900px;height: 120px"></div>
        <div class="weather15NightBox">
          <div v-for="(item, index) in weather15NightIcons" :key="index" class="iconItem">
            <div class="iconImg">
              <img :src="require(`/public/img/weather/${item.icon}.png`)"/>
            </div>
            <div class="iconCon">{{ item.con }}</div>
          </div>
        </div>
      </div>
    </div>
  </div>
</template>

<script>
import * as echarts from 'echarts'

export default {
  props: ['sunSetHour', 'sunRiseHour', 'hourlys', 'forecasts'],
  data() {
    return {
      weatherTypes: [
        { label: '24小时', id: 1 },
        { label: '15天', id: 2 }
      ],
      weatherTypeActiveId: 1,
      my24Chart: null,
      my15Chart: null,
      weather24Icons: [],
      weather15DayIcons: [],
      weather15NightIcons: []
    }
  },
  watch: {
    hourlys: {
      handler: {
        handler(data) {
          const option = this.my24Chart.getOption()
          option.xAxis[0].data = data.map((item) => item.hour + ':00')
          option.series[0].data = data.map((item) => item.temp)
          this.weather24Icons = data.map((item) => {
            let temp = {}
            temp.con = item.condition
            temp.id = item.hour
            if (
              item.hour < this.sunSetHour &&
              item.hour >= this.sunRiseHour
            ) {
              temp.icon = 'W' + item.iconDay
            } else {
              temp.icon = 'W' + item.iconNight
            }
            return temp
          })
          this.my24Chart.setOption(option)
        }
      }
    },
    forecasts: {
      handler(data) {
        const option = this.my15Chart.getOption()
        option.xAxis[0].data = data.map((item) => item.predictDate.split('-')[1] + '/' + item.predictDate.split('-')[2])
        option.series[0].data = data.map((item) => item.tempDay)
        option.series[1].data = data.map((item) => item.tempNight)
        this.weather15DayIcons = data.map(item => ({
          icon: 'W' + item.conditionIdDay,
          con: item.conditionDay,
          date:
            item.predictDate.split('-')[1] +
            '/' +
            item.predictDate.split('-')[2],
          week: new Date(item.predictDate).format('l')
        }))
        this.weather15NightIcons = data.map(item => ({
          icon: 'W' + item.conditionIdNight,
          con: item.conditionNight
        }))
        this.my15Chart.setOption(option)
      }
    }
  },
  methods: {
    draw24WeatherChart() { // 24小时天气
      let chartDom = document.getElementById('dqhjjc24WeatherChart')
      if (chartDom == null) {
        return
      }
      echarts.dispose(chartDom)
      this.my24Chart = echarts.init(chartDom)
      const option = {
        color: ['#0C65F6', '#00D68A'],
        tooltip: {
          confine: true
        },
        grid: {
          left: '-2%',
          right: '0%',
          top: '17%  ',
          bottom: '5%',
          containLabel: true
        },
        legend: {
          show: false
        },
        xAxis: {
          type: 'category',
          axisLine: {
            lineStyle: {
              color: 'rgba(255,255,255,0.2)'
            }
          },
          interval: 1,
          axisLabel: {
            align: 'center',
            fontSize: 12,
            color: '#fff'
          },
          axisTick: {
            show: false
          },
          splitLine: {
            show: false
          },
          data: ['20:00', '21:00', '22:00', '23:00', '0:00', '1:00', '2:00', '3:00', '4:00', '5:00', '6:00', '7:00', '8:00', '9:00', '10:00', '11:00', '12:00', '13:00', '14:00', '15:00', '16:00', '17:00', '18:00', '19:00', '20:00']
        },
        yAxis: {
          show: false,
          type: 'value'
        },
        series: [
          {
            type: 'line',
            // showSymbol: false,
            smooth: true,
            name: '气温', // 图例对应类别
            data: ['15', '13', '12', '11', '11', '10', '10', '9', '8', '7', '7', '7', '6', '10', '13', '17', '18', '19', '19', '19', '19', '19', '19', '18', '17'], // 纵坐标数据
            areaStyle: {
              color: new echarts.graphic.LinearGradient(0, 0, 0, 1,
                [
                  {
                    offset: 0,
                    color: '#09515a'
                  },
                  {
                    offset: 0.5,
                    color: '#09515a'
                  },
                  {
                    offset: 1,
                    color: 'transparent'
                  }
                ],
                false
              )
            },
            lineStyle: {
              color: '#20b3c8',
              width: 2
            },
            itemStyle: {
              color: '#c3e2fc'
            },
            tooltip: {
              show: true,
              trigger: 'item',
              formatter: '{a}:<br />{c}℃'
            },
            label: {
              show: true,
              position: 'top',
              color: '#fff'

            }
          }
        ]
      }
      option && this.my24Chart.setOption(option)
      this.dragScroll('weatherLineChart')
    },
    draw15WeatherChart() {
      let chartDom = document.getElementById('dqhjjc15WeatherChart')
      if (chartDom == null) {
        return
      }
      echarts.dispose(chartDom)
      this.my15Chart = echarts.init(chartDom)
      const option = {
        grid: {
          left: '-3%',
          right: '0%',
          top: '0%  ',
          bottom: '-29%',
          containLabel: true
        },
        tooltip: {
          trigger: 'axis'
        },
        xAxis: [
          {
            type: 'category',
            data: ['10/09', '10/10', '10/11', '10/12', '10/13', '10/14', '10/15', '10/16', '10/17', '10/18', '10/19', '10/20', '10/21', '10/22', '10/23', '10/24'],
            show: false
          }
        ],
        yAxis: {
          type: 'value',
          show: false
        },
        series: [
          {
            data: ['20', '19', '21', '20', '24', '25', '25', '26', '24', '23', '24', '29', '31', '28', '28', '31'],
            type: 'line'
          },
          {
            data: ['7', '7', '7', '10', '13', '13', '14', '14', '9', '7', '11', '13', '14', '13', '13', '13'],
            type: 'line'
          }
        ]
      }
      option && this.my15Chart.setOption(option)
    },
    dragScroll(moveTarget) {
      const title = document.getElementById(moveTarget)
      let startScrollLeft = 0
      let startX = 0
      let dragging = false
      title.addEventListener('mousedown', function(e) {
        e.stopPropagation()
        startScrollLeft = title.scrollLeft
        startX = e.clientX
        dragging = true
      })

      title.addEventListener('mousemove', function(e) {
        if (dragging) {
          const distance = e.clientX - startX
          title.scrollLeft = startScrollLeft - distance
        }
      })

      title.addEventListener('mouseup', function() {
        dragging = false
      })

      // -----鼠标滑轮滚动-----
      title.addEventListener('wheel', event => {
        event.preventDefault()
        const delta = event.deltaX || event.deltaY
        title.scrollLeft += delta
      })
    }
  },
  mounted() {
    this.draw24WeatherChart()
    this.draw15WeatherChart()
  }
}
</script>

<style lang="scss" scoped>
.wrap {
  display: flex;
  justify-content: space-between;
  /*定义滚动条高宽及背景高宽分别对应横竖滚动条的尺寸*/
  .btn {
    height: 30px;
    border-radius: 5px;
    border: 1px solid rgb(35, 145, 255);
    box-sizing: border-box;
    overflow: hidden;

    > button {
      width: 70px;
      text-align: center;
      line-height: 30px;
      margin: 0;
      padding: 0;
      background-color: transparent;
      border: none;
      color: rgb(35, 145, 255);;

      &.select {
        background: rgb(35, 145, 255);;
        color: #fff;
      }
    }
  }
}

#weatherLineChart {
  width: 100%;
  height: 185px;
  flex-grow: 1;
  overflow-x: auto;
  position: relative;

  &::-webkit-scrollbar {
    width: 0px;
    height: 0px;
  }

  .weather24IconBox, {
    width: 1100px;
    height: calc(100% - 121px);
    display: flex;
    justify-content: space-around;
    overflow: hidden;
    margin-top: 10px;
    user-select: none;

    .iconItem {
      display: flex;
      flex-direction: column;
      align-items: center;
      justify-content: center;
      height: 100%;

      .iconImg {
        width: 25px;
        height: 25px;

        img {
          display: block;
          width: 100%;
          height: 100%;
        }
      }

      .iconCon {
        color: #ffffffde;
        font-size: 14px;
      }

      .state {
        width: 35px;
        margin-top: 2px;
        color: #ffff00;
        text-align: center;
        font-size: 12px;
        border: 1px solid #ffff00;
        border-radius: 5px;
        background: rgba(255, 255, 0, 0.2);
      }
    }
  }

  .weather15DayBox {
    display: flex;
    justify-content: space-between;
    width: 900px;
    height: 64px;
    padding-left: 2px;
    padding-right: 7px;
    margin-top: 10px;
    cursor: move;
    box-sizing: border-box;
    user-select: none;

    .iconItem {
      display: flex;
      flex-direction: column;
      align-items: center;
      justify-content: center;
      height: 100%;

      .iconWeek {
        font-size: 14px;
        color: #ffffffe6;
      }

      .iconDate {
        font-size: 12px;
        color: #ffffff87;
      }

      .iconImg {
        width: 20px;
        height: 20px;

        img {
          width: 100%;
          height: 100%;
        }
      }

      .iconCon {
        color: #ffffffde;
        font-size: 12px;
      }
    }
  }

  .weather15NightBox {
    width: 900px;
    height: calc(100% - 65px - 64px);
    display: flex;
    justify-content: space-between;
    cursor: move;
    box-sizing: border-box;
    padding-left: 12px;
    padding-right: 18px;
    user-select: none;

    .iconItem {
      display: flex;
      flex-direction: column;
      align-items: center;
      justify-content: center;
      height: 100%;

      .iconImg {
        width: 20px;
        height: 20px;

        img {
          width: 100%;
          height: 100%;
        }
      }

      .iconCon {
        color: #ffffffde;
        font-size: 12px;
      }
    }
  }
}
</style>
图标文件
视频效果
天气