今天看到技术群里在讨论echarts中的折线图,有人遇到一个功能就是点击折线要触发点击事件,但是官网上的click点击事件只针对折线的拐点。
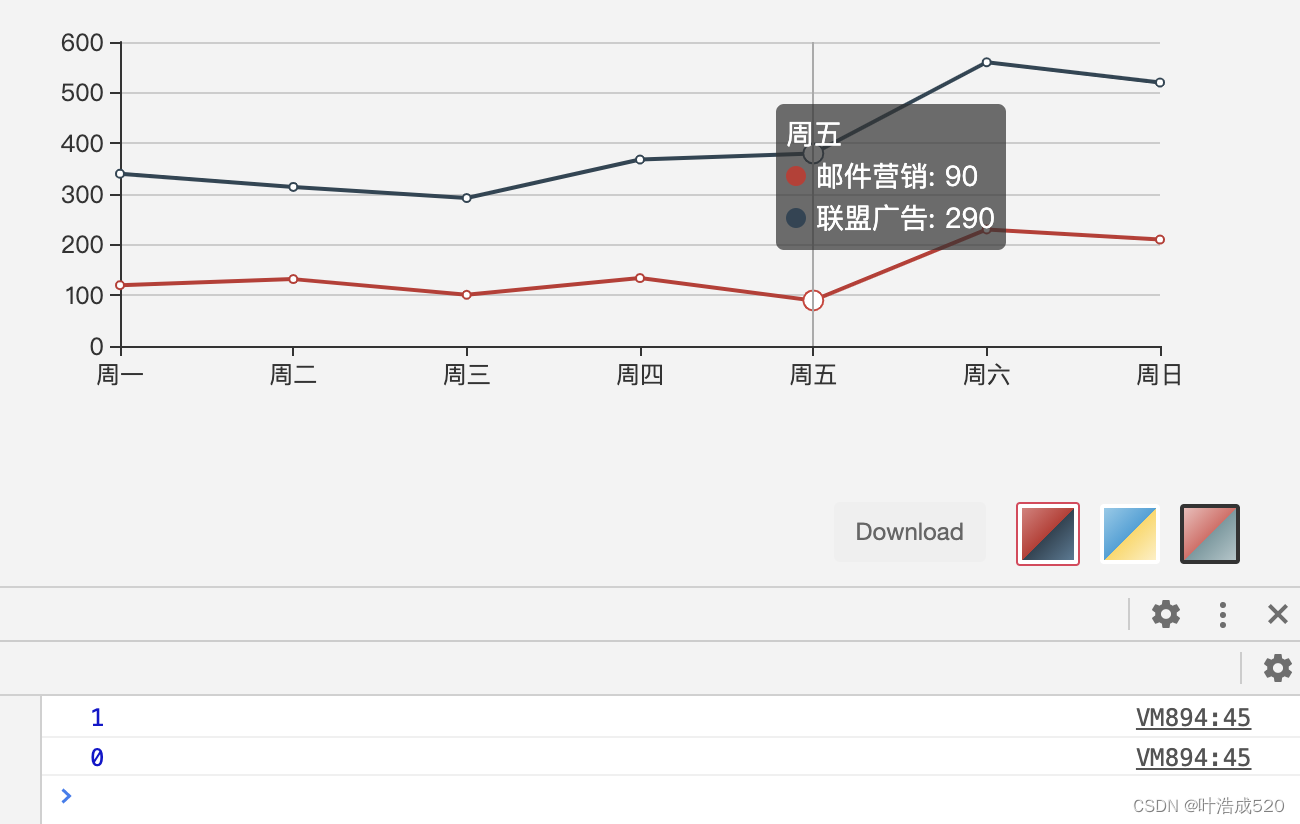
但是有人提出是可以通过getZr()方法来实现
网上也确实有大神提出一样的解决方法,链接如下:
Echarts 折线图点击折线区域(包含圆点)触发事件:http://t.csdn.cn/eVstn
下面把代码贴出来:
option = {
    tooltip: {
        trigger: 'axis'
    },
    legend: {
        data: ['邮件营销', '联盟广告']
    },
    xAxis: {
        type: 'category',
        boundaryGap: false,
        data: ['周一', '周二', '周三', '周四', '周五', '周六', '周日']
    },
    yAxis: {
        type: 'value'
    },
    series: [
        {
            name: '邮件营销',
            type: 'line',
            stack: '总量',
            data: [120, 132, 101, 134, 90, 230, 210]
        },
        {
            name: '联盟广告',
            type: 'line',
            stack: '总量',
            data: [220, 182, 191, 234, 290, 330, 310]
        },
    ]
};
myChart.getZr().on('click', function(params) {
  // 获取像素坐标点
  const pointInPixel = [params.offsetX, params.offsetY]
  const { target, topTarget } = params
  // 判断点击的点在  点击在折线的拐点 || 折线上
  if (target?.z === 2 || topTarget?.z === 2) {
  // 获取这条折线的 信息 也就是 index
  // 如果是拐点,直接读取 target.seriesIndex
  // 如果是折线上的点,读取 topTarget 对象下的继续寻找parent的信息的index
    const axs = target
      ? target.seriesIndex
      : topTarget.parent?.parent?.__ecComponentInfo?.index
    console.log(axs)
  }
})
// 将可以响应点击事件的范围内,鼠标样式设为pointer--------------------
myChart.getZr().on('mousemove', function(params) {
  const { topTarget } = params
  // 给折线的鼠标悬浮 变为 小手
  if (topTarget?.z === 2) {
    myChart.getZr().setCursorStyle('pointer')
  }
})
先记录一下,以后遇到同样的问题可以直接参考,完成!!!

