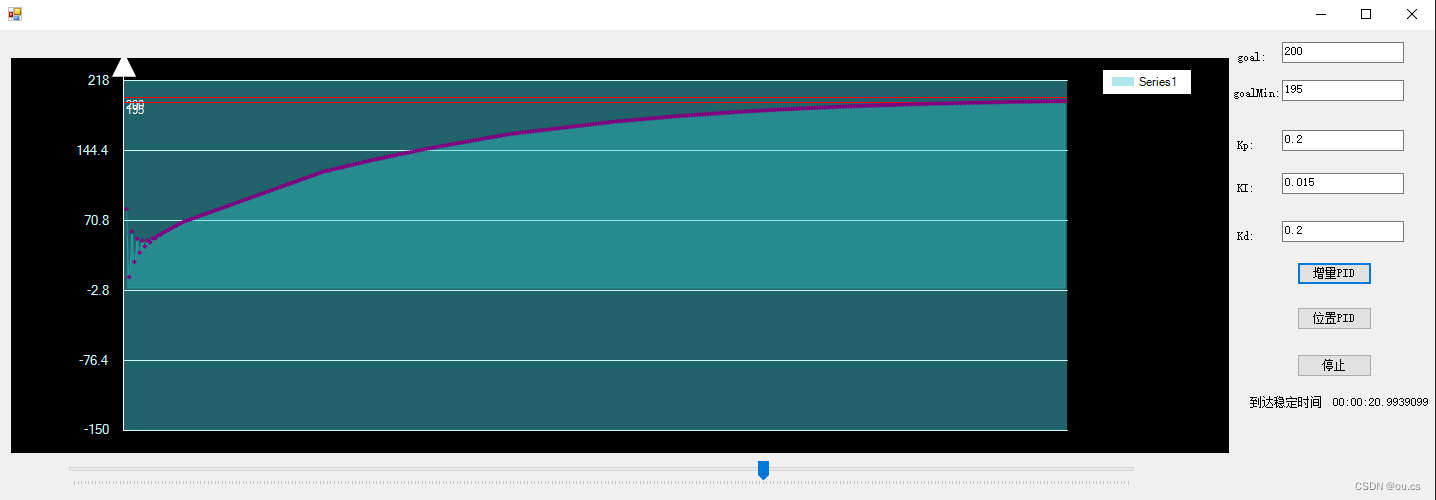
using System;
using System.Collections.Generic;
using System.Linq;
using System.Text;
using System.Threading.Tasks;

namespace PID控制
{
    public class PIDModel
    {
        public float goal;           //定义设定值
        public float thisValue;        //定义实际值

        public float err_last;           //定义上一个偏差值
        public float err_last2;           //定义最上前的偏差值
        public float Kp, Ki, Kd;           //定义比例、积分、微分系数
        public float output;         //定义输出值
        public float err;               //定义误差值
        public float errSum;           //定义误差和(积分)
        public float errInteral;
        public float errInteral2;

        public PIDModel()
        {
            goal = 0.0f;
            thisValue = 0.0f;
            err = 0.0f;
            err_last = 0.0f;
            output = 0.0f;
            errSum = 0.0f;
            errInteral = 0.0f;
            Kp = 0.4f;
            Ki = 0.16f;
            Kd = 0.2f;
            output = 0.0f;
        }

        public float PosPID(float Goal)
        {
            goal = Goal;
            err = goal - thisValue;//误差值 = 设定值-实际值
            errSum += err;//误差的积分(误差和)
            errInteral = err - err_last;//误差的变化
            //Console.WriteLine("err " + err);
            output = Kp * err + Ki * errSum + Kd * errInteral;

            err_last = err;
            thisValue = output;
            return output;
        }

        public float IncrePID(float Goal)
        {
            goal = Goal;
            err = goal - thisValue;

            errInteral = err - err_last;//此次误差-上次误差

            errInteral2 = err_last - err_last2;//上次误差-上上次误差

            output = Kp * errInteral + Ki * err + Kd * (errInteral - errInteral2);
            thisValue += output;
            err_last2 = err_last;
            err_last = err;
            return thisValue;
        }
    }
}
using PID控制;
using System;
using System.Collections.Generic;
using System.ComponentModel;
using System.Data;
using System.Drawing;
using System.Linq;
using System.Text;
using System.Threading.Tasks;
using System.Windows.Forms;
using System.Windows.Forms.DataVisualization.Charting;

namespace PID视图
{
    public partial class Form1 : Form
    {
        Queue<float> DataQueues=new Queue<float>(100);

        PIDModel pIDModel = new PIDModel();
        public Form1()
        {
            InitializeComponent();
            timer1.Enabled = false;

            textBox1.Text = "0.2";
            textBox2.Text = "0.015";
            textBox3.Text = "0.2";
            textBox4.Text = "200";
            textBox5.Text = "195";
            trackBar1.Value = (int)pIDModel.thisValue;

        }

        private void Setting_MyChartUI(Chart thisChart)
        {
            #region 图表内部颜色
            thisChart.ChartAreas[0].BackColor = Color.FromArgb(33, 99, 106);
            #endregion

            #region x,y轴字体设置
            thisChart.ChartAreas[0].AxisY.LabelStyle.ForeColor = Color.FromArgb(205, 255, 255);
            thisChart.ChartAreas[0].AxisX.LabelStyle.Font = new Font("思源黑体 CN Bold", 9F, System.Drawing.FontStyle.Bold, System.Drawing.GraphicsUnit.Point, ((byte)(134)));
            #endregion

            #region 折线图横线颜色
            thisChart.ChartAreas[0].AxisY.MajorGrid.LineColor = Color.FromArgb(205, 255, 255);
            #endregion

            #region 坐标轴箭头样式
            thisChart.ChartAreas[0].AxisX.ArrowStyle = AxisArrowStyle.Triangle;
            thisChart.ChartAreas[0].AxisY.ArrowStyle = AxisArrowStyle.Triangle;
            #endregion

            #region 坐标轴颜色
            thisChart.ChartAreas[0].AxisX.LineColor = Color.White;
            thisChart.ChartAreas[0].AxisY.LineColor = Color.White;
            #endregion

            #region x轴相邻间隔大小
            thisChart.ChartAreas[0].AxisX.Interval = 1;
            #endregion

            #region 线条的颜色
            thisChart.Series[0].Color = Color.FromArgb(100, 46, 199, 201);
            #endregion

            #region 点上的颜色
            thisChart.Series[0].MarkerColor = Color.Purple;
            #endregion

            #region 每一个点上数字的颜色
            thisChart.Series[0].LabelForeColor = Color.FromArgb(255, 179, 102);
            #endregion

            #region 在点上显示数字
            //thisChart.Series[0].IsValueShownAsLabel = true;
            #endregion

            #region 点上的图案
            thisChart.Series[0].MarkerStyle = MarkerStyle.Diamond;
            #endregion

            #region 包含范围的折线图类型 范围内和线条的颜色一致
            thisChart.Series[0].ChartType = SeriesChartType.SplineRange;
            #endregion
        }
        Random rd = new Random();

        int okCnt = 0;
        private void timer1_Tick(object sender, EventArgs e)
        {
            Setting_MyChartUI(chart1);

            chart1.ChartAreas[0].AxisY.StripLines.Clear();//清除上一根线
            Setting_MyChartUI_YMaxMin(int.Parse(textBox4.Text), 0, chart1);
            Setting_MyChart_MakingLine(int.Parse(textBox4.Text), chart1);
            Setting_MyChart_MakingLine(int.Parse(textBox5.Text), chart1);


            #region 队列数据更新

            if (DataQueues.Count() < 1000)
            {

                DataQueues.Enqueue(pIDModel.PIDFun(type, float.Parse(textBox4.Text)));
            }
            else
            {
                DataQueues.Dequeue();
            }

            #endregion

            trackBar1.Value = (int)pIDModel.thisValue;

            #region 折线图刷新
            chart1.Series[0].Points.Clear();
            #endregion

            #region 折线图数据刷新
            for (int j = 0; j < DataQueues.Count(); j++)
            {
                chart1.Series[0].Points.AddXY(j + 2, DataQueues.ElementAt(j));

                if (PointIsOk(DataQueues.ElementAt(j), 195, 200))
                {
                    okCnt++;
                    chart1.Series[0].Color = Color.FromArgb(100, 46, 199, 201);
                    if(okCnt.Equals(50))
                    {
                        label6.Text = (DateTime.Now - lastTime).ToString();
                    }
                }
                else
                {
                    chart1.Series[0].Color = Color.FromArgb(100, 252, 86, 51); ;
                }
            }
            #endregion

            #region 关闭X轴名称
            chart1.ChartAreas[0].AxisX.Enabled = AxisEnabled.False;
            #endregion
        }

        private void Setting_MyChartUI_YMaxMin(int max, int min, Chart thischart)
        {
            thischart.ChartAreas[0].AxisY.Maximum = max * 1.09;
            //thischart.ChartAreas[0].AxisY.Minimum = min * 0.91;
            thischart.ChartAreas[0].AxisY.Minimum = -150;
        }

        private void Setting_MyChart_MakingLine(int lineMax, Chart thisChart)
        {
            #region 添加标识线
            StripLine stripLine = new StripLine();
            stripLine.Text = lineMax.ToString();//展示文本
            stripLine.BackColor = Color.Red;//背景色
            stripLine.Interval = 0;//间隔
            stripLine.IntervalOffset = lineMax;//偏移量
            stripLine.StripWidth = 0.003;//线宽
            stripLine.ForeColor = Color.White;//前景色
            stripLine.TextAlignment = StringAlignment.Near;//文本对齐方式
            thisChart.ChartAreas[0].AxisY.StripLines.Add(stripLine);
            #endregion
        }

        private bool PointIsOk(float val,int min, int max)
        {
            if(val > min && val < max)
            {
                return true;
            }
            return false;
        }
        int type = 0;
        private void button1_Click(object sender, EventArgs e)
        {
            lastTime = DateTime.Now;
            type = 0;
            pIDModel.Kp = float.Parse(textBox1.Text);
            pIDModel.Ki = float.Parse(textBox2.Text);
            pIDModel.Kd = float.Parse(textBox3.Text);
            timer1.Enabled = true;
        }

        private void button2_Click(object sender, EventArgs e)
        {
            type = 1;
            pIDModel.Kp = float.Parse(textBox1.Text);
            pIDModel.Ki = float.Parse(textBox2.Text);
            pIDModel.Kd = float.Parse(textBox3.Text);
            timer1.Enabled = true;
        }

        private void Form1_MouseMove(object sender, MouseEventArgs e)
        {

        }

        DateTime lastTime = new DateTime();
        private void button3_Click(object sender, EventArgs e)
        {
            okCnt=0;
            pIDModel = new PIDModel();
            timer1.Enabled = false;
            chart1.Series[0].Points.Clear();
            DataQueues.Clear();
        }

        private void trackBar1_ValueChanged(object sender, EventArgs e)
        {
            pIDModel.thisValue =  trackBar1.Value  ;
        }
    }
}

参考文章:
自动控制算法的学习笔记
PID控制算法的C语言实现


![[附源码]Python计算机毕业设计Django校园租赁系统](https://img-blog.csdnimg.cn/07a6b652eccf4a8fa39ac553ff68f5cd.png)


![[附源码]Python计算机毕业设计Django疫情防控管理系统](https://img-blog.csdnimg.cn/1de5cd4dfae84035b7c5f2ea5a9ef3ba.png)

