实用图表工具Echars
前言
由于工作的需要,在写材料的时候需要使用到柱状图、饼状图、折线图等等展示数据,可以使用PPT等办公软件构建出图表,在这里可以使用更加方便、更加美观的工具Echars。
Echars图表使用
Echars官网:Ecahrs官方图表案例
数据的展示和x、y轴的信息,看模板应该都知道如何填写,这里着重介绍的是常见样式的调整。
1、数据展示
1.1 柱状图
官方例子地址:柱状图案例
柱状图为例:
option = {
  xAxis: {
    type: 'category',
    // x轴坐标
    data: ['Mon', 'Tue', 'Wed', 'Thu', 'Fri', 'Sat', 'Sun']
  },
  yAxis: {
    type: 'value'
  },
  series: [
    {
      // 柱状图柱子的值  对应的是y轴
      data: [120, 200, 150, 80, 70, 110, 130],
      type: 'bar'
    }
  ]
};

1.2 饼状图
官方例子地址:饼状图案例
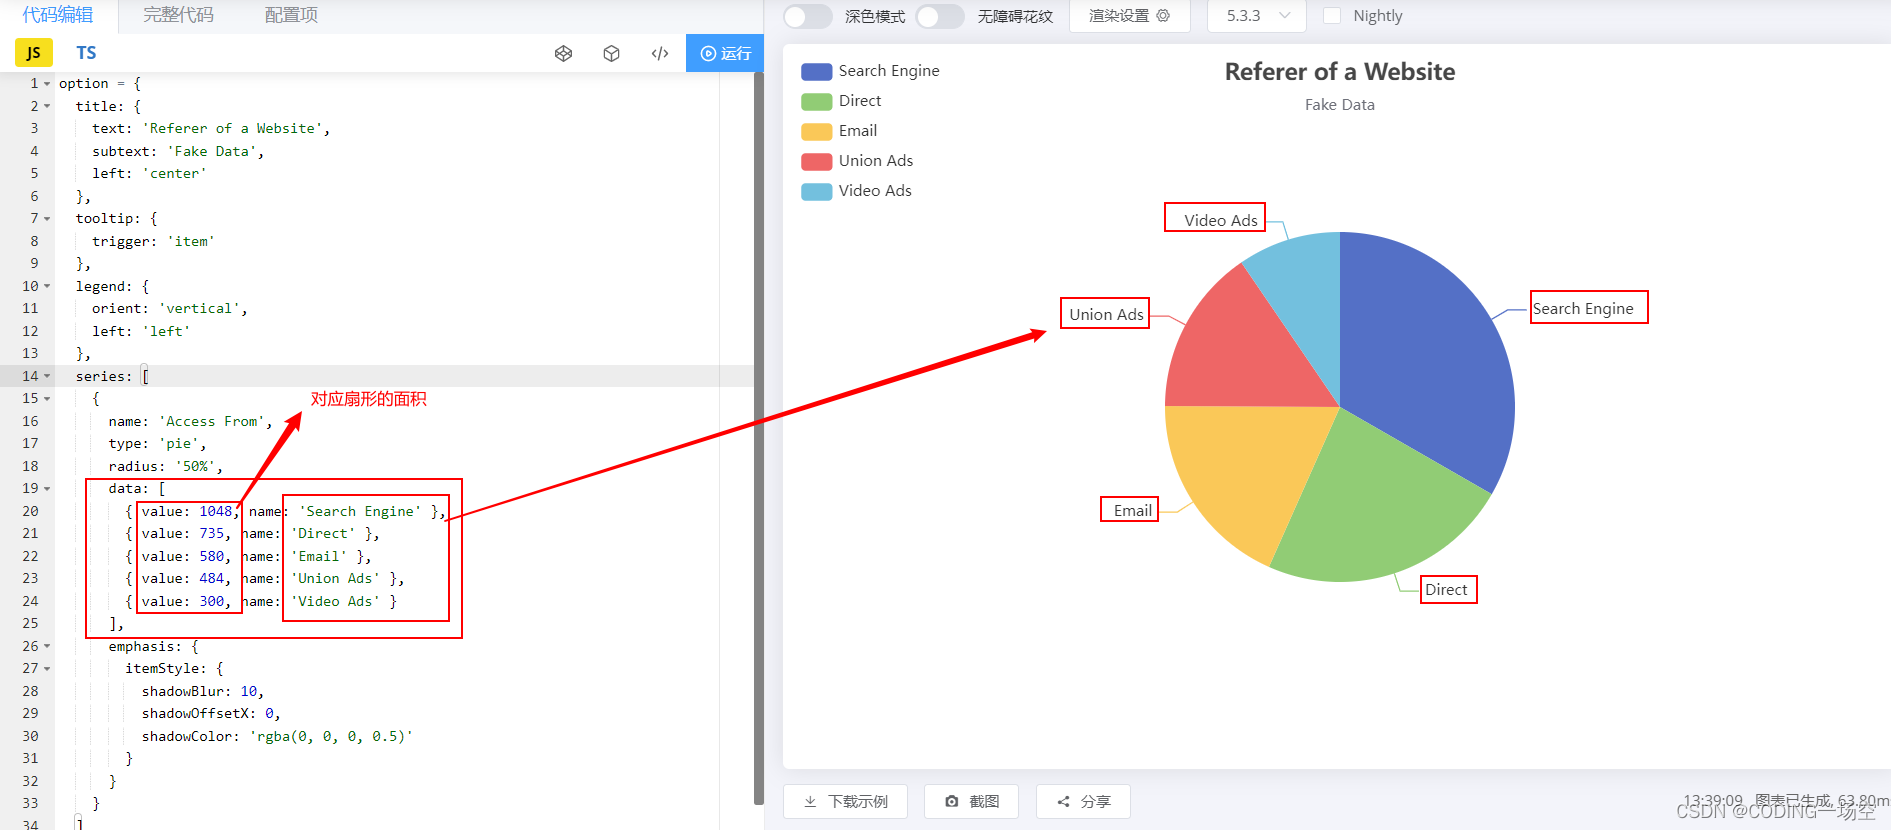
饼状图为例:
option = {
  title: {
    text: 'Referer of a Website',
    subtext: 'Fake Data',
    left: 'center'
  },
  tooltip: {
    trigger: 'item'
  },
  legend: {
    orient: 'vertical',
    left: 'left'
  },
  series: [
    {
      name: 'Access From',
      type: 'pie',
      radius: '50%',
      data: [
      // value 扇形的面积的占比  name 属性名
        { value: 1048, name: 'Search Engine' },
        { value: 735, name: 'Direct' },
        { value: 580, name: 'Email' },
        { value: 484, name: 'Union Ads' },
        { value: 300, name: 'Video Ads' }
      ],
      emphasis: {
        itemStyle: {
          shadowBlur: 10,
          shadowOffsetX: 0,
          shadowColor: 'rgba(0, 0, 0, 0.5)'
        }
      }
    }
  ]
};
2、图表通用样式
2.1 关于标题/副标题样式
案例代码:
option = {
// 标题副标题 设置开始
  title: {
    text: 'Referer of a Website',
    subtext: 'Fake Data',
    left: 'center'
  },
  // 标题副标题 设置结束
  tooltip: {
    trigger: 'item'
  },
  legend: {
    orient: 'vertical',
    left: 'left'
  },
  series: [
    {
      name: 'Access From',
      type: 'pie',
      radius: '50%',
      data: [
        { value: 1048, name: 'Search Engine' },
        { value: 735, name: 'Direct' },
        { value: 580, name: 'Email' },
        { value: 484, name: 'Union Ads' },
        { value: 300, name: 'Video Ads' }
      ],
      emphasis: {
        itemStyle: {
          shadowBlur: 10,
          shadowOffsetX: 0,
          shadowColor: 'rgba(0, 0, 0, 0.5)'
        }
      }
    }
  ]
};
设置标题副标题的代码:
  title: {
    text: 'Referer of a Website',
    subtext: 'Fake Data',
    left: 'center'
  },
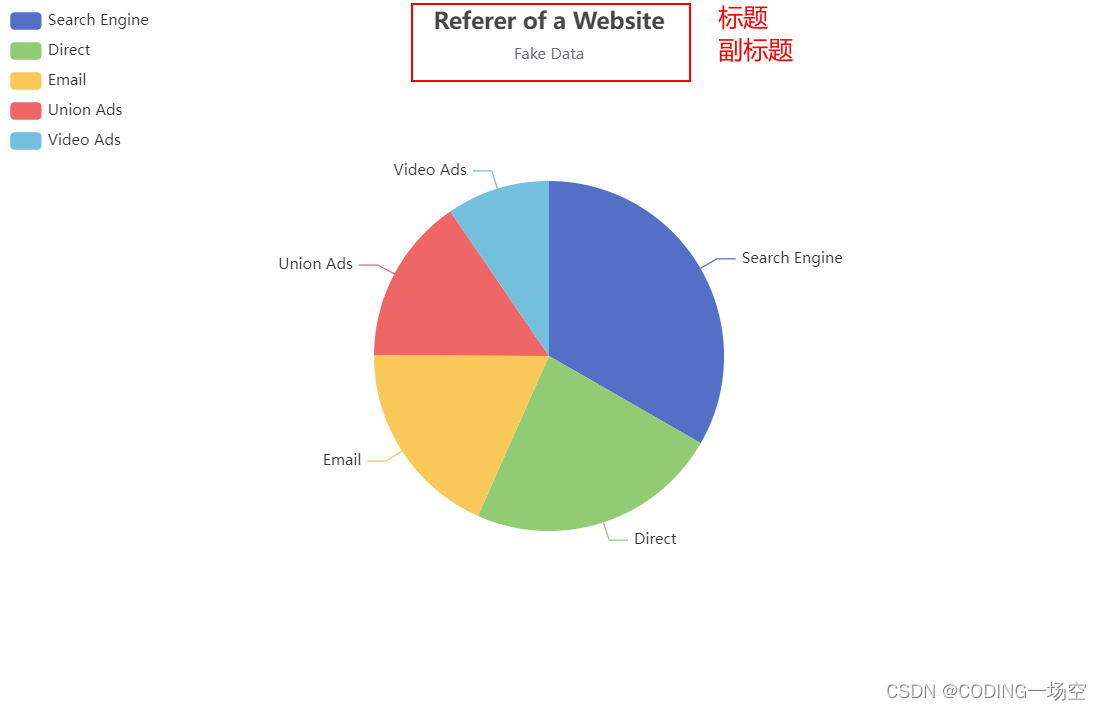
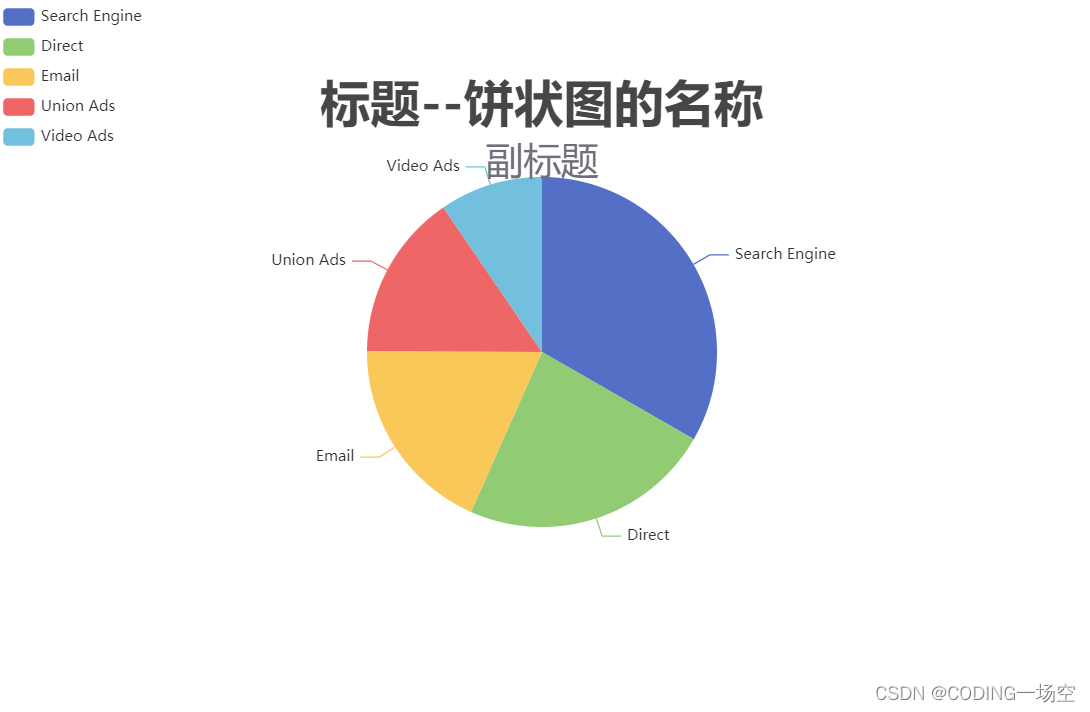
整个中文对比
  title: {
    text: '标题--饼状图的名称',
    subtext: '副标题',
    left: 'center'
  },

关于标题的摆放位置和标题字体的大小设置
标题字体大小:
 title: {
    text: '标题--饼状图的名称',
    subtext: '副标题',
    left: 'center',
    // 标题字体大小
    textStyle:{
      fontSize: 40
    },
    // 副标题字体大小
    subtextStyle:{
      fontSize: 30
    }
  },

标题摆放位置:
最简单的方法设置(x,y)坐标位置
  title: {
    text: '标题--饼状图的名称',
    subtext: '副标题',
    left: 'center',
    textStyle:{
      fontSize: 40
    },
    subtextStyle:{
      fontSize: 30
    },
    // 可以设置x轴坐标位置 和y轴坐标位置
    y: 60
  },
2.2 关于图例属性的样式
  legend: {
    orient: 'vertical',
    left: 'left'
  },

关于属性说明的摆放位置和字体的大小设置
字体大小设置:
  legend: {
    orient: 'vertical',
    left: 'left',
    textStyle:{
      fontSize: 20
    }
  },

属性说明位置摆放设置:
  legend: {
    orient: 'vertical',
    left: 'right',
    textStyle:{
      fontSize: 20
    }
  },

设置x/y坐标
  legend: {
    orient: 'vertical',
    //left: 'left',
    y:300,
    x:100
  },

2.3 关于设置柱状图/饼状图颜色
柱状图
option = {
  xAxis: {
    type: 'category',
    data: ['Mon', 'Tue', 'Wed', 'Thu', 'Fri', 'Sat', 'Sun']
  },
  yAxis: {
    type: 'value'
  },
  series: [
    {
      data: [120, 200, 150, 80, 70, 110, 130],
      type: 'bar'
    }
  ]
};

柱状图颜色设置
color: ['#c23531']

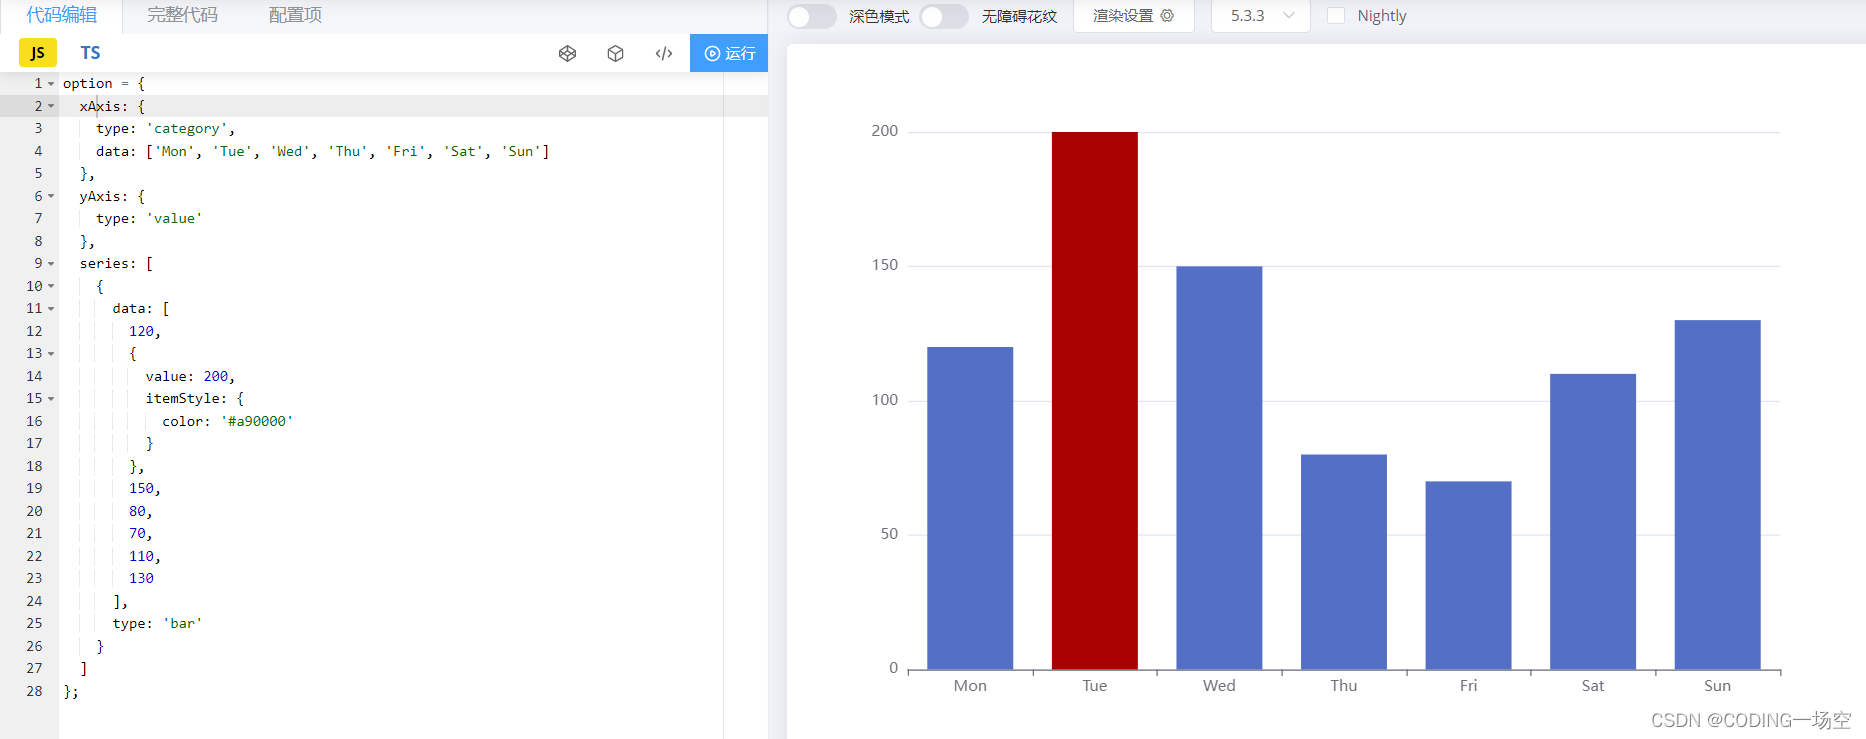
设置单个柱子的颜色
option = {
  xAxis: {
    type: 'category',
    data: ['Mon', 'Tue', 'Wed', 'Thu', 'Fri', 'Sat', 'Sun']
  },
  yAxis: {
    type: 'value'
  },
  series: [
    {
      data: [
        120,
        {
          value: 200,
          itemStyle: {
            color: '#a90000'
          }
        },
        150,
        80,
        70,
        110,
        130
      ],
      type: 'bar'
    }
  ]
};
饼状图

饼状图颜色设置
color: ['#c23531','#2f4554', '#61a0a8','#111111','#147222'],

2.4 关于设置x/y轴属性
字体大小设置
以柱状图为例
option = {
  xAxis: {
    type: 'category',
    data: ['Mon', 'Tue', 'Wed', 'Thu', 'Fri', 'Sat', 'Sun']
  },
  yAxis: {
    type: 'value'
  },
  series: [
    {
      data: [120, 200, 150, 80, 70, 110, 130],
      type: 'bar'
    }
  ]
};

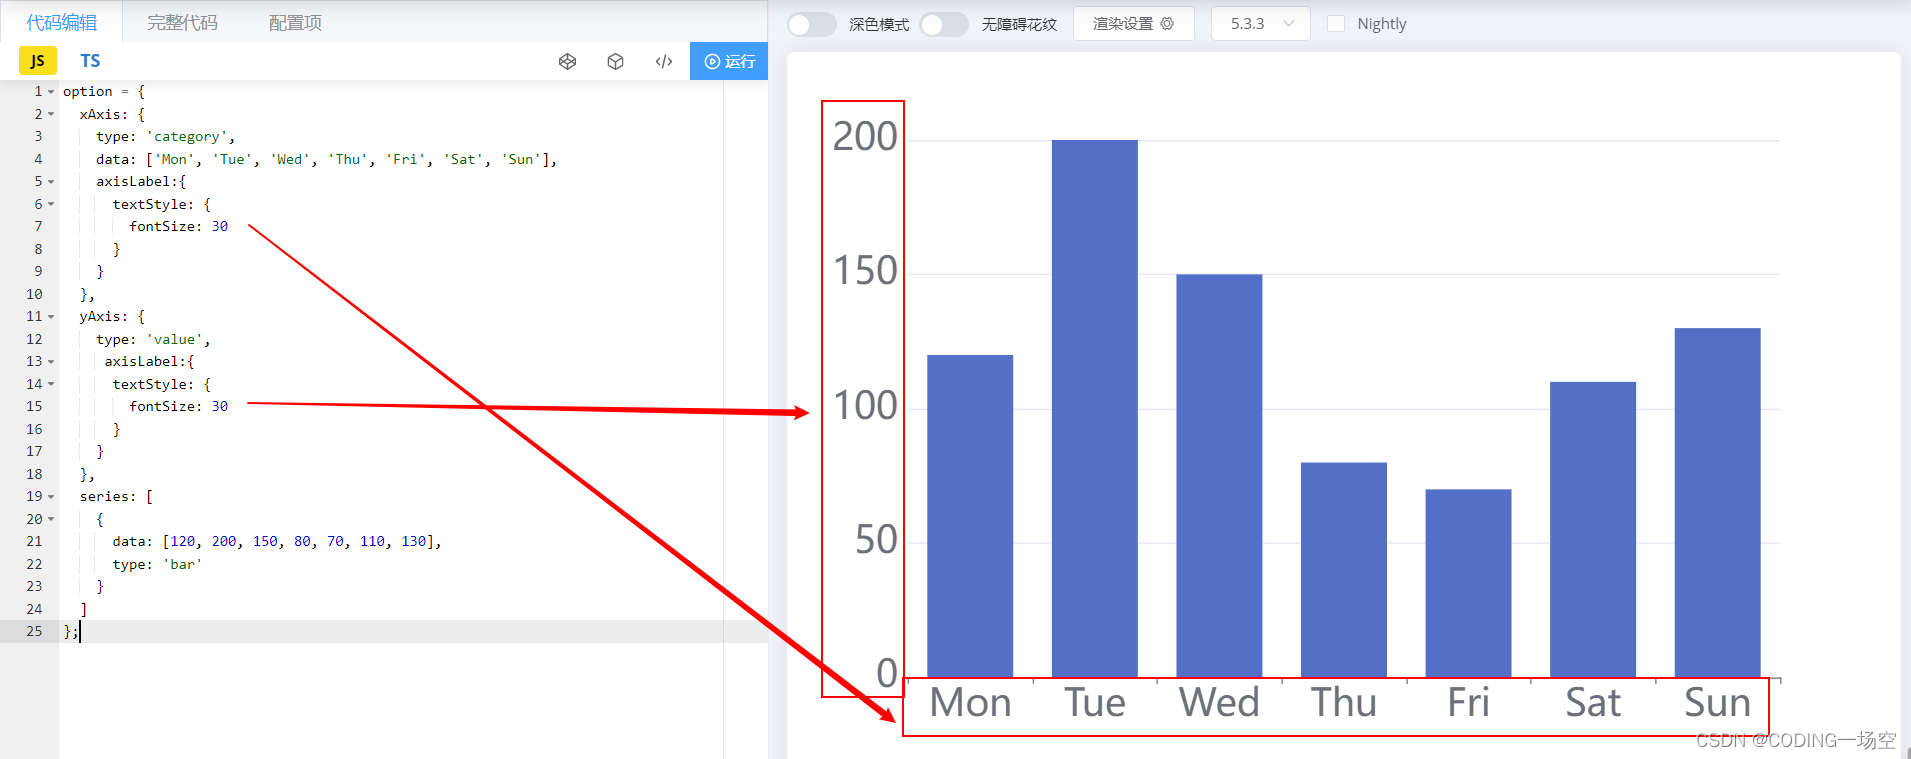
设置字体大小
   axisLabel:{
      textStyle: {
        fontSize: 30
      }
    }
option = {
  xAxis: {
    type: 'category',
    data: ['Mon', 'Tue', 'Wed', 'Thu', 'Fri', 'Sat', 'Sun'],
    axisLabel:{
      textStyle: {
        fontSize: 30
      }
    }
  },
  yAxis: {
    type: 'value',
     axisLabel:{
      textStyle: {
        fontSize: 30
      }
    }
  },
  series: [
    {
      data: [120, 200, 150, 80, 70, 110, 130],
      type: 'bar'
    }
  ]
};
更多样式请参照:
史上最全Echars样式博文
