扫码关注下方公粽号,回复推文合集,获取400页单细胞学习资源!

「写在前面」
Python作为一种高级编程语言,被广泛用于单细胞数据分析,有着以下的优势:
「大量的生物信息学库:」 Python拥有大量的生物信息学库,如scikit-learn、scanpy[1]等,可以用于单细胞数据的预处理、聚类、可视化等。
「可扩展性:」 Python的开放性和可扩展性使得它可以轻松集成其他的工具和库,例如Jupyter Notebook、PyTorch等,为单细胞研究提供了更多的分析工具和资源。
「开放源代码:」 Python是一种开放源代码的编程语言,可以免费使用和分发,这也使得它成为了单细胞研究中最流行的编程语言之一。
「本文目录如下」
- 一、安装
- 二、准备工作
- 三、预处理
- 四、检测高变基因
- 五、主成分分析
- 六、邻域图和聚类图
- 七、检索标记基因
- 八、亚型标注
备注:本教程代码部分在Google Colab运行环境中完成,Google Colab是Google提供的一个Jupyter Notebook式的交互环境[2]。
一、安装
!pip install scanpy #在Colab这类的交互式开发环境下可使用!pip指令直接在单元格中进行对Python包和模块的安装、管理和升级等操作,而不需要打开Python解释器
!pip install leidenalg # 使用leiden算法时需要
二、准备工作
# 载入包
import numpy as np
import pandas as pd
import scanpy as sc
# 设置
sc.settings.verbosity = 3 # 设置日志等级:errors(0),warnings(1),info(2),hints(3)
sc.logging.print_header() # 输出版本号
sc.settings.set_figure_params(dpi=80, facecolor='white') # 设置图片的分辨率及其他样式
scanpy==1.9.3 anndata==0.8.0 umap==0.5.3 numpy==1.22.4 scipy==1.10.1 pandas==1.4.4 scikit-learn==1.2.2 statsmodels==0.13.5 python-igraph==0.10.4 pynndescent==0.5.8
# 用于存储分析结果文件的路径
results_file = 'write/pbmc4k.h5ad'
下载并解压pbmc4K数据集
❝
数据集简介:pbmc4K数据集是一组来自人类外周血单个核细胞(PBMC)的单细胞转录组数据,其中包含大约12000个单细胞样本。该数据集涵盖了多种PBMC亚群的基因表达信息,包括T细胞、B细胞、NK细胞和单核细胞等。这些数据可用于单细胞分析、细胞亚型鉴定、信号通路分析以及免疫细胞分子调节等研究领域。
❞
!wget https://cf.10xgenomics.com/samples/cell-exp/2.1.0/pbmc4k/pbmc4k_raw_gene_bc_matrices.tar.gz
--2023-03-25 05:23:28--  https://cf.10xgenomics.com/samples/cell-exp/2.1.0/pbmc4k/pbmc4k_raw_gene_bc_matrices.tar.gz
Resolving cf.10xgenomics.com (cf.10xgenomics.com)... 104.18.0.173, 104.18.1.173, 2606:4700::6812:1ad, ...
Connecting to cf.10xgenomics.com (cf.10xgenomics.com)|104.18.0.173|:443... connected.
HTTP request sent, awaiting response... 200 OK
Length: 31646337 (30M) [application/x-tar]
Saving to: ‘pbmc4k_raw_gene_bc_matrices.tar.gz’

pbmc4k_raw_gene_bc_ 100%[===================>]  30.18M   171MB/s    in 0.2s

2023-03-25 05:23:28 (171 MB/s) - ‘pbmc4k_raw_gene_bc_matrices.tar.gz’ saved [31646337/31646337]
import tarfile
filename = "pbmc4k_raw_gene_bc_matrices.tar.gz"
tf = tarfile.open(filename)
tf.extractall('scanpy') # 设置路径文件夹为scanpy
载入文件
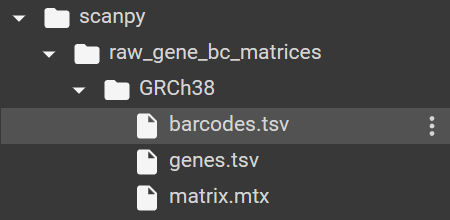
adata = sc.read_10x_mtx('/content/scanpy/raw_gene_bc_matrices/GRCh38', var_names='gene_symbols', cache=True)
... writing an h5ad cache file to speedup reading next time
adata
AnnData object with n_obs × n_vars = 737280 × 33694
    var: 'gene_ids'
三、预处理
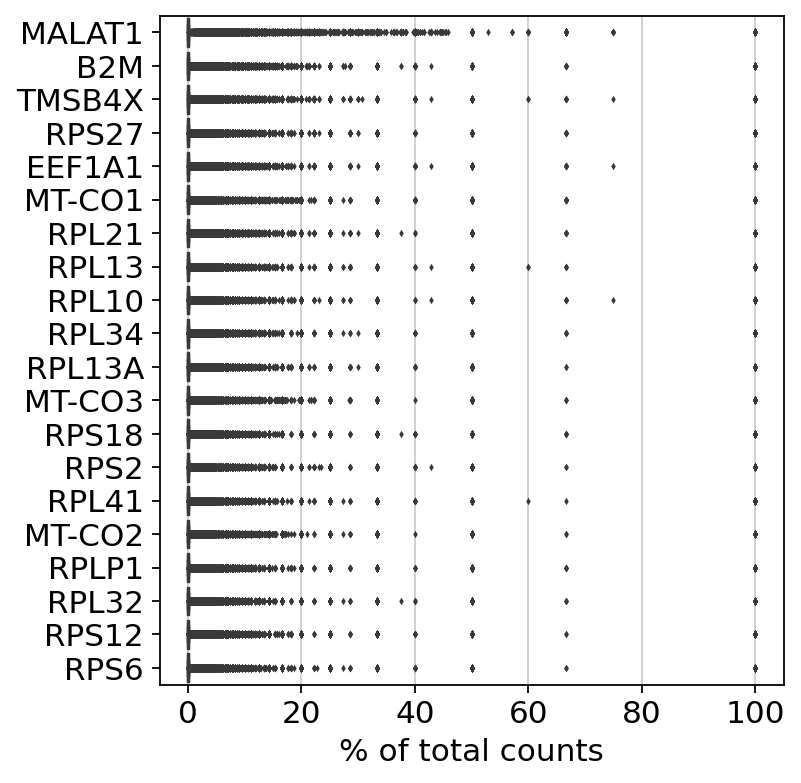
显示在全部单个细胞中基因读数占总读数的百分比排名前20的基因
sc.pl.highest_expr_genes(adata, n_top=20)
「过滤低质量细胞样本」
过滤在少于三个细胞中表达的基因,或一个细胞中表达少于200个基因的细胞样本
sc.pp.filter_cells(adata, min_genes=200)
sc.pp.filter_genes(adata, min_cells=3)
filtered out 732498 cells that have less than 200 genes expressed
filtered out 16948 genes that are detected in less than 3 cells
adata
AnnData object with n_obs × n_vars = 4782 × 16746
    obs: 'n_genes'
    var: 'gene_ids', 'n_cells'
「过滤包含线粒体基因和表达基因过多的细胞」
线粒体基因的转录本比单个转录物分子大,并且不太可能通过细胞膜逃逸.因此,检测出高比例的线粒体基因,表明细胞质量差
表达基因过多可能是由于一个油滴包裹多个细胞,从而检测出比正常检测要多的基因数,因此要过滤这些细胞
adata.var['mt'] = adata.var_names.str.startswith('MT-')  # 将线粒体基因标记为mt
sc.pp.calculate_qc_metrics(adata, qc_vars=['mt'], percent_top=None, log1p=False, inplace=True)
sc.pl.violin(adata, ['n_genes_by_counts', 'total_counts', 'pct_counts_mt'], jitter=0.4, multi_panel=True)

生成的三张小提琴图代表:表达基因的数量,每个细胞包含的表达量(UMI数),线粒体基因表达量的百分比
sc.pl.scatter(adata, x='total_counts', y='pct_counts_mt')
sc.pl.scatter(adata, x='total_counts', y='n_genes_by_counts')
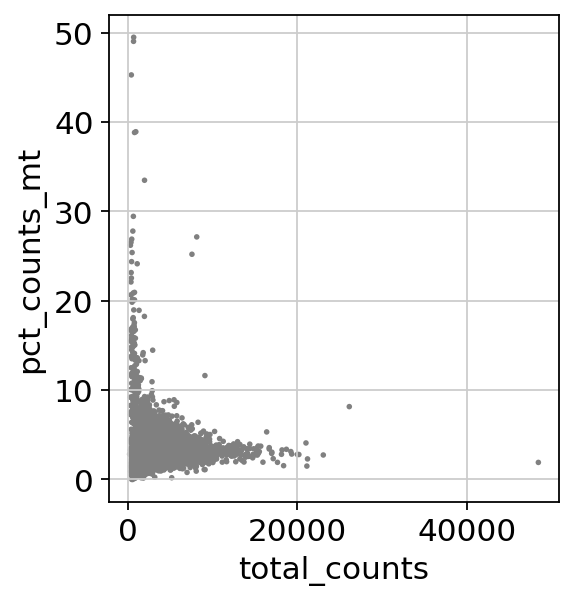

根据以上两图我们将线粒体基因占比20%以及表达基因数3500作为过滤参数
过滤线粒体基因表达过多或总数过多的细胞
# 获取线粒体基因占比在20%以下的细胞样本
adata = adata[adata.obs.pct_counts_mt<20, :]
# 获取表达基因数在3500以下的细胞样本
adata = adata[adata.obs.n_genes_by_counts<3500, :]
adata
View of AnnData object with n_obs × n_vars = 4741 × 16746
    obs: 'n_genes', 'n_genes_by_counts', 'total_counts', 'total_counts_mt', 'pct_counts_mt'
    var: 'gene_ids', 'n_cells', 'mt', 'n_cells_by_counts', 'mean_counts', 'pct_dropout_by_counts', 'total_counts'
四、检测高变基因
「归一化」
使得不同细胞样本间可比
sc.pp.normalize_total(adata, target_sum=1e4)
sc.pp.log1p(adata)
「存储数据」
将AnnData对象的.raw属性设置为归一化和对数化的原始基因表达,以便以后用于基因表达的差异测试和可视化
adata.raw = adata
识别高变基因
# 计算
sc.pp.highly_variable_genes(adata, min_mean=0.0125, max_mean=3, min_disp=0.5)
# 绘制高变基因散点图
sc.pl.highly_variable_genes(adata)
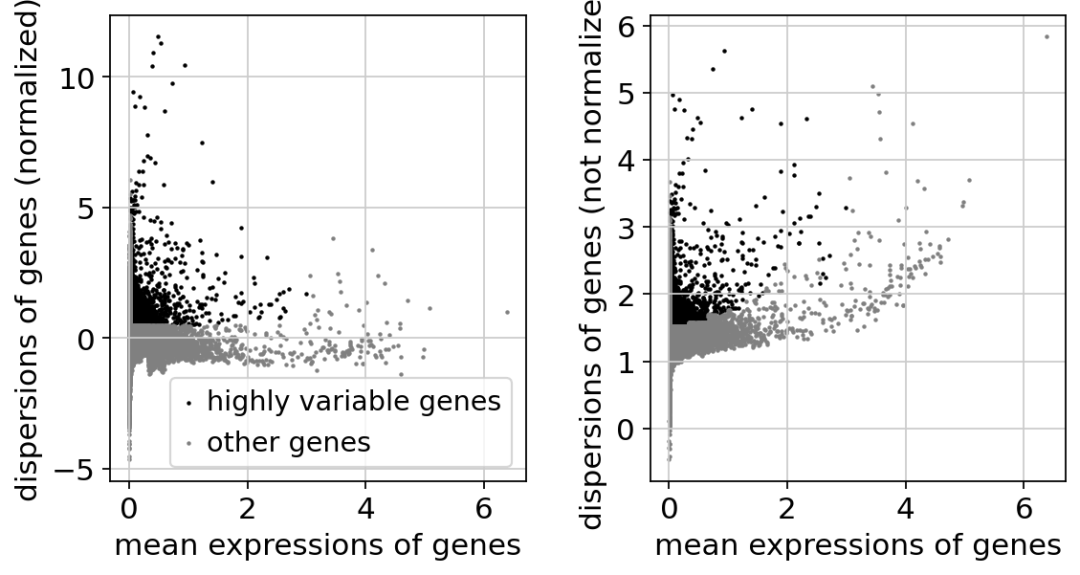
获取只有高变基因的数据集
adata = adata[:, adata.var.highly_variable]
# 回归每个细胞的总计数和表达的线粒体基因的百分比的影响.
sc.pp.regress_out(adata, ['total_counts', 'pct_counts_mt'])
# 将每个基因缩放到单位方差,阈值超过标准偏差10.
sc.pp.scale(adata, max_value=10)
regressing out ['total_counts', 'pct_counts_mt']
    sparse input is densified and may lead to high memory use
    finished (0:00:39)
adata
AnnData object with n_obs × n_vars = 4741 × 2910
    obs: 'n_genes', 'n_genes_by_counts', 'total_counts', 'total_counts_mt', 'pct_counts_mt'
    var: 'gene_ids', 'n_cells', 'mt', 'n_cells_by_counts', 'mean_counts', 'pct_dropout_by_counts', 'total_counts', 'highly_variable', 'means', 'dispersions', 'dispersions_norm', 'mean', 'std'
    uns: 'log1p', 'hvg'
五、主成分分析
通过运行主成分分析(PCA)来降低数据的维数,可以对数据进行去噪并揭示不同分群的主因素
# 绘制PCA图
sc.tl.pca(adata, svd_solver='arpack')
sc.pl.pca(adata, color='CST3')
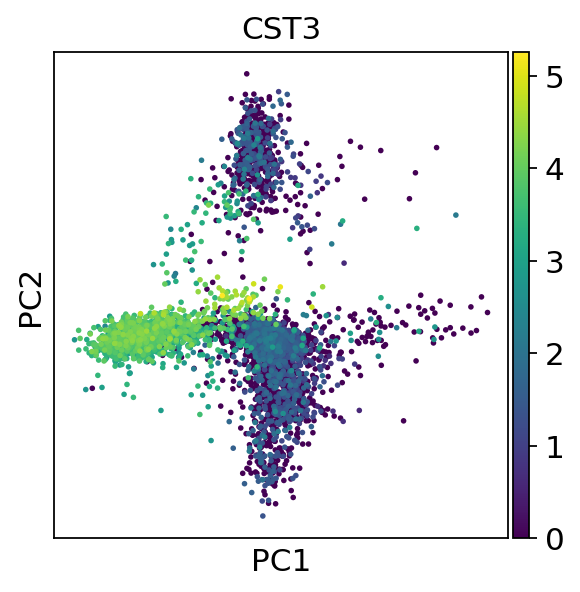
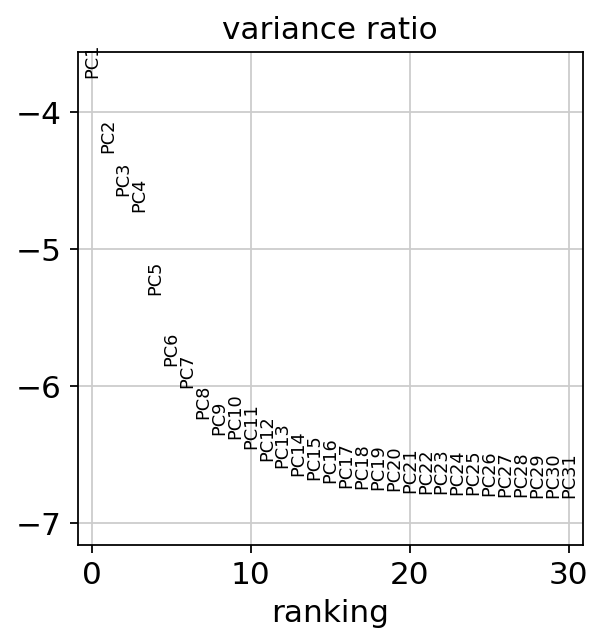
检查单个PC对数据总方差的贡献,这里提示我们应该考虑10个PC以计算细胞的邻域关系的信息,对PC数目考量的参数将在后续的聚类函数sc.tl.louvain()或sc.tl.tsne()中应用
sc.pl.pca_variance_ratio(adata, log=True)
六、邻域图和聚类图
使用数据矩阵的PCA表示来计算细胞的邻域图,建议使用UMAP,它可能比tSNE更能反映流形的全局连通性,因此能更好地保留轨迹
sc.pp.neighbors(adata, n_neighbors=10, n_pcs=40)
sc.tl.umap(adata)
sc.pl.umap(adata, color=['CST3', 'NKG7', 'PPBP'])

为了绘制缩放矫正的邻域图,需要使用use_raw=False参数
sc.pl.umap(adata, color=['CST3', 'NKG7', 'PPBP'], use_raw=False)

下面进行Leiden图聚类
# 计算
sc.tl.leiden(adata)
# 绘制
sc.pl.umap(adata, color=['leiden'])

七、检索标记基因
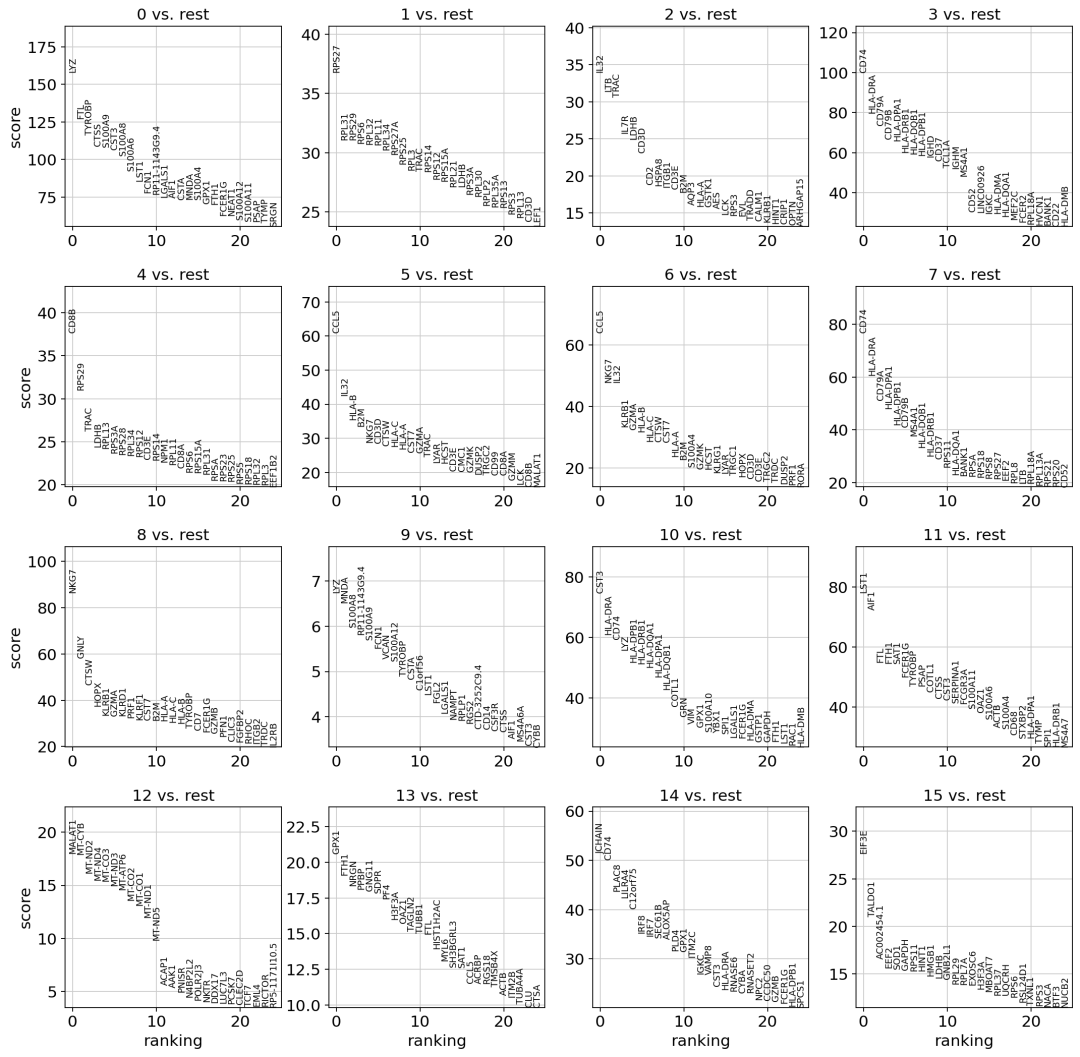
先计算每个leiden分群中高度差异基因的排名,取排名前25的基因
最简单和最快的方法是t检验
sc.tl.rank_genes_groups(adata, 'leiden', method='t-test')
sc.pl.rank_genes_groups(adata, n_genes=25, sharey=False)
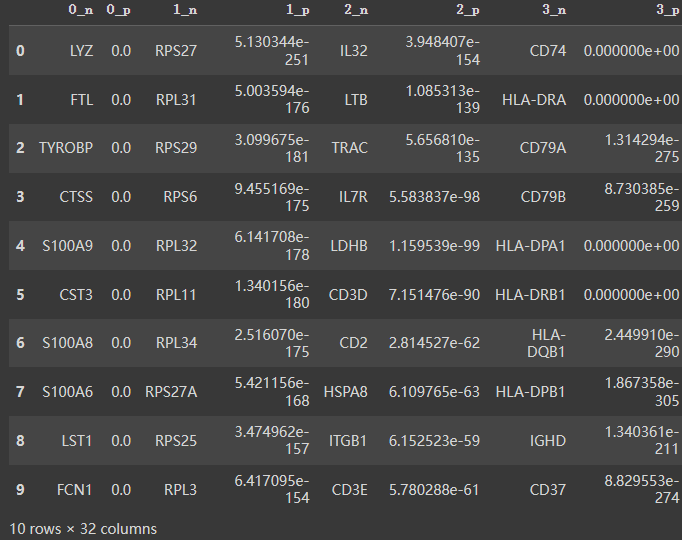
获取聚类分组和分数
result = adata.uns['rank_genes_groups']
groups = result['names'].dtype.names
pd.DataFrame(
    {group + '_' + key[:1]: result[key][group]
    for group in groups for key in ['names', 'pvals']}).head(10)
八、亚型标注
浏览全部已有leiden亚群
for i in adata.obs['leiden'].cat.categories:
  number = len(adata.obs[adata.obs['leiden']==i])
  print('the number of category {} is {}'.format(i,number))
the number of category 0 is 917
the number of category 1 is 911
the number of category 2 is 482
the number of category 3 is 436
the number of category 4 is 399
the number of category 5 is 381
the number of category 6 is 215
the number of category 7 is 201
the number of category 8 is 200
the number of category 9 is 159
the number of category 10 is 121
the number of category 11 is 120
the number of category 12 is 116
the number of category 13 is 40
the number of category 14 is 37
the number of category 15 is 6
其中13到15亚群所含细胞数过少,予以舍去
adata = adata[adata.obs[adata.obs['leiden'].astype(int)<13].index]
adata
View of AnnData object with n_obs × n_vars = 4658 × 2910
    obs: 'n_genes', 'n_genes_by_counts', 'total_counts', 'total_counts_mt', 'pct_counts_mt', 'leiden'
    var: 'gene_ids', 'n_cells', 'mt', 'n_cells_by_counts', 'mean_counts', 'pct_dropout_by_counts', 'total_counts', 'highly_variable', 'means', 'dispersions', 'dispersions_norm', 'mean', 'std'
    uns: 'log1p', 'hvg', 'pca', 'neighbors', 'umap', 'leiden', 'leiden_colors', 'rank_genes_groups'
    obsm: 'X_pca', 'X_umap'
    varm: 'PCs'
    obsp: 'distances', 'connectivities'
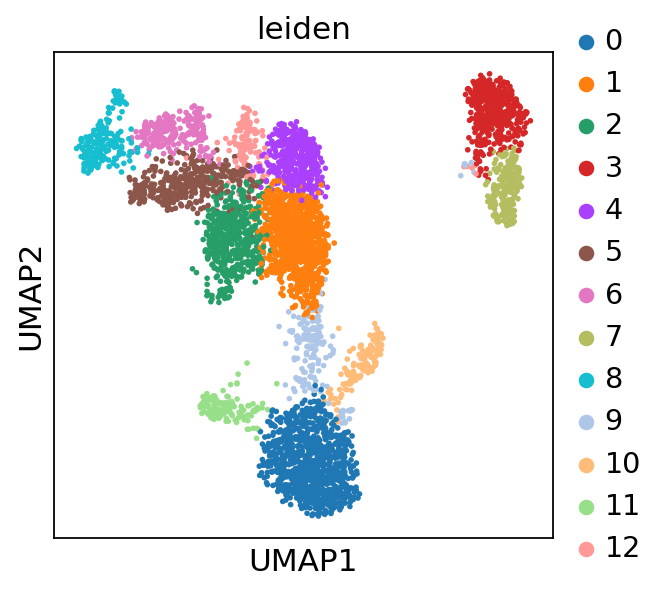
浏览更新后的各亚群,并查看其umap图,可见聚类效果较好
for i in adata.obs['leiden'].cat.categories:
  number = len(adata.obs[adata.obs['leiden']==i])
  print('the number of category {} is {}'.format(i,number))
the number of category 0 is 917
the number of category 1 is 911
the number of category 2 is 482
the number of category 3 is 436
the number of category 4 is 399
the number of category 5 is 381
the number of category 6 is 215
the number of category 7 is 201
the number of category 8 is 200
the number of category 9 is 159
the number of category 10 is 121
the number of category 11 is 120
the number of category 12 is 116
sc.pl.umap(adata, color=['leiden'], wspace=0.4, show=False)
adata
View of AnnData object with n_obs × n_vars = 4658 × 2910
    obs: 'n_genes', 'n_genes_by_counts', 'total_counts', 'total_counts_mt', 'pct_counts_mt', 'leiden'
    var: 'gene_ids', 'n_cells', 'mt', 'n_cells_by_counts', 'mean_counts', 'pct_dropout_by_counts', 'total_counts', 'highly_variable', 'means', 'dispersions', 'dispersions_norm', 'mean', 'std'
    uns: 'log1p', 'hvg', 'pca', 'neighbors', 'umap', 'leiden', 'leiden_colors', 'rank_genes_groups'
    obsm: 'X_pca', 'X_umap'
    varm: 'PCs'
    obsp: 'distances', 'connectivities'
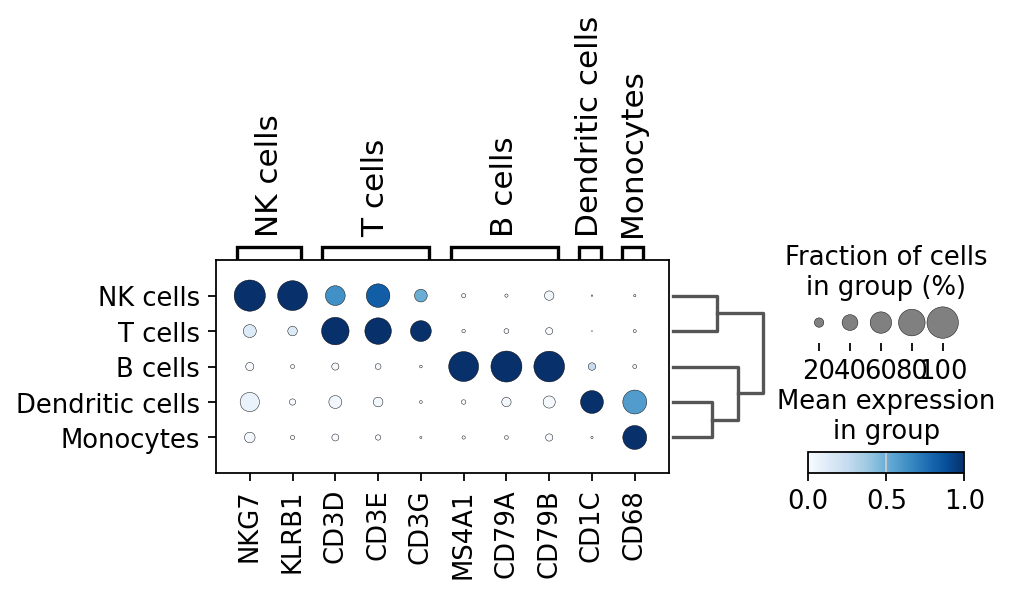
结合文献及已有知识,联合上文所得各亚群标记基因,编制潜在细胞亚型及其对应marker基因的特征字典
marker_genes_dict = {
    'T cells': ['CD3D', 'CD3E', 'CD3G'], #T细胞
    'NK cells': ['NKG7', 'KLRB1'], #NK细胞
    'B cells': ['MS4A1', 'CD79A', 'CD79B'], #B细胞
    'Monocytes': ['CD68'], #单核细胞
    'Dendritic cells': ['CD1C'], #树突状细胞
}
可视化字典内marker基因于各亚群中的分布情况
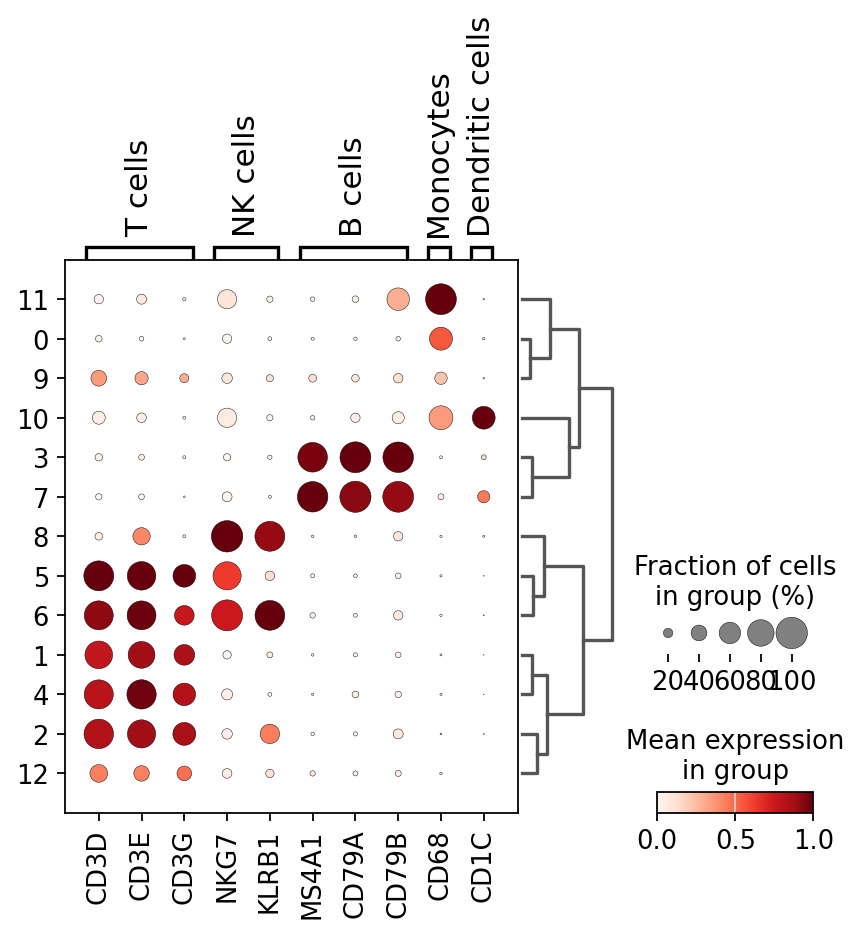
根据可视化结果标注各亚群
cluster2annotation = {
    '0': 'Monocytes',
    '1': 'T cells',
    '2': 'T cells',
    '3': 'B cells',
    '4': 'T cells',
    '5': 'T cells',
    '6': 'NK cells',
    '7': 'B cells',
    '8': 'NK cells',
    '9': 'T cells',
    '10': 'Dendritic cells',
    '11': 'Monocytes',
    '12': 'T cells'
}
adata.obs['major_celltype'] = adata.obs['leiden'].map(cluster2annotation).astype('category')
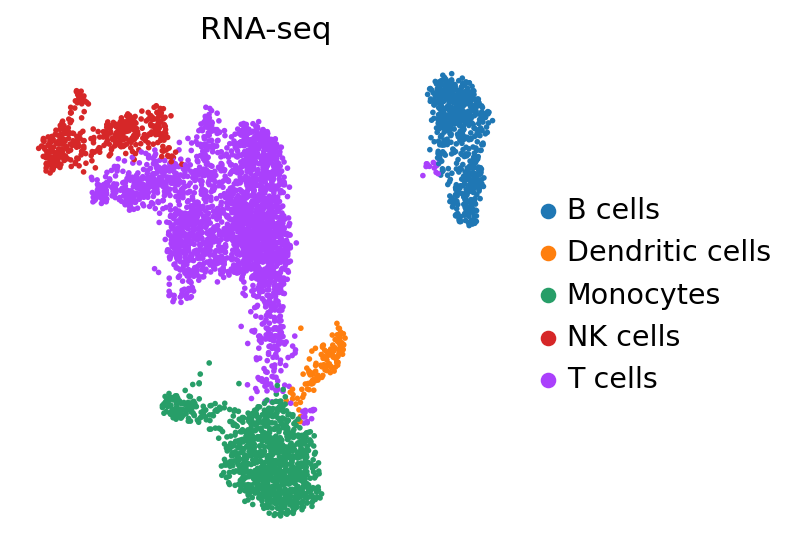
可视化标注结果
sc.tl.dendrogram(adata,groupby='major_celltype')
sc.pl.dotplot(
    adata,
    marker_genes_dict,
    groupby='major_celltype',
    dendrogram=True,
    color_map="Blues",
    swap_axes=False,
    use_raw=True,
    standard_scale="var",
)
ax=sc.pl.embedding(
    adata,
    basis="X_umap",
    color='major_celltype',
    title='RNA-seq',
    frameon=False,
    ncols=3,
    #save='_figure1_celltype.png',
    return_fig=True,
    show=False,
)
Reference
[1]scanpy官网:https://scanpy.readthedocs.io/en/stable/tutorials.html
[2]Google Colab平台使用:https://www.jianshu.com/p/b32c61a042bf


