echarts几个公司内部数据可视化图表必

news2024/12/23 9:34:09

目录

  • 折线图
    • 日负荷折线图
    • 最大需求表
  • 柱状图
    • 日电量柱状图
    • 分时电量
    • 功率因数
    • 三相温度
  • 水球图
    • 年月日负荷率图
  • 散点图
    • 三相平衡

最近公司有一个需求,要做一个数据可视化的页面,所有的图表都在下面,做这些都是本人自己写的,全部都是真是的项目中的代码,包含有柱状图、折线图、水球图以及散点图,这里直接打出来给大家练手,希望大家多多支持,如果这篇文章对您有用的话,记得收藏

数据:

链接: https://pan.baidu.com/s/1BSjLZkZ7dbsdiwPt4uPqOg

提取码: u1k9

??????温馨提示:

1.大家尽量不要使用手机看哦!不然把手累抽筋了不要怪我哦= =

2.大家不需要关注charts等这些自定义组件,主需要关注图表的样式即可

3.此文章需要一定的vue基础才可以哦

折线图

日负荷折线图

在这个图表中,大家可以学会如何使封闭的区域填充渐变色
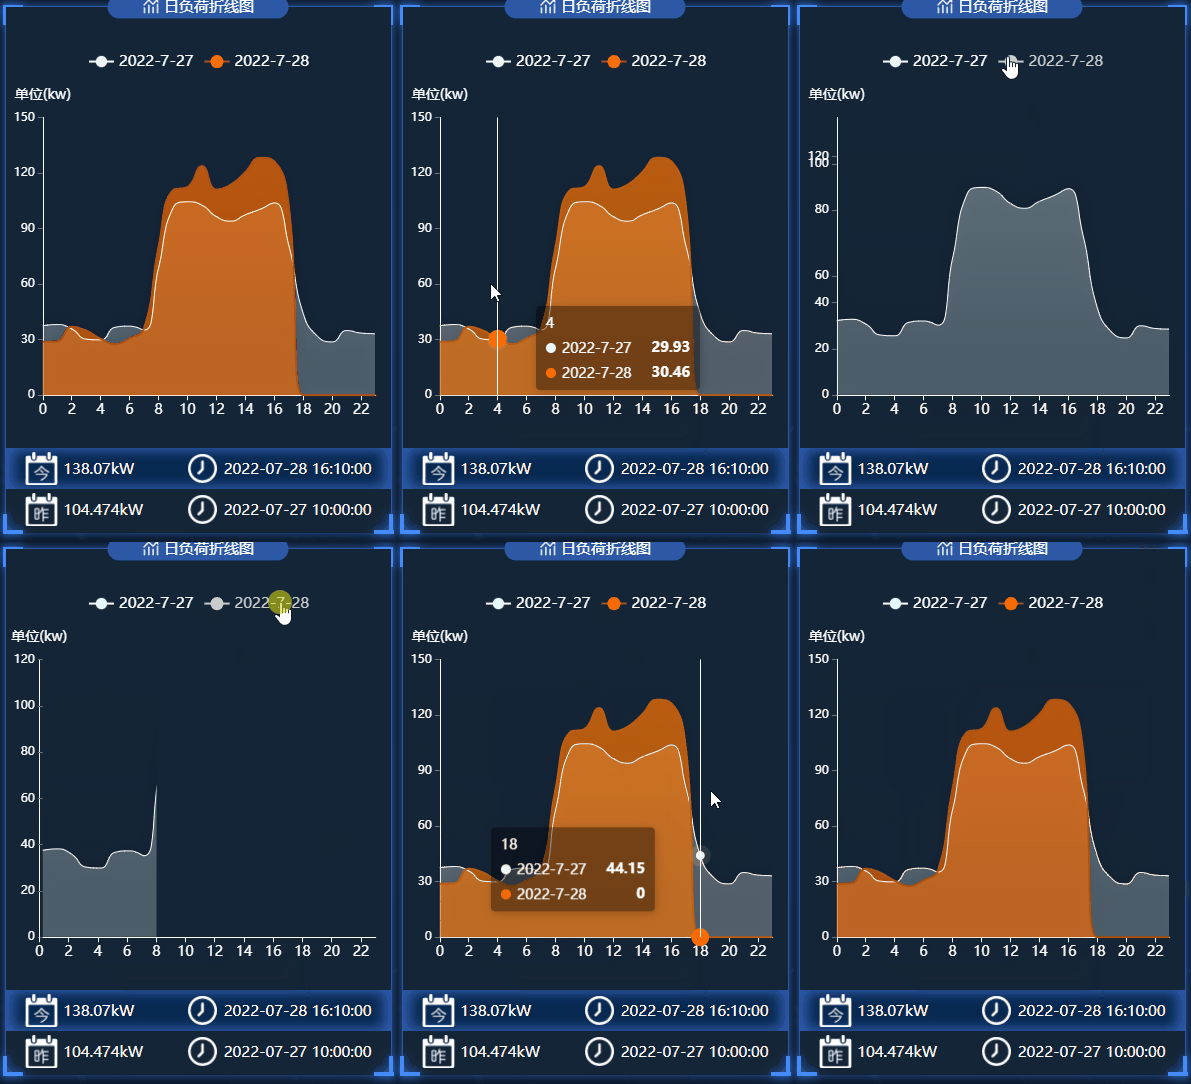
.vue文件代码如下:

?

1

2

3

4

5

6

7

8

9

10

11

12

13

14

15

16

17

18

19

20

21

22

23

24

25

26

27

28

29

30

31

32

33

34

35

36

37

38

39

40

41

42

43

44

45

46

47

48

49

50

51

52

53

54

55

56

57

58

59

60

61

62

63

64

65

66

67

68

69

70

71

72

73

74

75

76

77

78

79

80

81

82

83

84

85

86

87

88

89

90

91

92

93

94

95

96

97

98

99

100

101

102

103

104

105

106

107

108

109

110

111

112

113

114

115

116

117

118

119

120

121

122

123

124

125

126

127

128

129

130

131

132

133

134

135

136

137

138

139

140

141

142

143

144

145

146

147

148

149

150

151

152

153

154

155

156

157

158

159

160

161

162

163

164

165

166

167

168

169

170

171

172

173

174

175

176

177

178

179

180

181

182

183

184

185

186

187

188

189

190

191

192

193

194

195

196

197

198

199

200

201

202

203

204

205

206

207

208

209

210

211

212

213

214

215

216

217

218

219

220

221

222

223

224

225

226

227

228

229

230

231

232

233

234

235

236

237

238

239

240

241

242

243

244

245

246

247

248

249

250

251

252

253

254

255

256

257

258

259

260

261

262

263

264

265

266

267

268

269

270

271

272

273

274

275

276

277

278

279

280

281

282

283

284

285

286

287

288

289

290

291

292

293

294

295

296

297

298

299

300

301

302

303

304

305

306

307

308

309

310

311

312

313

314

315

316

317

318

319

320

321

322

323

<template>

  <div class="dailyLoad">

    <charts :title="'日负荷折线图'" :iconClass="'icon-tongji'">

      <template slot="detail">

        <div id="dailyLoad" ref="dailyLoad"></div>

        <div class="detail">

          <div class="today">

            <div class="mount">

              <img

                src="@/assets/images/survey_images/survey/today.png"

                alt=""

              />

              <div v-if="allData">{{ allData.power.max_w_today }}</div>

            </div>

            <div class="time">

              <img src="@/assets/images/survey_images/survey/time.png" alt="" />

              <div>

                <span v-if="allData">{{ allData.power.time_today }}</span>

              </div>

            </div>

          </div>

          <div class="yesterday">

            <div class="mount">

              <img

                src="@/assets/images/survey_images/survey/yesterday.png"

                alt=""

              />

              <div v-if="allData">{{ allData.power.max_w_yesterday }}</div>

            </div>

            <div class="time">

              <img src="@/assets/images/survey_images/survey/time.png" alt="" />

              <div>

                <span v-if="allData">{{ allData.power.time_yesterday }}</span>

              </div>

            </div>

          </div>

        </div>

      </template>

    </charts>

  </div>

</template>

<script>

// import { getDailyLoad } from "@/api/survey/surgey";

export default {

  name: "dailyLoad",

  data() {

    return {

      chartInstance: null,

      allData: null, //从服务器中获取的所有的数据

    };

  },

  props: ["data1"],

  mounted() {

    this.initChart();

    // this.getData();

  },

  watch: {

    data1(newVal, oldVal) {

      if (newVal) {

        this.allData = newVal;

        this.updateChart();

      }

    },

  },

  methods: {

    // 初始化图表

    initChart() {

      this.chartInstance = this.$echarts.init(this.$refs.dailyLoad, "saibei");

      const initOption = {};

      this.chartInstance.setOption(initOption);

      window.addEventListener("resize", () => {

        this.chartInstance.resize();

      });

    },

    // 从服务器获取数据

    // async getData() {

    //   console.log(this.data1);

    // },

    //更新数据

    updateChart() {

      var option = {

        //   //最上方的图例指示器

        legend: {

          top: "8%",

          data: [],

          // data: ["2022-3-31", "2022-4-1"],

          textStyle: {

            color: "white",

            fontSize: "15",

          },

        },

        // 图表的位置

        grid: {

          left: "2%",

          top: "21%",

          right: "4%",

          bottom: "22%",

          containLabel: true,

        },

        //设置悬浮框

        tooltip: {

          trigger: "axis",

          //在这里设置鼠标放上去显示的y轴的样式

          axisPointer: {

            type: "line",

            lineStyle: {

              type: "solid",

            },

          },

          backgroundColor: "rgba(0,0,0,.4)",

          borderWidth: 0,

          textStyle: {

            color: "#fff",

          },

        },

        xAxis: [

          {

            type: "category",

            boundaryGap: false,

            // x轴更换数据

            data: [],

            axisLabel: {

              color: "white",

              fontSize: 14,

            },

            axisLine: {

              lineStyle: {

                color: "white",

              },

            },

          },

        ],

        yAxis: [

          {

            name: "单位(kw)",

            nameLocation: "end",

            nameTextStyle: {

              padding: [0, 10, 0, 0],

              align: "center",

            },

            type: "value",

            axisTick: { show: true },

            axisLine: {

              onZeor: true,

              show: true,

              lineStyle: {

                color: "white",

              },

            },

            nameTextStyle: {

              fontSize: 14,

            },

            // 去除分割线

            splitLine: {

              show: false,

            },

          },

        ],

        series: [

          {

            name: "",

            type: "line",

            smooth: true,

            // 单独修改当前线条的样式

            lineStyle: {

              color: "white",

              width: "1",

            },

            // 填充颜色设置

            areaStyle: {

              color: new this.$echarts.graphic.LinearGradient(

                0,

                0,

                0,

                1,

                [

                  {

                    offset: 0,

                    color: "rgba(226, 247, 250, 0.5)",

                  },

                  {

                    offset: 0.8,

                    color: "rgba(226, 247, 250, 0.4)",

                  },

                ],

                false

              ),

              shadowColor: "rgba(0, 0, 0, 0.5)",

              shadowBlur: 15,

            },

            // 设置拐点

            symbol: "circle",

            // 拐点大小

            symbolSize: 8,

            // 开始不显示拐点, 鼠标经过显示

            showSymbol: false,

            // 设置拐点颜色以及边框

            itemStyle: {

              color: "rgb(226, 247, 250 )",

              borderColor: "rgba(226, 247, 250, 0.1)",

              borderWidth: 12,

            },

            data: [],

          },

          {

            name: "",

            type: "line",

            smooth: true,

            lineStyle: {

              color: "rgb(174,83,17)",

              width: 2,

            },

            areaStyle: {

              color: new this.$echarts.graphic.LinearGradient(

                0,

                0,

                0,

                1,

                [

                  {

                    offset: 0,

                    color: "rgba(255, 108, 0, 1)",

                  },

                  {

                    offset: 0.8,

                    color: "rgba(255, 108, 0, 0.9)",

                  },

                ],

                false

              ),

              shadowColor: "rgba(0, 0, 0, 0.1)",

              shadowBlur: 15,

            },

            // 设置拐点 小圆点

            symbol: "circle",

            // 拐点大小

            symbolSize: 2,

            // 设置拐点颜色以及边框

            itemStyle: {

              color: "rgba(255, 108, 0)",

              borderColor: "rgba(255, 108, 0,1)",

              borderWidth: 12,

            },

            // 开始不显示拐点, 鼠标经过显示

            showSymbol: false,

            data: [],

          },

        ],

      };

      let currentDate = this.formateDate(new Date());

      let lastDate = this.formateDate(Date.now() - 1000 * 60 * 60 * 24);

      option.legend.data = [lastDate, currentDate];

      option.xAxis[0].data = this.allData.hours;

      option.series[0].name = lastDate;

      option.series[0].data = this.allData.load_yesterday;

      option.series[1].name = currentDate;

      option.series[1].data = this.allData.load_today;

      this.chartInstance.setOption(option);

    },

    formateDate(data) {

      let date = new Date(data);

      return `${date.getFullYear()}-${date.getMonth() + 1}-${date.getDate()}`;

    },

  },

};

</script>

<style lang="less" scoped>

.dailyLoad {

  background-color: rgb(20, 37, 55);

  height: 3.3684rem;

  #dailyLoad {

    width: 100%;

    height: 3.3684rem;

  }

  .detail {

    position: absolute;

    width: 100%;

    height: 0.5263rem;

    bottom: 0.0105rem;

    left: 0;

    font-size: 0.0947rem;

    color: white;

    background-color: rgb(20, 37, 55);

    margin-top: 0.0526rem;

    .today,

    .yesterday {

      font-size: 0.1rem;

      height: 0.2632rem;

      display: flex;

      padding: 0 5%;

      align-items: center;

      white-space: nowrap;

      text-align: center;

      justify-content: space-between;

      .mount {

        display: flex;

        align-items: center;

        justify-content: center;

        img {

          width: 0.2105rem;

          height: 0.2105rem;

          margin-right: 0.0333rem;

        }

      }

      .time {

        display: flex;

        align-items: center;

        justify-content: center;

        img {

          width: 0.2105rem;

          height: 0.2105rem;

          margin-right: 0.0333rem;

        }

      }

    }

    .today {

      background-color: #072951;

      box-shadow: -0.0526rem 0px 0.0789rem #2c58a6 inset,

        /*左边阴影*/ 0.0526rem 0px 0.0789rem #2c58a6 inset;

    }

  }

}

</style>

最大需求表

在这个图表中,大家可以学会如何自定义柱状图的形状

.vue文件代码如下:

?

1

2

3

4

5

6

7

8

9

10

11

12

13

14

15

16

17

18

19

20

21

22

23

24

25

26

27

28

29

30

31

32

33

34

35

36

37

38

39

40

41

42

43

44

45

46

47

48

49

50

51

52

53

54

55

56

57

58

59

60

61

62

63

64

65

66

67

68

69

70

71

72

73

74

75

76

77

78

79

80

81

82

83

84

85

86

87

88

89

90

91

92

93

94

95

96

97

98

99

100

101

102

103

104

105

106

107

108

109

110

111

112

113

114

115

116

117

118

119

120

121

122

123

124

125

126

127

128

129

130

131

132

133

134

135

136

137

138

139

140

141

142

143

144

145

146

147

148

149

150

151

152

153

154

155

156

157

158

159

160

161

162

163

164

165

166

167

168

169

170

171

172

173

174

175

176

177

178

179

180

181

182

183

184

185

186

187

188

189

190

191

192

193

194

195

196

197

198

199

200

201

202

203

204

205

206

207

208

209

210

211

212

213

214

215

216

217

218

219

220

221

222

223

224

225

226

227

228

229

230

231

232

233

234

235

236

237

238

239

240

241

242

243

244

245

246

247

248

249

250

251

252

253

254

255

256

257

<template>

  <div class="maximumDemand">

    <charts :title="'最大需求'" :iconClass="'icon-shuxingzujian'">

      <template slot="detail">

        <div id="maximumDemand" ref="maximumDemand"></div>

        <div class="detail">

          <div class="item">

            <img

              src="@/assets/images/survey_images/survey/month.png"

              alt="月"

            />

            <div v-if="allData" class="maxdemand_month">

              {{ allData.demand_max.maxdemand_month }}kW

            </div>

          </div>

          <div class="item">

            <img src="@/assets/images/survey_images/survey/year.png" alt="年" />

            <div v-if="allData" class="maxdemand_Year">

              {{ allData.demand_max.maxdemand_Year }}kW

            </div>

          </div>

        </div>

      </template>

    </charts>

  </div>

</template>

<script>

import { getMaximumDemand } from "@/api/surgey";

export default {

  name: "maximumDemand",

  data() {

    return {

      chartInstance: null,

      allData: null, //从服务器中获取的所有的数据

    };

  },

  mounted() {

    this.initChart();

    this.getData();

    this.timer = setInterval(() => {

      this.getData();

    }, 60000);

  },

  methods: {

    // 初始化图表

    initChart() {

      this.chartInstance = this.$echarts.init(

        this.$refs.maximumDemand,

        "saibei"

      );

      const initOption = {};

      this.chartInstance.setOption(initOption);

      // 让图表跟随屏幕自动的去适应

      window.addEventListener("resize", () => {

        this.chartInstance.resize();

      });

    },

    // 从服务器获取数据

    async getData() {

      let res = await getMaximumDemand({});

      if (res.code === 200) {

        this.allData = res.data.demand;

        this.updateChart();

      } else {

        this.$message({

          message: res.msg,

          type: "warning",

        });

      }

    },

    //更新数据

    updateChart() {

      var option = {

        //提示内容样式的设置

        tooltip: {

          trigger: "axis",

          // 纵轴的刻度线

          axisPointer: {

            type: "none",

          },

          backgroundColor: "rgba(0,0,0,.4)",

          borderWidth: 0,

          textStyle: {

            color: "#fff",

          },

        },

        // 图表的位置

        grid: {

          left: "2%",

          top: "21%",

          right: "4%",

          bottom: "22%",

          containLabel: true,

        },

        xAxis: [

          {

            type: "category",

            data: [],

            // data: [

            //   "2021-11",

            //   "2021-12",

            //   "2022-01",

            //   "2022-02",

            //   "2022-03",

            //   "2022-04",

            // ],

            position: "bottom",

            boundaryGap: true,

            axisTick: { show: true, lineStyle: { color: "#fff" } },

            axisLine: {

              show: true,

              lineStyle: { color: "#fff" },

            },

            axisLabel: {

              interval: 0,

              // textStyle: { color: "#fff" },

              color: "#fff",

            },

          },

        ],

        yAxis: [

          {

            type: "value",

            axisLine: {

              onZeor: true,

              show: true,

              lineStyle: {

                color: "white",

              },

            },

            //坐标轴刻度相关设置

            axisTick: {

              show: true,

              lineStyle: {

                color: "#fff",

              },

            },

          },

        ],

        series: [

          {

            name: "最大需求:",

            type: "pictorialBar",

            symbol: "triangle",

            // data: [120, 132, 101, 134, 90, 201],

            data: [

              {

                value: "",

              },

              {

                value: "",

                itemStyle: {

                  color: "#4f75e1",

                },

              },

              {

                value: "",

              },

              {

                value: "",

                itemStyle: {

                  color: "#4f75e1",

                },

              },

              {

                value: "",

              },

              {

                value: "",

                itemStyle: {

                  color: "#4f75e1",

                },

              },

            ],

            barWidth: 15,

            //设置柱状图和土里指示器的颜色

            itemStyle: {

              color: "#b3c6ff",

              opacity: 0.9,

            },

            // 高亮时的样式

            emphasis: {

              itemStyle: {

                opacity: 0.8,

              },

            },

            // 三角形的宽度

            barWidth: "200%",

          },

          {

            name: "平均需求:",

            type: "line",

            // data: [810, 592, 952, 285, 523, 299],

            symbolSize: 12,

            //线条的颜色

            lineStyle: {

              color: "rgb(99,46,255)",

              width: 2,

            },

            //拐点的样式

            itemStyle: {

              color: "white",

              shadowBlur: 5,

              shadowColor: "white",

              borderColor: "white",

              borderWidth: 2,

              borderType: "dotted",

            },

          },

        ],

      };

      for (var i = 0; i < this.allData.demand_demand.length; i++) {

        option.series[0]["data"][i].value = this.allData.demand_demand[i];

      }

      option.series[1]["data"] = this.allData.demand_avg;

      option.xAxis[0]["data"] = this.allData.demand_ym;

      this.chartInstance.setOption(option);

    },

  },

  beforeDestroy() {

    clearInterval(this.timer);

  },

};

</script>

<style lang="less" scoped>

#maximumDemand {

  width: 100%;

  height: 100%;

}

.detail {

  position: absolute;

  // height: 100px;

  height: 0.5263rem;

  bottom: 0.1133rem;

  left: 0;

  width: 100%;

  font-size: 0.1rem;

  color: white;

  background-color: rgb(20, 37, 55);

  .item {

    display: flex;

    align-items: center;

    justify-content: space-around;

    background-color: #072951;

    height: 0.3rem;

    &:nth-child(1) {

      box-shadow: -0.0526rem 0px 0.0789rem #2c58a6 inset,

        /*左边阴影*/ 0.0526rem 0px 0.0789rem #2c58a6 inset;

    }

    img {

      display: block;

      width: 0.3333rem;

      height: 0.3333rem;

    }

  }

}

</style>

柱状图

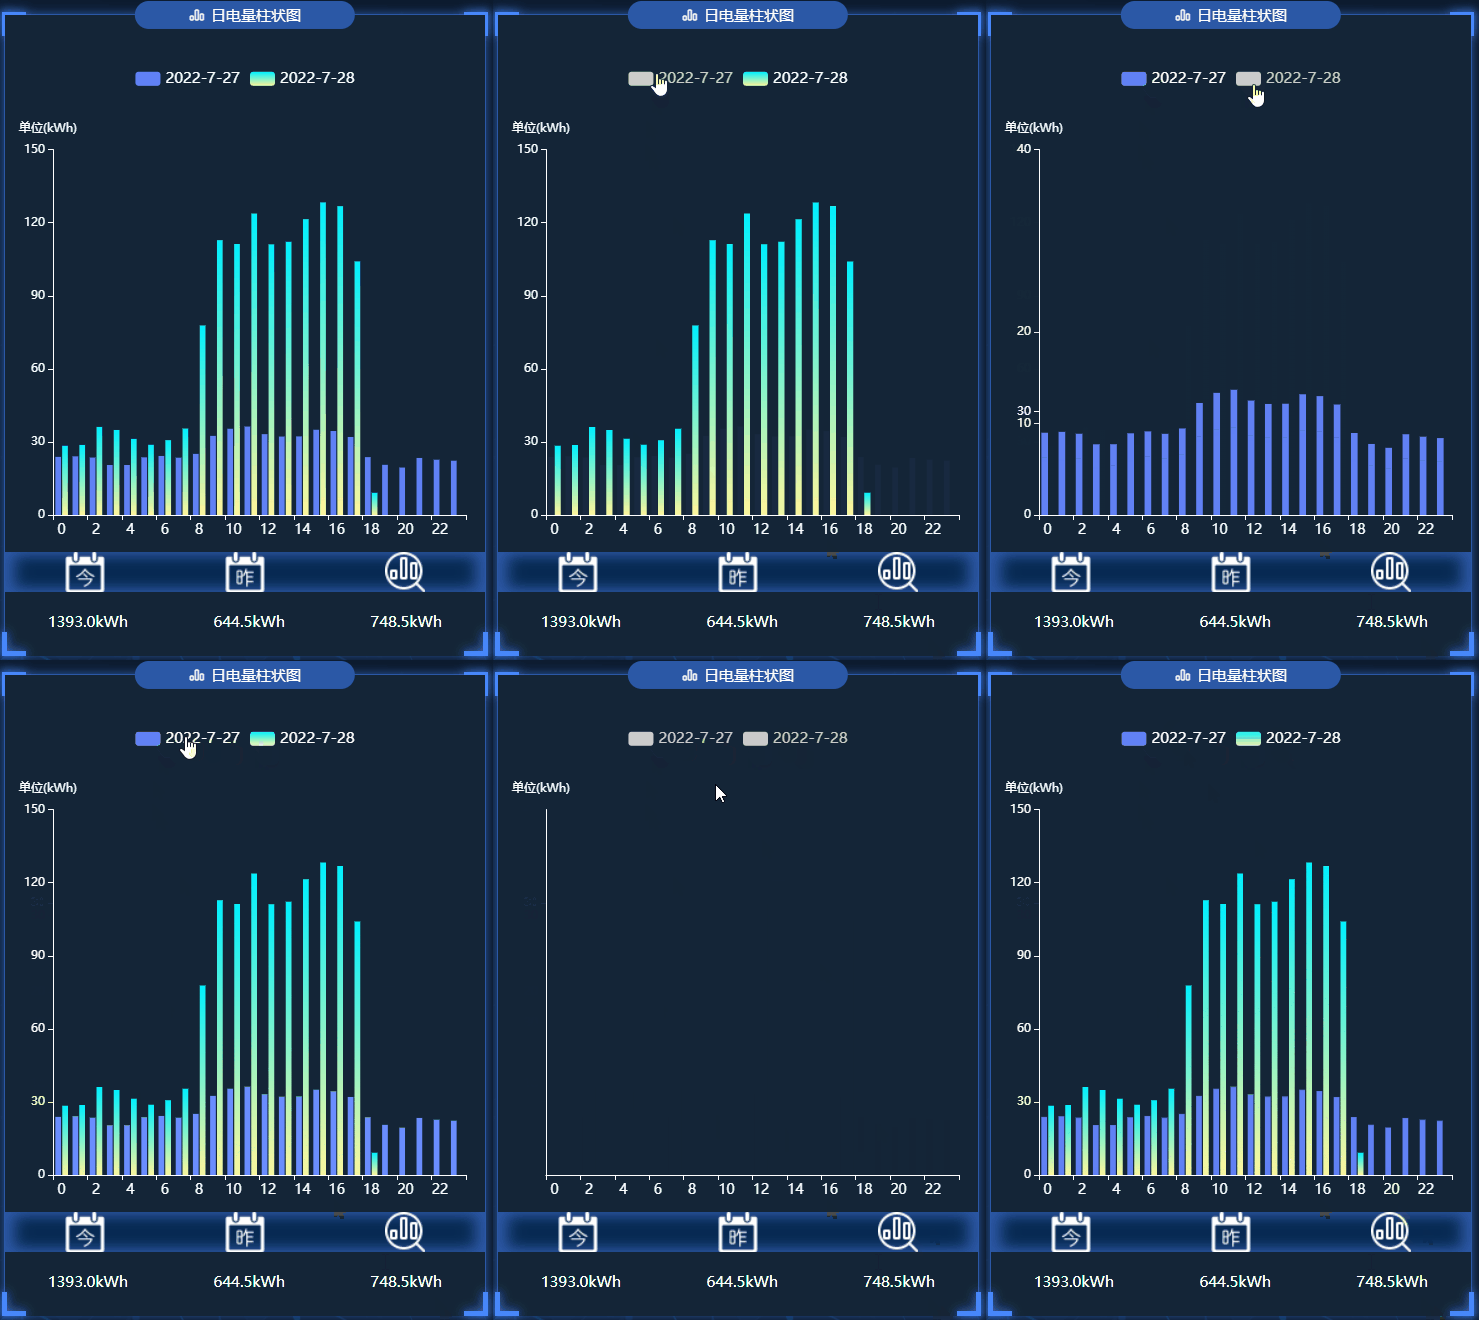
日电量柱状图

在这个图表中,大家可以学会如何自定义柱状图的渐变颜色

.vue文件代码如下:

?

1

2

3

4

5

6

7

8

9

10

11

12

13

14

15

16

17

18

19

20

21

22

23

24

25

26

27

28

29

30

31

32

33

34

35

36

37

38

39

40

41

42

43

44

45

46

47

48

49

50

51

52

53

54

55

56

57

58

59

60

61

62

63

64

65

66

67

68

69

70

71

72

73

74

75

76

77

78

79

80

81

82

83

84

85

86

87

88

89

90

91

92

93

94

95

96

97

98

99

100

101

102

103

104

105

106

107

108

109

110

111

112

113

114

115

116

117

118

119

120

121

122

123

124

125

126

127

128

129

130

131

132

133

134

135

136

137

138

139

140

141

142

143

144

145

146

147

148

149

150

151

152

153

154

155

156

157

158

159

160

161

162

163

164

165

166

167

168

169

170

171

172

173

174

175

176

177

178

179

180

181

182

183

184

185

186

187

188

189

190

191

192

193

194

195

196

197

198

199

200

201

202

203

204

205

206

207

208

209

210

211

212

213

214

215

216

217

218

219

220

221

222

223

224

225

226

227

<template>

  <div class="dailyElectricity">

    <charts :title="'日电量柱状图'" :iconClass="'icon-paihangbang'">

      <template slot="detail">

        <div id="dailyElectricity" ref="dailyElectricity"></div>

        <div class="detail">

          <div class="img">

            <img

              src="@/assets/images/survey_images/survey/today.png"

              alt="今天"

            />

            <img

              src="@/assets/images/survey_images/survey/yesterday.png"

              alt="昨天"

            />

            <img

              src="@/assets/images/survey_images/survey/ydqushi.png"

              alt="趋势"

            />

          </div>

          <div class="data">

            <div v-if="allData" class="today">

              {{ allData.dl_trend.dl_today }}

            </div>

            <div v-if="allData" class="yesterday">

              {{ allData.dl_trend.dl_yesterday }}

            </div>

            <div v-if="allData" class="sub">

              {{ allData.dl_trend.dl_trendval }}

            </div>

          </div>

        </div>

      </template>

    </charts>

  </div>

</template>

<script>

// import { getDailyElectricity } from "@/api/survey/surgey";

export default {

  name: "dailyElectricity",

  data() {

    return {

      chartInstance: null,

      allData: null, //从服务器中获取的所有的数据

    };

  },

  props: ["data1"],

  mounted() {

    this.initChart();

    // this.getData();

  },

  watch: {

    data1(newVal, oldVal) {

      if (newVal) {

        this.allData = newVal;

        this.updateChart();

      }

    },

  },

  methods: {

    // 初始化图表

    initChart() {

      this.chartInstance = this.$echarts.init(

        this.$refs.dailyElectricity,

        "saibei"

      );

      const initOption = {};

      this.chartInstance.setOption(initOption);

      // 让图表跟随屏幕自动的去适应

      window.addEventListener("resize", () => {

        this.chartInstance.resize();

      });

    },

    // 从服务器获取数据

    // async getData() {

    //   let res = await getDailyElectricity({});

    //   if (res.code === 200) {

    //     this.allData = { ...res.data };

    //     this.updateChart();

    //   } else {

    //     this.$message({

    //       message: res.msg,

    //       type: "warning",

    //     });

    //   }

    // },

    //更新数据

    updateChart() {

      var option = {

        legend: {

          top: "8%",

          //将来要换data成活的

          // data: ["2022-4-2", "2022-4-3"],

          textStyle: {

            fontSize: "15",

          },

        },

        grid: {

          left: "10%",

          top: "21%",

          right: "4%",

          bottom: "22%",

          containLabel: false,

        },

        xAxis: [

          {

            type: "category",

            // data: [0, 2, 4, 6, 8, 10, 12, 14, 16, 18],

            axisLabel: {

              fontSize: 14,

            },

          },

        ],

        yAxis: [

          {

            type: "value",

            name: "单位(kWh)",

            nameLocation: "end",

            nameTextStyle: {

              padding: [0, 10, 0, 0],

              align: "center",

            },

            //坐标轴刻度相关设置

            axisTick: {

              show: true,

              lineStyle: {

                color: "#fff",

              },

            },

            axisLine: {

              show: true,

              lineStyle: {

                color: "white",

              },

            },

          },

        ],

        series: [

          {

            // name: "2022-4-2",

            // data: [120, 200, 150, 80, 70, 110, 130, 200, 150, 80],

            type: "bar",

            itemStyle: {

              color: "rgb(97,129,245)",

            },

          },

          {

            // name: "2022-4-3",

            // data: [80, 70, 110, 130, 120, 200, 150, 200, 150, 80],

            type: "bar",

            itemStyle: {

              color: new this.$echarts.graphic.LinearGradient(

                0,

                0,

                0,

                1,

                [

                  {

                    offset: 0,

                    color: "rgb(0,240,255)",

                  },

                  {

                    offset: 1,

                    color: "rgb(255,247,156)",

                  },

                ],

                false

              ),

            },

          },

        ],

      };

      let currentDate = this.formateDate(new Date());

      let lastDate = this.formateDate(Date.now() - 1000 * 60 * 60 * 24);

      option.legend.data = [lastDate, currentDate];

      option.xAxis[0].data = this.allData.hours;

      option.series[0].name = lastDate;

      option.series[0].data = this.allData.dl_yesterday;

      option.series[1].name = currentDate;

      option.series[1].data = this.allData.dl_today;

      this.chartInstance.setOption(option);

    },

    formateDate(data) {

      let date = new Date(data);

      return `${date.getFullYear()}-${date.getMonth() + 1}-${date.getDate()}`;

    },

  },

};

</script>

<style lang="less" scoped>

.dailyElectricity {

  height: 3.3684rem;

  #dailyElectricity {

    width: 100%;

    height: 3.3684rem;

  }

  .detail {

    position: absolute;

    height: 0.5263rem;

    bottom: 2px;

    left: 0;

    width: 100%;

    font-size: 0.1rem;

    color: white;

    background-color: rgb(20, 37, 55);

    .img {

      display: flex;

      // align-items: center;

      justify-content: space-around;

      background-color: #072951;

      box-shadow: -0.0526rem 0px 0.0789rem #2c58a6 inset,

        /*左边阴影*/ 0.0526rem 0px 0.0789rem #2c58a6 inset;

      img {

        display: block;

        width: 0.2105rem;

        height: 0.2105rem;

      }

    }

    .data {

      display: flex;

      // align-items: center;

      justify-content: space-around;

      margin-top: 0.1rem;

    }

  }

}

</style>

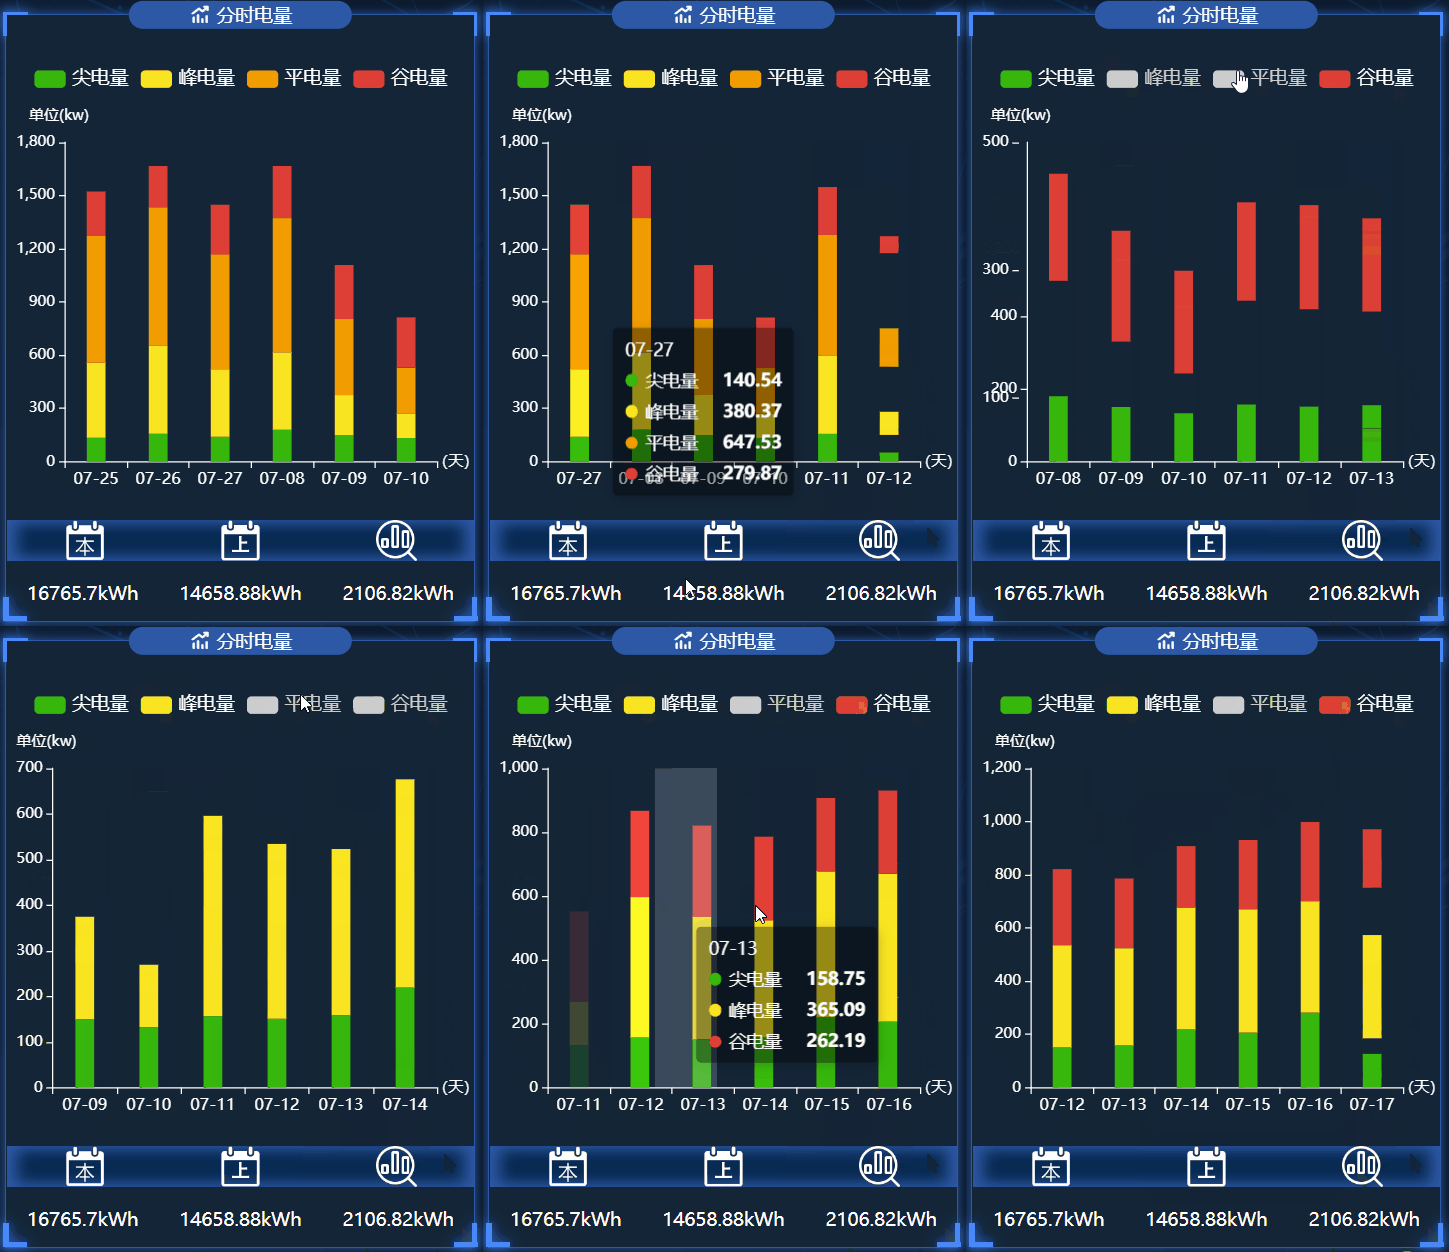
分时电量

在这个图表中,大家可以学会如何动态的轮流展示数据

.vue文件代码如下:

?

1

2

3

4

5

6

7

8

9

10

11

12

13

14

15

16

17

18

19

20

21

22

23

24

25

26

27

28

29

30

31

32

33

34

35

36

37

38

39

40

41

42

43

44

45

46

47

48

49

50

51

52

53

54

55

56

57

58

59

60

61

62

63

64

65

66

67

68

69

70

71

72

73

74

75

76

77

78

79

80

81

82

83

84

85

86

87

88

89

90

91

92

93

94

95

96

97

98

99

100

101

102

103

104

105

106

107

108

109

110

111

112

113

114

115

116

117

118

119

120

121

122

123

124

125

126

127

128

129

130

131

132

133

134

135

136

137

138

139

140

141

142

143

144

145

146

147

148

149

150

151

152

153

154

155

156

157

158

159

160

161

162

163

164

165

166

167

168

169

170

171

172

173

174

175

176

177

178

179

180

181

182

183

184

185

186

187

188

189

190

191

192

193

194

195

196

197

198

199

200

201

202

203

204

205

206

207

208

209

210

211

212

213

214

215

216

217

218

219

220

221

222

223

224

225

226

227

228

229

230

231

232

233

234

235

236

237

238

239

240

241

242

243

244

245

246

247

248

249

250

251

252

253

254

255

256

257

258

259

260

261

262

263

264

265

266

267

268

269

270

271

272

273

274

275

276

277

278

279

280

281

282

283

284

285

286

287

288

289

290

291

292

293

294

295

296

297

298

299

300

301

302

303

304

305

306

307

308

309

310

311

312

313

314

315

316

317

318

319

320

<template>

  <div class="timeSharingE">

    <charts :title="'分时电量'" :iconClass="'icon-fenxi'">

      <template slot="detail">

        <div id="timeSharingE" ref="timeSharingE"></div>

        <div class="detail">

          <div class="img">

            <img

              src="@/assets/images/survey_images/survey/current.png"

              alt="今天"

            />

            <img

              src="@/assets/images/survey_images/survey/last.png"

              alt="昨天"

            />

            <img

              src="@/assets/images/survey_images/survey/ydqushi.png"

              alt="趋势"

            />

          </div>

          <div class="data">

            <div v-if="loadrate" class="current">

              {{ loadrate.sum_e_month }}

            </div>

            <div v-if="loadrate" class="last">

              {{ loadrate.sum_e_lastmonth }}

            </div>

            <div v-if="loadrate" class="ydqushi">

              {{ loadrate.trend_m_sume }}

            </div>

          </div>

        </div>

      </template>

    </charts>

  </div>

</template>

<script>

import { getTimeSharingE } from "@/api/surgey";

export default {

  name: "timeSharingE",

  data() {

    return {

      chartInstance: null,

      idx: 0, //当前的索引

      arr1: [], //所有的日期

      arr2: [], //所有的尖电量

      arr3: [], //所有的峰电量

      arr4: [], //所有的平电量

      arr5: [], //所有的谷电量

      arr_sub1: [] /* 当前的日期    */,

      arr_sub2: [] /* 当前的尖电量    */,

      arr_sub3: [] /* 当前的峰电量    */,

      arr_sub4: [] /* 当前的平电量    */,

      arr_sub5: [] /* 当前的谷电量    */,

      allData: [], //分时电量柱状图所有的数据

      loadrate: {},

    };

  },

  mounted() {

    this.initChart();

    this.getData();

    this.getDatatimer = setInterval(() => {

      this.getData();

    }, 60000);

  },

  methods: {

    initChart() {

      this.chartInstance = this.$echarts.init(

        this.$refs.timeSharingE,

        "saibei"

      );

      var option = {

        //设置悬浮框

        tooltip: {

          show: true,

          trigger: "axis",

          axisPointer: {

            type: "shadow",

          },

          backgroundColor: "rgba(0,0,0,.4)",

          borderWidth: 0,

          textStyle: {

            color: "#fff",

          },

        },

        //最上方的图例指示器

        legend: {

          top: "8%",

          textStyle: {

            color: "white",

            fontSize: "15",

          },

        },

        // 图表的位置

        grid: {

          left: "2%",

          top: "21%",

          right: "8%",

          bottom: "22%",

          containLabel: true,

        },

        xAxis: [

          {

            type: "category",

            data: this.arr_sub1,

            axisLabel: {

              fontSize: 13,

            },

            name: "(天)",

            nameLocation: "end",

            nameTextStyle: {

              align: "center",

            },

          },

        ],

        yAxis: [

          {

            axisTick: { show: true },

            type: "value",

            name: "单位(kw)",

            nameLocation: "end",

            nameTextStyle: {

              padding: [0, 10, 0, 0],

              align: "center",

            },

            axisLine: {

              onZeor: true,

              show: true,

              lineStyle: {

                color: "white",

              },

            },

            //坐标轴刻度相关设置

            axisTick: {

              show: true,

              lineStyle: {

                color: "#fff",

              },

            },

          },

        ],

        series: [

          {

            name: "尖电量",

            type: "bar",

            data: this.arr_sub2,

            // data: [120, 132, 101, 134, 90, 230, 210, 132, 101, 134, 90],

            stack: "Electric quantity",

            barWidth: 15,

            //设置柱状图和土里指示器的颜色

            itemStyle: {

              color: "rgb(55,183,12)",

            },

          },

          {

            name: "峰电量",

            type: "bar",

            data: this.arr_sub3,

            // data: [134, 90, 230, 120, 132, 101, 210, 230, 120, 132],

            stack: "Electric quantity",

            barWidth: 15,

            //设置柱状图和土里指示器的颜色

            itemStyle: {

              color: "rgb(250,229,33)",

            },

          },

          {

            name: "平电量",

            type: "bar",

            data: this.arr_sub4,

            // data: [230, 210, 132, 90, 101, 134, 120, 210, 132, 90, 101],

            stack: "Electric quantity",

            barWidth: 15,

            //设置柱状图和土里指示器的颜色

            itemStyle: {

              color: "rgb(242,156,0)",

            },

          },

          {

            name: "谷电量",

            type: "bar",

            data: this.arr_sub5,

            // data: [120, 132, 101, 134, 90, 230, 210, 132, 101, 134, 90],

            stack: "Electric quantity",

            barWidth: 15,

            //设置柱状图和土里指示器的颜色

            itemStyle: {

              color: "rgb(221,63,54)",

            },

          },

        ],

      };

      option && this.chartInstance.setOption(option);

      this.startInterval();

      window.addEventListener("resize", this.chartResize);

    },

    async getData() {

      let res = await getTimeSharingE({});

      let mydata = [];

      if (res.code === 200) {

        mydata = res.data.dl_period;

        this.loadrate = res.data.loadrate;

        this.updateChart();

      } else {

        this.$message({

          message: res.msg,

          type: "warning",

        });

      }

      for (var i = 0; i < mydata.length; i++) {

        this.arr1.push(mydata[i].date); /* 日期   */

        this.arr2.push(mydata[i].fesharp); /* 尖   */

        this.arr3.push(mydata[i].fepeak); /* 峰   */

        this.arr4.push(mydata[i].feflat); /* 平   */

        this.arr5.push(mydata[i].fevalley); /* 谷   */

      }

      for (var i = 0; i < 5; i++) {

        this.arr_sub1.push(this.arr1[i]);

        this.arr_sub2.push(this.arr2[i]);

        this.arr_sub3.push(this.arr3[i]);

        this.arr_sub4.push(this.arr4[i]);

        this.arr_sub5.push(this.arr5[i]);

        this.idx = i;

      }

      this.allData = mydata;

    },

    startInterval() {

      this.timer = setInterval(() => {

        this.idx++;

        if (this.idx >= this.allData.length) {

          this.idx = 0;

        }

        this.arr_sub1.shift();

        this.arr_sub1.push(this.arr1[this.idx]);

        this.arr_sub2.shift();

        this.arr_sub2.push(this.arr2[this.idx]);

        this.arr_sub3.shift();

        this.arr_sub3.push(this.arr3[this.idx]);

        this.arr_sub4.shift();

        this.arr_sub4.push(this.arr4[this.idx]);

        this.arr_sub5.shift();

        this.arr_sub5.push(this.arr5[this.idx]);

        this.updateChart();

      }, 2000);

    },

    updateChart() {

      var option = {

        //区域缩放

        xAxis: {

          data: this.arr_sub1,

        },

        series: [

          {

            data: this.arr_sub2,

          },

          {

            data: this.arr_sub3,

          },

          {

            data: this.arr_sub4,

          },

          {

            data: this.arr_sub5,

          },

        ],

      };

      this.chartInstance && this.chartInstance.setOption(option);

    },

    // 让图表跟随屏幕自动的去适应

    chartResize() {

      this.chartInstance.resize();

    },

  },

  beforeDestroy() {

    clearInterval(this.timer);

    clearInterval(this.getDatatimer);

    // 让图表跟随屏幕自动的去适应

    window.removeEventListener("resize", this.chartResize);

  },

};

</script>

<style lang="less" scoped>

.timeSharingE {

  margin-top: 0.1842rem;

  background-color: rgb(20, 37, 55);

  #timeSharingE {

    width: 100%;

    height: 3.1579rem;

  }

  .detail {

    position: absolute;

    height: 0.5263rem;

    bottom: 0;

    left: 0;

    width: 100%;

    font-size: 0.1rem;

    color: white;

    background-color: rgb(20, 37, 55);

    .img {

      display: flex;

      // align-items: center;

      justify-content: space-around;

      background-color: #072951;

      box-shadow: -0.0526rem 0px 0.0789rem #2c58a6 inset,

        /*左边阴影*/ 0.0526rem 0px 0.0789rem #2c58a6 inset;

      img {

        display: block;

        width: 0.2105rem;

        height: 0.2105rem;

      }

    }

    .data {

      display: flex;

      // align-items: center;

      justify-content: space-around;

      margin-top: 0.1rem;

    }

  }

}

</style>

功率因数

在这个图表中,大家可以学会如何将柱状图进行非常个性化的定制

.vue文件代码如下:

?

1

2

3

4

5

6

7

8

9

10

11

12

13

14

15

16

17

18

19

20

21

22

23

24

25

26

27

28

29

30

31

32

33

34

35

36

37

38

39

40

41

42

43

44

45

46

47

48

49

50

51

52

53

54

55

56

57

58

59

60

61

62

63

64

65

66

67

68

69

70

71

72

73

74

75

76

77

78

79

80

81

82

83

84

85

86

87

88

89

90

91

92

93

94

95

96

97

98

99

100

101

102

103

104

105

106

107

108

109

110

111

112

113

114

115

116

117

118

119

120

121

122

123

124

125

126

127

128

129

130

131

132

133

134

135

136

137

138

139

140

141

142

143

144

145

146

147

148

149

150

151

152

153

154

155

156

157

158

159

160

161

162

163

164

165

166

167

168

169

170

171

172

173

174

175

176

177

178

179

180

181

182

183

184

185

186

187

188

189

190

191

192

<template>

  <div class="powerFactor">

    <charts :title="'功率因数'" :iconClass="'icon-paihangbang'">

      <template slot="detail">

        <div id="powerFactor" ref="powerFactor"></div>

      </template>

    </charts>

  </div>

</template>

<script>

import { getPowerFactor } from "@/api/surgey";

export default {

  name: "powerFactor",

  data() {

    return {

      chartInstance: null,

      myColor: [

        "rgb(248,180,72)",

        "rgb(86,208,227)",

        "rgb(245,116,116)",

        "rgb(16,137,231)",

      ],

      allData: [],

      arr_sub: [],

      titlename: ["A相", "B相", "C相", "合相"],

      valdata: [1.0, 1.0, 1.0, 1.0],

      idx: 0,

      arr6: [],

    };

  },

  mounted() {

    this.initChart();

    this.getData();

    this.getDataTimer = setInterval(() => {

      this.getData();

    }, 60000);

  },

  methods: {

    initChart() {

      this.chartInstance = this.$echarts.init(this.$refs.powerFactor, "saibei");

      var option = {

        grid: {

          left: "5%",

          top: "21%",

          right: "10%",

          bottom: "5%",

          containLabel: true,

        },

        // 不显示x轴的相关信息

        xAxis: {

          show: false,

        },

        yAxis: [

          {

            type: "category",

            inverse: true,

            data: this.titlename,

            // 不显示y轴的线

            axisLine: {

              show: false,

            },

            // 不显示刻度

            axisTick: {

              show: false,

            },

          },

          {

            data: ["1.0", "1.0", "1.0", "1.0"],

            inverse: true,

            // 不显示y轴的线

            axisLine: {

              show: false,

            },

            // 不显示刻度

            axisTick: {

              show: false,

            },

          },

        ],

        series: [

          {

            name: "条",

            type: "bar",

            data: [0.7112, 0.3424, 0.6054, 0.7858],

            yAxisIndex: 0,

            // 修改第一组柱子的圆角

            itemStyle: {

              borderRadius: 20,

              color: (params) => {

                return this.myColor[params.dataIndex];

              },

            },

            // 柱子之间的距离

            // barCategoryGap: 50,

            //柱子的宽度

            barWidth: 10,

            // 显示柱子内的文字

            label: {

              show: true,

              position: "inside",

              color: "white",

            },

          },

          {

            name: "框",

            type: "bar",

            // barCategoryGap: 50,

            barWidth: 15,

            yAxisIndex: 1,

            data: this.valdata,

            itemStyle: {

              color: "none",

              borderColor: "#00c1de",

              borderWidth: 3,

              borderRadius: 15,

            },

          },

        ],

      };

      option && this.chartInstance.setOption(option);

      this.startInterval();

      // 让图表跟随屏幕自动的去适应

      window.addEventListener("resize", this.chartResize);

    },

    async getData() {

      let res = await getPowerFactor({});

      if (res.code === 200) {

        this.allData = res.data.cositems;

        // this.updateChart();

        var arr6 = [];

        var idx = 0;

        var arr_sub = [];

        for (var i = 0; i < this.allData.length; i++) {

          arr6.push(this.allData[i].fcosa.toFixed(3));

          arr6.push(this.allData[i].fcosb.toFixed(3));

          arr6.push(this.allData[i].fcosc.toFixed(3));

          arr6.push(this.allData[i].fcos.toFixed(3));

        }

        for (var i = 0; i < 4; i++) {

          arr_sub.push(arr6[4 * idx + i]);

        }

        this.arr_sub = arr_sub;

        this.arr6 = arr6;

        this.idx = idx;

      } else {

        this.$message({

          message: res.msg,

          type: "warning",

        });

      }

    },

    startInterval() {

      this.timer = setInterval(() => {

        this.idx++;

        if (this.idx >= this.allData.length) {

          this.idx = 0;

        }

        for (var i = 0; i < 4; i++) {

          this.arr_sub.shift();

          this.arr_sub.push(this.arr6[4 * this.idx + i]);

        }

        this.updateChart();

      }, 2000);

    },

    updateChart() {

      var option = {

        series: [

          {

            data: this.arr_sub,

          },

        ],

      };

      this.chartInstance && this.chartInstance.setOption(option);

    },

    // 让图表跟随屏幕自动的去适应

    chartResize() {

      this.chartInstance.resize();

    },

  },

  beforeDestroy() {

    clearInterval(this.timer);

    clearInterval(this.getDataTimer);

    window.removeEventListener("resize", this.chartResize);

  },

};

</script>

<style lang="less" scoped>

#powerFactor {

  width: 100%;

  height: 100%;

}

</style>

三相温度

在这个图表中,大家可以学会visualMap属性的使用,以及图表内容文字的格式化

.vue文件代码如下:

?

1

2

3

4

5

6

7

8

9

10

11

12

13

14

15

16

17

18

19

20

21

22

23

24

25

26

27

28

29

30

31

32

33

34

35

36

37

38

39

40

41

42

43

44

45

46

47

48

49

50

51

52

53

54

55

56

57

58

59

60

61

62

63

64

65

66

67

68

69

70

71

72

73

74

75

76

77

78

79

80

81

82

83

84

85

86

87

88

89

90

91

92

93

94

95

96

97

98

99

100

101

102

103

104

105

106

107

108

109

110

111

112

113

114

115

116

117

118

119

120

121

122

123

124

125

126

127

128

129

130

131

132

133

134

135

136

137

138

139

140

141

142

143

144

145

146

147

148

149

150

151

152

153

154

155

156

157

158

159

160

161

162

163

164

165

166

167

168

169

170

171

172

173

174

175

176

177

178

179

180

181

182

183

184

185

186

187

188

189

190

191

192

193

194

195

196

197

198

199

200

201

202

203

204

205

206

207

208

209

210

211

212

213

214

215

216

217

218

219

220

221

222

223

224

225

226

227

228

229

230

231

232

233

234

235

236

237

238

239

240

241

242

243

244

245

246

247

248

249

250

<template>

  <div class="tPhaseTemperature">

    <charts :title="'三相温度'" :iconClass="'icon-tongji'">

      <template slot="detail">

        <div id="tPhaseTemperature" ref="tPhaseTemperature"></div>

      </template>

    </charts>

  </div>

</template>

<script>

import { getTPhaseTemperature } from "@/api/surgey";

export default {

  name: "tPhaseTemperature",

  data() {

    return {

      currentIndex: 0,

      chartInstance: null,

      allData: null, //从服务器中获取的所有的数据

    };

  },

  mounted() {

    this.initChart();

    this.getData();

    this.getDataTimer = setInterval(() => {

      this.getData();

    }, 60000);

  },

  methods: {

    initChart() {

      this.chartInstance = this.$echarts.init(

        this.$refs.tPhaseTemperature,

        "saibei"

      );

      var option = {

        //设置悬浮框

        tooltip: {

          show: true,

          trigger: "axis",

          axisPointer: {

            type: "shadow",

          },

          backgroundColor: "rgba(0,0,0,.4)",

          borderWidth: 0,

          textStyle: {

            color: "#fff",

          },

        },

        xAxis: [

          {

            name: "(时)",

            type: "category",

            data: ["00-06", "06-12", "12-18", "18-24"],

            axisLabel: {

              fontSize: 14,

            },

          },

        ],

        yAxis: [

          {

            type: "value",

            name: "°C",

            nameLocation: "end",

            max: "50",

            nameTextStyle: {

              padding: [0, 10, 0, 0],

              align: "center",

            },

            //坐标轴刻度相关设置

            axisTick: {

              show: true,

              lineStyle: {

                color: "#fff",

              },

            },

            axisLine: {

              show: true,

              lineStyle: {

                color: "white",

              },

            },

            splitLine: {

              show: true,

              lineStyle: {

                color: "rgb(67,81,95)",

              },

            },

          },

        ],

        legend: {

          top: "8%",

          // data: ["2022-4-2", "2022-4-3"],

          textStyle: {

            fontSize: "14",

          },

        },

        grid: {

          left: "2%",

          top: "21%",

          right: "15%",

          bottom: "5%",

          containLabel: true,

        },

        series: [

          {

            name: "A相温度",

            data: [31, 32, 34, 36],

            type: "bar",

            barWidth: 15,

            itemStyle: {

              borderRadius: 20,

              color: new this.$echarts.graphic.LinearGradient(0, 0, 0, 1, [

                {

                  offset: 0,

                  color: "#fccb05",

                },

                {

                  offset: 1,

                  color: "#f5804d",

                },

              ]),

            },

            emphasis: {

              focus: "series",

            },

          },

          {

            name: "B相温度",

            data: [25, 35, 25, 28],

            type: "bar",

            barWidth: 15,

            itemStyle: {

              borderRadius: 20,

              color: new this.$echarts.graphic.LinearGradient(0, 0, 0, 1, [

                {

                  offset: 0,

                  color: "#8bd46e",

                },

                {

                  offset: 1,

                  color: "#09bcb7",

                },

              ]),

            },

            emphasis: {

              focus: "series",

            },

          },

          {

            name: "C相温度",

            data: [26, 34, 38, 30],

            type: "bar",

            barWidth: 15,

            itemStyle: {

              borderRadius: 20,

              color: new this.$echarts.graphic.LinearGradient(0, 0, 0, 1, [

                {

                  offset: 0,

                  color: "#F57474",

                },

                {

                  offset: 1,

                  color: "#F57474",

                },

              ]),

            },

            emphasis: {

              focus: "series",

            },

          },

        ],

      };

      option && this.chartInstance.setOption(option);

      this.startInterval();

      // 让图表跟随屏幕自动的去适应

      window.addEventListener("resize", this.chartResize);

    },

    // 从服务器获取数据

    async getData() {

      let res = await getTPhaseTemperature({});

      if (res.code === 200) {

        this.allData = res.data.temperature;

        this.updateChart();

      } else {

        this.$message({

          message: res.msg,

          type: "warning",

        });

      }

    },

    startInterval() {

      this.timer = setInterval(() => {

        // var dataLen = option.series[0].data.length;

        /*  取消之前高亮的图形  */

        // this.chartInstance.dispatchAction({

        //   type: "downplay",

        //   seriesIndex: [0, 1, 2],

        //   dataIndex: this.currentIndex,

        // });

        /*  显示 tooltip  */

        this.chartInstance.dispatchAction({

          type: "showTip",

          seriesIndex: 2, //指定哪一系列的数据,即seriesIndex.data[0]

          dataIndex: this.currentIndex,

        });

        /*  高亮当前图形  */

        this.chartInstance.dispatchAction({

          type: "highlight",

          seriesIndex: [0, 1, 2],

          dataIndex: this.currentIndex,

        });

        this.currentIndex = (this.currentIndex + 1) % 4;

      }, 2000);

    },

    updateChart() {

      var atemperature = this.allData.map((item) => item.fta);

      var btemperature = this.allData.map((item) => item.ftb);

      var ctemperature = this.allData.map((item) => item.ftc);

      var option = {

        series: [

          {

            data: atemperature,

          },

          {

            data: btemperature,

          },

          {

            data: ctemperature,

          },

        ],

      };

      this.chartInstance.setOption(option);

    },

    // 让图表跟随屏幕自动的去适应

    chartResize() {

      this.chartInstance.resize();

    },

  },

  beforeDestroy() {

    clearInterval(this.timer);

    clearInterval(this.getDataTimer);

    window.removeEventListener("resize", this.chartResize);

  },

};

</script>

<style lang="less" scoped>

#tPhaseTemperature {

  width: 100%;

  height: 100%;

}

</style>

水球图

年月日负荷率图

在这个图表中,大家可以学会如何绘制水球图

.vue文件代码如下:

?

1

2

3

4

5

6

7

8

9

10

11

12

13

14

15

16

17

18

19

20

21

22

23

24

25

26

27

28

29

30

31

32

33

34

35

36

37

38

39

40

41

42

43

44

45

46

47

48

49

50

51

52

53

54

55

56

57

58

59

60

61

62

63

64

65

66

67

68

69

70

71

72

73

74

75

76

77

78

79

80

81

82

83

84

85

86

87

88

89

90

91

92

93

94

95

96

97

98

99

100

101

102

103

104

105

106

107

108

109

110

111

112

113

114

115

116

117

118

119

120

121

122

123

124

125

126

127

128

129

130

131

132

133

134

135

136

137

138

139

140

141

142

143

144

145

146

147

148

149

150

151

152

153

154

155

156

157

158

159

160

161

162

163

164

165

166

167

168

169

170

171

172

173

174

175

176

177

178

179

180

181

182

183

184

185

186

187

188

189

190

191

192

193

194

195

196

197

198

199

200

201

202

203

204

205

206

207

208

209

210

211

212

213

214

215

216

217

218

219

220

221

222

223

224

225

226

227

228

229

230

231

232

233

234

235

236

237

238

239

240

241

242

243

244

<template>

  <div class="loadRate">

    <charts :title="'年月日负荷率表图'" :iconClass="'icon-yuanquanquan'">

      <template slot="detail">

        <div class="ymdLoadRate">

          <div id="dayLoadRate" ref="dayLoadRate"></div>

          <div id="mouthLoadRate" ref="mouthLoadRate"></div>

          <div id="yearLoadRate" ref="yearLoadRate"></div>

        </div>

        <div class="desc">

          <div class="descItem">日负荷率</div>

          <div class="descItem">月负荷率</div>

          <div class="descItem">年负荷率</div>

        </div>

        <div class="detail">

          <div class="img">

            <img

              src="@/assets/images/survey_images/survey/month.png"

              alt="月"

            />

            <img src="@/assets/images/survey_images/survey/year.png" alt="年" />

          </div>

          <div class="data">

            <div v-if="allData" class="today">

              {{ allData.loadrate.month_load_rate }}%

            </div>

            <div v-if="allData" class="yesterday">

              {{ allData.loadrate.year_load_rate }}%

            </div>

          </div>

        </div>

      </template>

    </charts>

  </div>

</template>

<script>

// import "@/assets/js/echarts-liquidfill";

import "@/assets/js/echarts-liquidfill.min.js";

import { getLoadRate } from "@/api/surgey";

export default {

  name: "loadRate",

  data() {

    return {

      chartInstanceD: null,

      chartInstanceM: null,

      chartInstanceL: null,

      allData: null, //从服务器中获取的所有的数据

    };

  },

  mounted() {

    this.initChart();

    this.getData();

    this.timer = setInterval(() => {

      this.getData();

    }, 60000);

  },

  methods: {

    // 初始化图表

    initChart() {

      this.chartInstanceD = this.$echarts.init(this.$refs.dayLoadRate);

      this.chartInstanceM = this.$echarts.init(this.$refs.mouthLoadRate);

      this.chartInstanceL = this.$echarts.init(this.$refs.yearLoadRate);

      const initOption = {};

      this.chartInstanceD.setOption(initOption);

      this.chartInstanceM.setOption(initOption);

      this.chartInstanceL.setOption(initOption);

      window.addEventListener("resize", () => {

        this.chartInstanceD.resize();

        this.chartInstanceM.resize();

        this.chartInstanceL.resize();

      });

    },

    // 从服务器获取数据

    async getData() {

      let res = await getLoadRate({});

      if (res.code == 200) {

        this.allData = { ...res.data };

        this.updateChart();

      } else {

        this.$message({

          message: res.msg,

          type: "warning",

        });

      }

    },

    //更新数据

    updateChart() {

      var optionD = {

        series: [

          {

            radius: "75%",

            type: "liquidFill",

            // data: [0.113, 0.12, 0.1, 0.11],

            name: "日负荷率",

            itemStyle: {

              opacity: 0.6,

            },

            emphasis: {

              itemStyle: {

                opacity: 0.9,

              },

            },

            outline: {

              show: false,

            },

            label: {

              fontSize: 33,

            },

            tooltip: {

              show: true,

            },

          },

        ],

      };

      var optionM = {

        series: [

          {

            radius: "75%",

            type: "liquidFill",

            // data: [0.61, 0.62, 0.6, 0.61],

            itemStyle: {

              opacity: 0.6,

            },

            name: "日负荷率",

            emphasis: {

              itemStyle: {

                opacity: 0.9,

              },

            },

            outline: {

              show: false,

            },

            label: {

              fontSize: 33,

            },

            tooltip: {

              show: true,

            },

          },

        ],

      };

      var optionL = {

        series: [

          {

            radius: "75%",

            type: "liquidFill",

            // data: [0.8, 0.81, 0.79, 0.8],

            itemStyle: {

              opacity: 0.6,

            },

            name: "日负荷率",

            emphasis: {

              itemStyle: {

                opacity: 0.9,

              },

            },

            outline: {

              show: false,

            },

            label: {

              fontSize: 33,

            },

            tooltip: {

              show: true,

            },

          },

        ],

      };

      var value1 = this.allData.loadrate.day_load_rate / 100;

      var value2 = this.allData.loadrate.month_load_rate / 100;

      var value3 = this.allData.loadrate.year_load_rate / 100;

      var data1 = [value1, value1, value1, value1];

      var data2 = [value2, value2, value2, value2];

      var data3 = [value3, value3, value3, value3];

      optionD.series[0].data = data1;

      optionM.series[0].data = data2;

      optionL.series[0].data = data3;

      this.chartInstanceD.setOption(optionD);

      this.chartInstanceM.setOption(optionM);

      this.chartInstanceL.setOption(optionL);

    },

  },

  beforeDestroy() {

    clearInterval(this.timer);

  },

};

</script>

<style lang="less" scoped>

.loadRate {

  margin-top: 0.1842rem;

  background-color: rgb(20, 37, 55);

  .ymdLoadRate {

    width: 100%;

    height: 3.1579rem;

    display: flex;

    #dayLoadRate {

      flex: 1;

    }

    #mouthLoadRate {

      flex: 1;

    }

    #yearLoadRate {

      flex: 1;

    }

  }

  .desc {

    width: 100%;

    position: absolute;

    top: 65%;

    left: 0;

    display: flex;

    align-items: center;

    justify-content: space-around;

    color: white;

  }

  .detail {

    position: absolute;

    height: 0.5263rem;

    bottom: 0.1133rem;

    left: 0;

    width: 100%;

    font-size: 0.1rem;

    color: white;

    background-color: rgb(20, 37, 55);

    .img {

      display: flex;

      justify-content: space-around;

      background-color: #072951;

      box-shadow: -0.0526rem 0px 0.0789rem #2c58a6 inset,

        /*左边阴影*/ 0.0526rem 0px 0.0789rem #2c58a6 inset;

      img {

        display: block;

        width: 0.3333rem;

        height: 0.3333rem;

      }

    }

    .data {

      display: flex;

      justify-content: space-around;

      margin-top: 0.1rem;

    }

  }

}

</style>

散点图

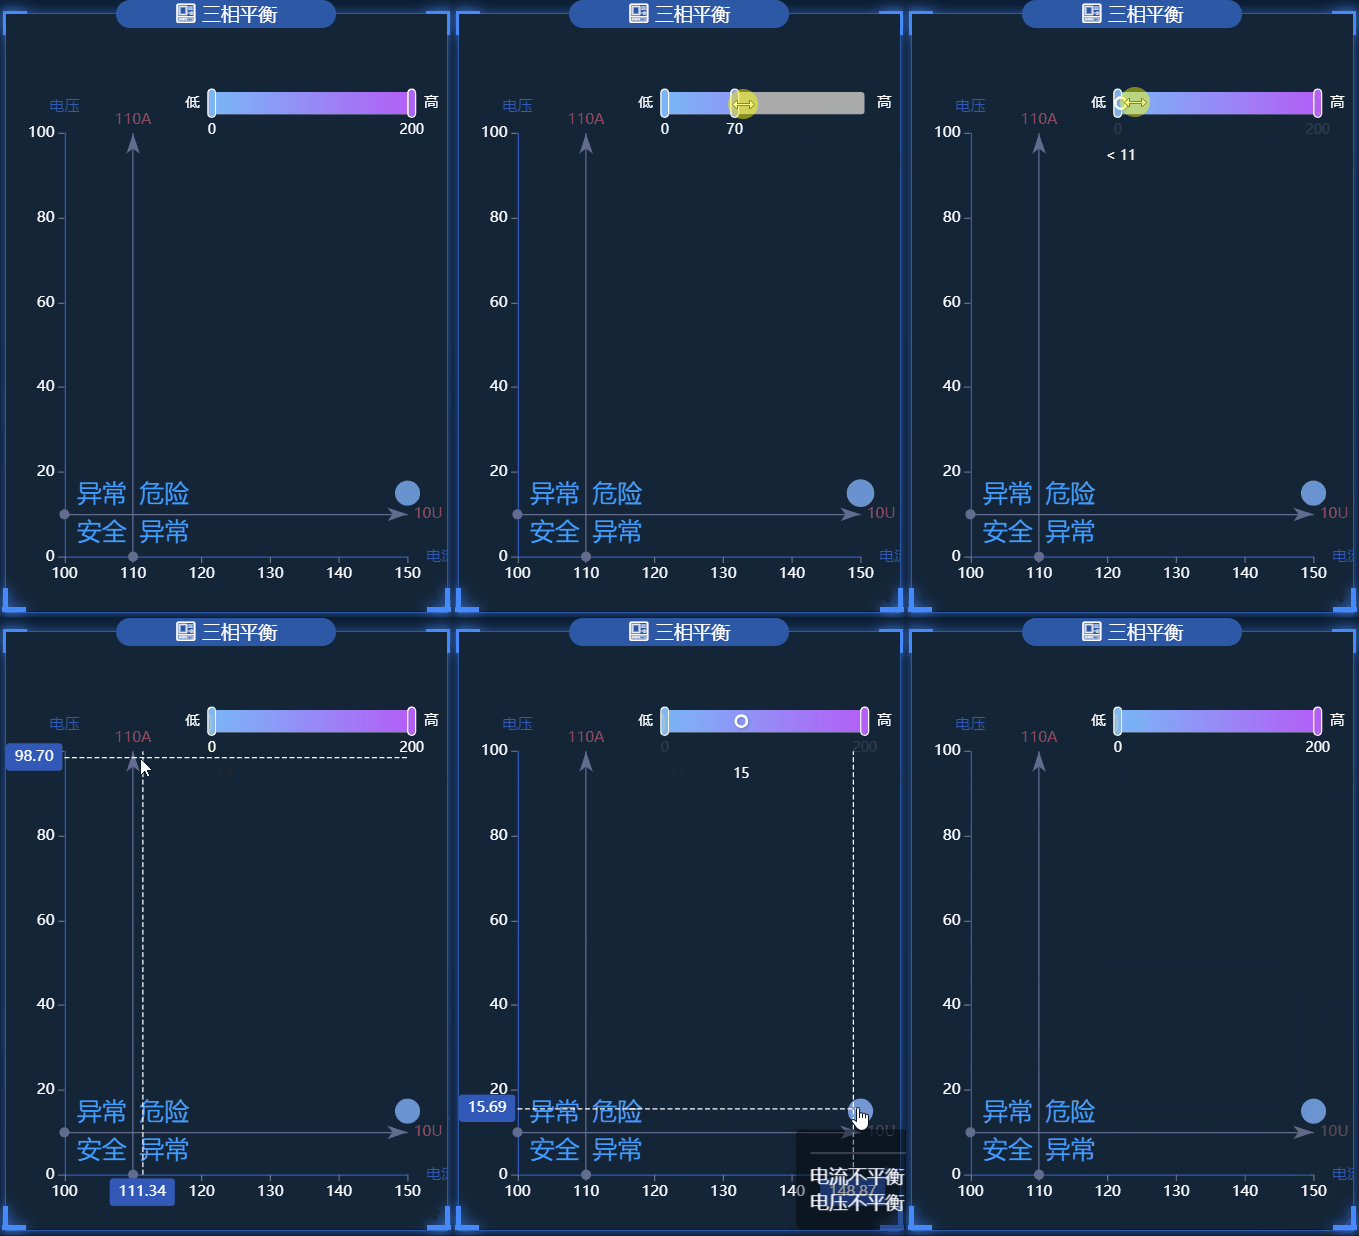
三相平衡

在这个图表中,大家可以学会visualMap属性的使用,以及图表内容文字的格式化
.vue文件代码如下:

?

1

2

3

4

5

6

7

8

9

10

11

12

13

14

15

16

17

18

19

20

21

22

23

24

25

26

27

28

29

30

31

32

33

34

35

36

37

38

39

40

41

42

43

44

45

46

47

48

49

50

51

52

53

54

55

56

57

58

59

60

61

62

63

64

65

66

67

68

69

70

71

72

73

74

75

76

77

78

79

80

81

82

83

84

85

86

87

88

89

90

91

92

93

94

95

96

97

98

99

100

101

102

103

104

105

106

107

108

109

110

111

112

113

114

115

116

117

118

119

120

121

122

123

124

125

126

127

128

129

130

131

132

133

134

135

136

137

138

139

140

141

142

143

144

145

146

147

148

149

150

151

152

153

154

155

156

157

158

159

160

161

162

163

164

165

166

167

168

169

170

171

172

173

174

175

176

177

178

179

180

181

182

183

184

185

186

187

188

189

190

191

192

193

194

195

196

197

198

199

200

201

202

203

204

205

206

207

208

209

210

211

212

213

214

215

216

217

218

219

220

221

222

223

224

225

226

227

228

229

230

231

232

233

234

235

236

237

238

239

240

241

242

243

244

245

246

247

248

249

250

251

252

253

254

255

256

257

258

259

260

261

262

263

264

265

266

267

268

269

270

271

272

273

274

275

276

277

278

279

280

281

282

283

284

285

286

287

288

289

290

291

292

293

294

295

296

297

298

299

300

301

302

303

304

305

306

307

308

309

310

311

312

313

314

315

316

317

318

319

320

321

322

323

324

325

326

327

328

329

330

331

332

333

334

335

336

337

338

339

340

341

342

343

344

345

346

347

348

349

350

351

352

353

354

355

356

357

358

359

360

361

362

363

364

365

366

367

368

369

370

371

372

373

374

375

376

<template>

  <div class="tPhaseBalance">

    <charts :title="'三相平衡'" :iconClass="'icon-fuhekongzhizhongduan'">

      <template slot="detail">

        <div id="tPhaseBalance" ref="tPhaseBalance"></div>

      </template>

    </charts>

  </div>

</template>

<script>

import { getTPhaseBalance } from "@/api/surgey";

export default {

  name: "tPhaseBalance",

  data() {

    return {

      chartInstance: null,

      allData: null, //从服务器中获取的所有的数据

      myColor: [

        "rgb(248,180,72)",

        "rgb(86,208,227)",

        "rgb(245,116,116)",

        "rgb(16,137,231)",

      ],

    };

  },

  mounted() {

    this.initChart();

    this.getData();

    this.timer = setInterval(() => {

      this.getData();

    }, 60000);

  },

  methods: {

    // 初始化图表

    initChart() {

      this.chartInstance = this.$echarts.init(

        this.$refs.tPhaseBalance,

        "saibei"

      );

      const initOption = {};

      this.chartInstance.setOption(initOption);

      // 让图表跟随屏幕自动的去适应

      window.addEventListener("resize", () => {

        this.chartInstance.resize();

      });

    },

    // 从服务器获取数据

    async getData() {

      let res = await getTPhaseBalance({});

      if (res.code === 200) {

        this.allData = res.data;

        this.updateChart();

      } else {

        this.$message({

          message: res.msg,

          type: "warning",

        });

      }

    },

    //更新数据

    updateChart() {

      var arr = [];

      for (var i = 0; i < this.allData.length; i++) {

        var arrItem = {};

        arrItem.name = this.allData[i].devname;

        arrItem.sales = this.allData[i].unbalancefi;

        arrItem.services = this.allData[i].unbalancefu;

        arr.push(arrItem);

      }

      var arrItem = {};

      arrItem.name = " ";

      arrItem.sales = 150;

      arrItem.services = 15;

      arr.push(arrItem);

      var sourceData = arr;

      var seriesData = sourceData.map(function (item, index, array) {

        return {

          name: item["name"],

          value: [item["sales"], item["services"]],

        };

      });

      var computeServicesAvgLine = function () {

        let sum = 0;

        sourceData.forEach(function (item) {

          sum += item["services"];

        });

        // return sum / sourceData.length;

        return 10;

      };

      var computeSalesAvgLine = function () {

        let sum = 0;

        sourceData.forEach(function (item) {

          sum += item["sales"];

        });

        // return sum / sourceData.length;

        return 110;

      };

      var avg = {

        servicesAvgLine: computeServicesAvgLine(),

        salesAvgLine: computeSalesAvgLine(),

      };

      var option = {

        grid: {

          left: "5%",

          top: "20%",

          right: "9%",

          bottom: "5%",

          containLabel: true,

        },

        tooltip: {

          trigger: "item",

          axisPointer: {

            show: true,

            type: "cross",

            lineStyle: {

              type: "dashed",

              width: 1,

            },

          },

          backgroundColor: "rgba(0,0,0,.4)",

          borderColor: "rgba(0,0,0,.4)",

          textStyle: {

            color: "#fff",

          },

          formatter: function (obj) {

            if (obj.componentType == "series") {

              return (

                '<div style="border-bottom: 1px solid rgba(255,255,255,.3); font-size: 18px;padding-bottom: 7px;margin-bottom: 7px">' +

                obj.name +

                "</div>" +

                "<span>" +

                "电流不平衡" +

                "</span>" +

                " : " +

                obj.data.value[0] +

                "%" +

                "<br/>" +

                "<span>" +

                "电压不平衡" +

                "</span>" +

                " : " +

                obj.data.value[1] +

                "%"

              );

            }

          },

        },

        xAxis: {

          name: "电流",

          type: "value",

          scale: true, //脱离 0 值比例

          axisLabel: {

            color: "#fff",

            formatter: "{value}",

          },

          //分割线不显示

          splitLine: {

            show: false,

          },

          // x轴的轴线的样式

          axisLine: {

            show: true,

            lineStyle: {

              color: "#3259B8",

            },

          },

          //刻度的显示

          axisTick: {

            show: true,

          },

        },

        yAxis: {

          name: "电压",

          type: "value",

          scale: true,

          axisLabel: {

            color: "#fff",

            formatter: "{value}",

          },

          splitLine: {

            show: false,

          },

          axisLine: {

            show: true,

            lineStyle: {

              color: "#3259B8",

            },

          },

          //刻度的显示

          axisTick: {

            show: true,

          },

        },

        toolbox: {

          show: false,

          feature: {

            dataZoom: {},

          },

        },

        visualMap: {

          /*min: 0,

                    max: 800,*/

          /*dimension: 0,*/

          show: true, //默认为true,控制长条的显示与隐藏

          padding: [50, 20],

          //选择框是水平的还是数值的

          orient: "horizontal",

          left: "35%",

          top: "2%",

          text: ["高", "低"], //两端的文字

          calculable: true, //是否显示拖拽的文本

          itemWidth: 18, //长条的宽度

          itemHeight: 160, //长条的高度

          textStyle: {

            color: "#fff",

            height: 56,

            fontSize: 11,

            lineHeight: 60,

          },

          //在选中范围中的视觉元素

          inRange: {

            color: ["#7AB7F7", "#b45ef7"],

          },

        },

        series: [

          {

            type: "scatter",

            data: seriesData,

            symbolSize: 20,

            markLine: {

              //鼠标移动到图形上时的显示内容

              label: {

                show: true,

                formatter: function (params) {

                  if (params.dataIndex == 0) {

                    return params.value + "A";

                  } else if (params.dataIndex == 1) {

                    return params.value + "U";

                  }

                  return params.value;

                },

              },

              //线条的样式

              lineStyle: {

                color: "#626c91",

                type: "solid",

                width: 1,

              },

              //线条高亮时的样式

              emphasis: {

                lineStyle: {

                  color: "#fff",

                },

              },

              data: [

                {

                  xAxis: avg.salesAvgLine,

                  name: "电流平均线",

                  label: {

                    color: "#b84a58",

                  },

                },

                {

                  yAxis: avg.servicesAvgLine,

                  name: "电压平均线",

                  label: {

                    color: "#b84a58",

                  },

                },

              ],

            },

            markArea: {

              silent: true,

              data: [

                [

                  {

                    name: "异常",

                    itemStyle: {

                      color: "transparent",

                    },

                    label: {

                      show: true,

                      position: "insideTopLeft",

                      fontStyle: "normal",

                      color: "#409EFF",

                      fontSize: 20,

                    },

                    coord: [avg.salesAvgLine, avg.servicesAvgLine],

                  },

                  {

                    coord: [Number.MAX_VALUE, 0],

                  },

                ],

                [

                  {

                    name: "安全",

                    itemStyle: {

                      color: "transparent",

                    },

                    label: {

                      show: true,

                      position: "insideTopRight",

                      fontStyle: "normal",

                      color: "#409EFF",

                      fontSize: 20,

                    },

                    coord: [0, 0],

                  },

                  {

                    coord: [avg.salesAvgLine, avg.servicesAvgLine],

                  },

                ],

                [

                  {

                    name: "危险",

                    itemStyle: {

                      color: "transparent",

                    },

                    label: {

                      show: true,

                      position: "insideBottomLeft",

                      fontStyle: "normal",

                      color: "#409EFF",

                      fontSize: 20,

                    },

                    coord: [avg.salesAvgLine, avg.servicesAvgLine],

                  },

                  {

                    coord: [Number.MAX_VALUE, Number.MAX_VALUE],

                  },

                ],

                [

                  {

                    name: "异常",

                    itemStyle: {

                      color: "transparent",

                    },

                    label: {

                      show: true,

                      position: "insideBottomRight",

                      fontStyle: "normal",

                      color: "#409EFF",

                      fontSize: 20,

                    },

                    coord: [0, Number.MAX_VALUE],

                  },

                  {

                    coord: [avg.salesAvgLine, avg.servicesAvgLine],

                  },

                ],

              ],

            },

            label: {

              show: true,

              position: "bottom",

              formatter: function (params) {

                return params.name;

              },

            },

          },

        ],

      };

      this.chartInstance.setOption(option);

    },

  },

  beforeDestroy() {

    clearInterval(this.timer);

  },

};

</script>

<style lang="less" scoped>

#tPhaseBalance {

  width: 100%;

  height: 100%;

}

</style>

本文来自互联网用户投稿,该文观点仅代表作者本人,不代表本站立场。本站仅提供信息存储空间服务,不拥有所有权,不承担相关法律责任。如若转载,请注明出处:http://www.coloradmin.cn/o/649467.html

如若内容造成侵权/违法违规/事实不符,请联系多彩编程网进行投诉反馈,一经查实,立即删除!

相关文章

【笔记】Fastapi 服务器部署无法访问接口

主要原因&#xff1a; # 主函数 if __name__ "__main__":uvicorn.run(appmain:app, host127.0.0.1, port8181, reloadFalse)以上都是测试环境&#xff0c;可以使用127.0.0.1&#xff0c;但是服务器上不能用这个地址&#xff0c;要改为0.0.0.0。 参考&#xff1a;服…

Qt_C++读写NXP、富士通15693标签支持windows国产linux操作系统

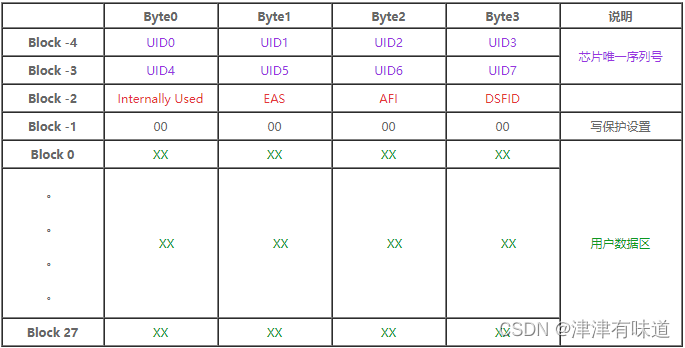
常用15693标签NXP ICODE存储结构说明 片内含1024位E2PROM&#xff0c;共分为32 Block&#xff0c;每个Block 32bit。其中64位为唯一序列号&#xff0c;32位用作特殊功能&#xff08;EAS、AFI、DSFID等&#xff09;&#xff0c;32位用于Block锁定&#xff0c;其余为用户使用区。…

mock测试(挡板测试)

https://www.cnblogs.com/lc-blogs/p/17027617.html mock测试&#xff08;挡板测试&#xff09;就是在测试过程中&#xff0c;对于某些不容易构造或者不容易获取的对象&#xff0c;用一个虚拟的对象来创建以便测试的测试方法。 比如&#xff1a;测试天气这个接口&#xff0c;最…

RIP协议路由配置(Cisco Packet Tracer)

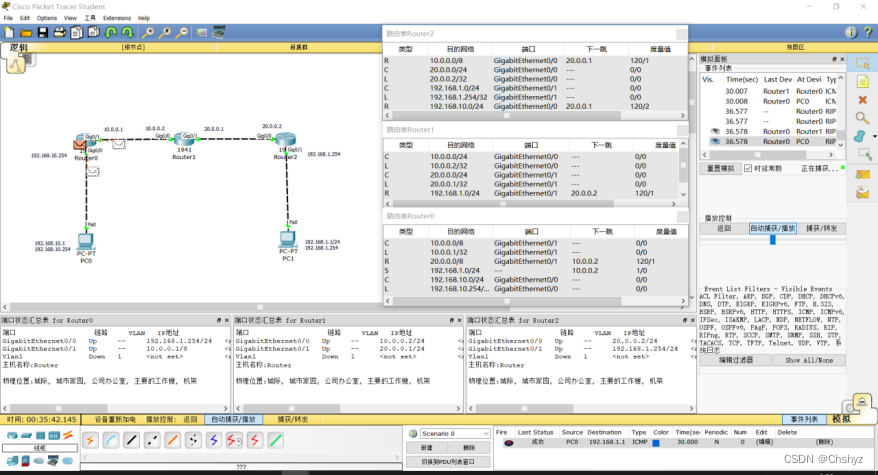
实验环境&#xff1a; windows10操作系统、思科模拟器、网络正常&#xff1b; 实验内容&#xff1a; 新建packettracer拓扑图&#xff1b;设置PC机的网络配置信息&#xff1b;配置路由器的接口IP&#xff1b;为路由器的RIP添加地址&#xff1b;为路由器添加静态路由。测试PC…

由于找不到wpcap.dll导致软件无法运行的解决办法,特此记录

由于找不到wpcap.dll导致软件无法运行的解决办法&#xff0c;特此记录提示 目录 前言 一、解决找不到wpcap.dll错误的办法 前言 今天在运行一个软件时弹出&#xff0c;找不到wpcap.dll&#xff0c;无法运行的弹出&#xff0c;目前已解决此问题&#xff0c;特此记录&#xff…

MQTT服务等级

1.QoS含义 Quality of Service,服务质量 很多时候&#xff0c;使用 MQTT 协议的设备都运行在网络受限的环境下&#xff0c;而只依靠底层的 TCP传输协议&#xff0c;并不能完全保证消息的可靠到达。因此&#xff0c;MQTT 提供了 QoS机制&#xff0c;其核心是设计了多种消息交互…

什么是electron?

Electron是一个使用 JavaScript、HTML 和 CSS 构建桌面应用程序的框架。 嵌入 Chromium 和 Node.js 到 二进制的 Electron 允许您保持一个 JavaScript 代码代码库并创建 在Windows上运行的跨平台应用 macOS和Linux——不需要本地开发 经验 election的主要组成部分&#xff1a;…

5、共享模型之内存

目录 5.1 Java的内存模型5.2 可见性1、退不出的循环2、解决办法&#xff1a;3、可见性 vs 原子性 5.3 有序性1、为什么会有指令重排2、如何禁止指令重排3、原理之volatile4、happens-before 5.1 Java的内存模型 JMM 即 Java Memory Model&#xff08;Java内存模型&#xff09;…

如何学习Java“高并发”,并在项目中实际应用?

前几天收到一位粉丝私信&#xff0c;说的是他才一年半经验&#xff0c;去面试却被各种问到分布式&#xff0c;高并发&#xff0c;多线程之间的问题。基础层面上的是可以答上来&#xff0c;但是面试官深问的话就不会了&#xff01;被问得都怀疑现在Java招聘初级岗位到底招的是初…

DMHS同步原理介绍以及DM8同步到DM8

一、DMHS原理介绍 1.DMHS介绍 达梦数据实时同步软件 DMHS 是达梦公司推出的新一代支持异构环境的高性能、高可靠和高可扩展的数据库实时同步系统。该产品基于成熟的关系数据模型和标准接口&#xff0c;跨越多种软硬件平台实现秒级数据实时同步。该产品可广泛应用于应急系统、…

什么是产品经理 | 文末赠书

目录 一. 产品经理是什么&#xff1f;二. 产品经理需要具备的技能三. 产品经理的职责四. 产品经理在软件开发过程中如何平衡不同利益方的需求&#xff1f;五. 入门建议六. 发展前景七. 总结&#x1f981;文末福利图书介绍作者简介 一. 产品经理是什么&#xff1f; 产品经理是指…

使用阿里巴巴开源神器Arthas进行性能分析

目录 前言&#xff1a; Arthas介绍 启动 分析命令 Profiler工具 前言&#xff1a; Arthas是一款由阿里巴巴开源的Java诊断工具&#xff0c;它可以在生产环境中帮助开发人员快速地定位问题&#xff0c;并进行高效的性能分析。通过在命令行中输入简单的命令&#xff0c;开发人员…

Win10开机后自动显示右键菜单怎么办?

Win10开机后自动显示右键菜单怎么办&#xff1f;用户打开Win10电脑后发现电脑自动显示右键菜单&#xff0c;如果是使用联想电脑的用户&#xff0c;需要打开联想管家&#xff0c;关掉联想锁屏即可&#xff0c;若是系统不兼容导致的&#xff0c;这时候用户就需要恢复Win10系统来解…

前端性能优化:高在性能,大在范围,必要前置知识一网打尽!(上)

前言 前端性能优化 又是个听起来很高大上的词&#xff0c;确实是的&#xff0c;因为它需要 高在性能&#xff0c;大在范围 &#xff0c;所幸很多大佬都已经输出了很多高质量的内容供大家参考&#xff0c;作者最近也在学习和了解这方面的内容&#xff0c;对如下文中的一些理解若…

死磕测试 10 余年,呕心整理出了核心知识点已经做成PDF,无私奉献

前言&#xff1a; 想在面试、工作中脱颖而出&#xff1f;想在最短的时间内快速掌握 软件测试 的核心基础知识点&#xff1f;想要成为一位优秀的测试工程师&#xff1f;本篇文章能助你一臂之力&#xff01; 目前正值招聘求职旺季&#xff0c;很多同学对一些新技术名词都能侃侃…

智能文本生成:进展与挑战

智能文本生成&#xff1a;进展与挑战 万小军 北京大学王选计算机研究所 摘要&#xff1a;智能文本生成是人工智能与自然语言处理领域的前沿研究方向&#xff0c;也是AI生成内容&#xff08;AIGC&#xff09;的关键技术支撑&#xff0c;近些年受到学术界和产业界的高度关注&…

[笔记]pg常用命令

数据库版本 &#xff1a;9.6.6 注意 &#xff1a;PostgreSQL中的不同类型的权限有SELECT,INSERT,UPDATE,DELETE,TRUNCATE,REFERENCES,TRIGGER,CREATE,CONNECT,TEMPORARY,EXECUTE 和 USAGE。 1. 登录PG数据库 以管理员身份 postgres 登陆&#xff0c;然后通过 #psql -U postg…

【TA100 】3.3 曲面细分与几何着色器---大规模草渲染

一、两者的应用列举 1-1.曲面细分着色器的应用 ①海浪、雪地等 2著名的应用&#xff1a;和置换贴图&#xff08;DIsplacement mapping&#xff0c;也叫位移贴图&#xff09;结合使用 ● 使用普通法线的模型&#xff0c;在边缘部分的凹凸感会不理想 ● 如果使用置换贴图&#…

HarmonyOS学习路之开发篇—Java UI框架(自定义组件与布局 二)

自定义布局 当Java UI框架提供的布局无法满足需求时&#xff0c;可以创建自定义布局&#xff0c;根据需求自定义布局规则 常用接口 Component类相关接口 接口名称 作用 setEstimateSizeListener 设置测量组件的侦听器 setEstimatedSize 设置测量的宽度和高度 onEstima…

极速了解GPT生态

第一部分&#xff1a; 1、chatGPT:一个大语言模型&#xff0c;可以通过API去访问&#xff0c;下面很多是根据API去访问&#xff0c;然后来进行集成。 2、Vector store&#xff0c;你也可以叫是Vector search&#xff0c;主要目就是存储各种向量&#xff0c;然后去计算向量的各…