T002 · 基于ADME的分子过滤和 lead-likeness标准
项目来源于TeachOpenCADD
本文目标
在药物设计的背景下,重要的是通过例如它们的物理化学性质来过滤候选分子。
在这个教程中,从 ChEMBL ( Talktorial T001 )获得的化合物将按照 Lipinsik 的五法则进行过滤,以仅保留口服生物可利用的化合物。
理论内容
- ADME - 吸收、分布、代谢和排泄
- Lead-likeness 和 Lipinski 的五法则 (Ro5)
- Lead-likeness背景下的雷达图
实践内容
- 定义和可视化示例分子
- 计算并绘制 Ro5 的分子特性
- 调查是否符合 Ro5
- 将 Ro5 应用于 EGFR 数据集
- 可视化 Ro5 属性(雷达图)
理论
在虚拟筛选中,我们的目标是预测化合物是否可能与特定目标结合并相互作用。然而,如果我们想要鉴定一种新药,同样重要的是该化合物能够到达目标并最终以有利的方式从体内清除。因此,我们还应该考虑一种化合物是否真的被吸收到体内,以及它是否能够跨越某些障碍以达到其目标。它的代谢是否稳定?一旦不再作用于目标,它将如何排泄?这些过程在药代动力学领域进行了研究。与药效学( “药物对我们的身体有什么作用?” )相反,药代动力学处理的问题是“药物在我们体内发生了什么?” .
ADME - 吸收、分布、代谢和排泄
药代动力学主要分为四个步骤:吸收、分布、代谢和排泄。这些总结为 ADME。通常,ADME 还包括毒理学,因此被称为 ADMET 或 ADMETox。下面更详细地讨论了 ADME 步骤。
- 吸收:药物吸收到体内的量和时间取决于多种因素,这些因素可能因人而异,他们的条件以及物质的特性。化合物溶解度(差)、胃排空时间、肠道转运时间、胃内的化学(不)稳定性和(不)渗透肠壁的能力等因素都会影响药物在给药后的吸收程度例如口服、吸入或接触皮肤。
- 分布:吸收物质的分布,即在体内、血液和不同组织之间,以及穿过血脑屏障,受区域血流速率、化合物的分子大小和极性以及与血清蛋白和转运体结合的影响酵素。毒理学中的关键影响可能是脂肪组织中高度非极性物质的积累,或穿过血脑屏障。
- 代谢:化合物进入体内后会被代谢。这意味着该化合物中只有一部分会真正达到其目标。主要是肝脏和肾脏酶负责分解异生素(身体外在的物质)。
- 排泄:化合物及其代谢物需要通过排泄从体内清除,通常是通过肾脏(尿液)或粪便。不完全排泄会导致外来物质的积累或对正常代谢的不利干扰。
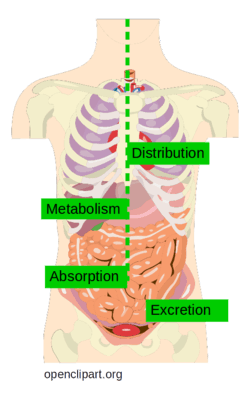
Figure 1: ADME processes in the human body (figure taken from Openclipart and adapted).
Lead-likeness 和 Lipinski 的五法则 (Ro5)
先导化合物是具有前景的开发候选药物。它们被用作起始结构并进行修饰以开发有效的药物。除了生物活性(化合物与感兴趣的靶标结合)之外,有利的 ADME 特性也是设计高效药物的重要标准。
化合物的生物利用度是一个重要的 ADME 特性。Lipinski 的五规则 (Ro5, Adv. Drug Deliv. Rev. (1997), 23, 3-25 ) 被引入以仅基于化合物的化学结构来估计化合物的生物利用度。Ro5 指出,如果化学结构违反以下规则中的一项以上,则化合物吸收或渗透不良的可能性更大:
- 分子量 (MWT) <= 500 Da
- 氢键受体 (HBA) 的数量 <= 10
- 氢键供体 (HBD) 的数量 <= 5
- 计算的 LogP(辛醇-水系数)<= 5
注:Ro5中所有数字均为五的倍数;这就是规则名称的由来。
补充说明:
-
LogP也称为分配系数或辛醇-水系数。它测量化合物的分布,通常在疏水相(例如 1-辛醇)和亲水相(例如水)之间。
-
疏水性分子在水中的溶解度可能会降低,而亲水性更强的分子(例如大量的氢键受体和供体)或大分子(高分子量)可能更难通过磷脂膜。
lead-likeness背景下的雷达图
分子特性,例如 Ro5 特性,可以通过多种方式可视化(例如克雷格图、花图或金三角)以支持药物化学家的解释(Drug. Discov. Today (2011), 16(1-2 ) , 65-72).
由于它们的外观,雷达图有时也被称为“蜘蛛”或“蜘蛛网”图。它们以 360 度环状排列,每个条件都有一个轴,从中心开始。每个参数的值绘制在轴上并用一条线连接。阴影区域可以表示参数满足条件的区域。
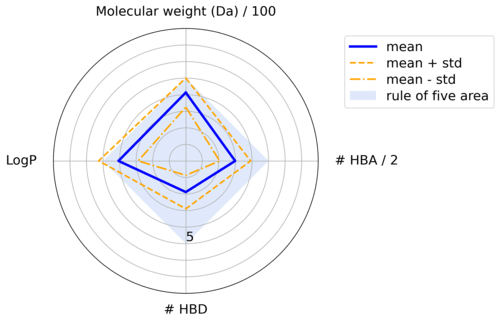
Figure 2: Radar plot displaying physico-chemical properties of a compound dataset
实践
from pathlib import Path
import math

import numpy as np
import pandas as pd
import matplotlib.pyplot as plt
from matplotlib.lines import Line2D
import matplotlib.patches as mpatches
from rdkit import Chem
from rdkit.Chem import Descriptors, Draw, PandasTools
# Set path to this notebook
HERE = Path(_dh[-1])
DATA = HERE / "data"
定义和可视化示例分子
在处理从 ChEMBL 检索到的整个数据集之前,我们选择了四种示例化合物来研究它们的化学性质。
我们从他们的 SMILES 中抽取了四个示例分子。
smiles = [
    "CCC1C(=O)N(CC(=O)N(C(C(=O)NC(C(=O)N(C(C(=O)NC(C(=O)NC(C(=O)N(C(C(=O)N(C(C(=O)N(C(C(=O)N(C(C(=O)N1)C(C(C)CC=CC)O)C)C(C)C)C)CC(C)C)C)CC(C)C)C)C)C)CC(C)C)C)C(C)C)CC(C)C)C)C",
    "CN1CCN(CC1)C2=C3C=CC=CC3=NC4=C(N2)C=C(C=C4)C",
    "CC1=C(C(CCC1)(C)C)C=CC(=CC=CC(=CC=CC=C(C)C=CC=C(C)C=CC2=C(CCCC2(C)C)C)C)C",
    "CCCCCC1=CC(=C(C(=C1)O)C2C=C(CCC2C(=C)C)C)O",
]
names = ["cyclosporine", "clozapine", "beta-carotene", "cannabidiol"]
首先,我们将分子的名称和 SMILES 及其结构组合在一个 DataFrame 中。
molecules = pd.DataFrame({"name": names, "smiles": smiles})
PandasTools.AddMoleculeColumnToFrame(molecules, "smiles")
molecules
| name | smiles | ROMol | |
|---|---|---|---|
| 0 | cyclosporine | CCC1C(=O)N(CC(=O)N(C(C(=O)NC(C(=O)N(C(C(=O)NC(... |

|
| 1 | clozapine | CN1CCN(CC1)C2=C3C=CC=CC3=NC4=C(N2)C=C(C=C4)C |

|
| 2 | beta-carotene | CC1=C(C(CCC1)(C)C)C=CC(=CC=CC(=CC=CC=C(C)C=CC=... |

|
| 3 | cannabidiol | CCCCCC1=CC(=C(C(=C1)O)C2C=C(CCC2C(=C)C)C)O |

|
计算并绘制 Ro5 的分子特性
- 使用
rdkit描述符descriptors计算分子量、氢键受体和供体的数量以及 logP 。
molecules["molecular_weight"] = molecules["ROMol"].apply(Descriptors.ExactMolWt)
molecules["n_hba"] = molecules["ROMol"].apply(Descriptors.NumHAcceptors)
molecules["n_hbd"] = molecules["ROMol"].apply(Descriptors.NumHDonors)
molecules["logp"] = molecules["ROMol"].apply(Descriptors.MolLogP)

# Colors are used for plotting the molecules later
molecules["color"] = ["red", "green", "blue", "cyan"]
# NBVAL_CHECK_OUTPUT
molecules[["molecular_weight", "n_hba", "n_hbd", "logp"]]
| molecular_weight | n_hba | n_hbd | logp | |
|---|---|---|---|---|
| 0 | 1201.841368 | 12 | 5 | 3.26900 |
| 1 | 306.184447 | 4 | 1 | 1.68492 |
| 2 | 536.438202 | 0 | 0 | 12.60580 |
| 3 | 314.224580 | 2 | 2 | 5.84650 |
# Full preview
molecules
| name | smiles | ROMol | molecular_weight | n_hba | n_hbd | logp | color | |
|---|---|---|---|---|---|---|---|---|
| 0 | cyclosporine | CCC1C(=O)N(CC(=O)N(C(C(=O)NC(C(=O)N(C(C(=O)NC(... |
| 1201.841368 | 12 | 5 | 3.26900 | red |
| 1 | clozapine | CN1CCN(CC1)C2=C3C=CC=CC3=NC4=C(N2)C=C(C=C4)C |
| 306.184447 | 4 | 1 | 1.68492 | green |
| 2 | beta-carotene | CC1=C(C(CCC1)(C)C)C=CC(=CC=CC(=CC=CC=C(C)C=CC=... |
| 536.438202 | 0 | 0 | 12.60580 | blue |
| 3 | cannabidiol | CCCCCC1=CC(=C(C(=C1)O)C2C=C(CCC2C(=C)C)C)O |
| 314.224580 | 2 | 2 | 5.84650 | cyan |
- 将分子特性绘制为条形图。
ro5_properties = {
    "molecular_weight": (500, "molecular weight (Da)"),
    "n_hba": (10, "# HBA"),
    "n_hbd": (5, "# HBD"),
    "logp": (5, "logP"),
}
# Start 1x4 plot frame
fig, axes = plt.subplots(figsize=(10, 2.5), nrows=1, ncols=4)
x = np.arange(1, len(molecules) + 1)
colors = ["red", "green", "blue", "cyan"]

# Create subplots
for index, (key, (threshold, title)) in enumerate(ro5_properties.items()):
    axes[index].bar([1, 2, 3, 4], molecules[key], color=colors)
    axes[index].axhline(y=threshold, color="black", linestyle="dashed")
    axes[index].set_title(title)
    axes[index].set_xticks([])

# Add legend
legend_elements = [
    mpatches.Patch(color=row["color"], label=row["name"]) for index, row in molecules.iterrows()
]
legend_elements.append(Line2D([0], [0], color="black", ls="dashed", label="Threshold"))
fig.legend(handles=legend_elements, bbox_to_anchor=(1.2, 0.8))

# Fit subplots and legend into figure
plt.tight_layout()
plt.show()
[外链图片转存失败,源站可能有防盗链机制,建议将图片保存下来直接上传(img-EJnxiOra-1686104448503)(null)]
在条形图中,我们比较了四个具有不同属性的示例分子的 Ro5 属性。在接下来的步骤中,我们将调查每种化合物是否违反 Ro5。
调查是否符合Ro5
def calculate_ro5_properties(smiles):
    """
    Test if input molecule (SMILES) fulfills Lipinski's rule of five.

    Parameters
    ----------
    smiles : str
        SMILES for a molecule.

    Returns
    -------
    pandas.Series
        Molecular weight, number of hydrogen bond acceptors/donor and logP value
        and Lipinski's rule of five compliance for input molecule.
    """
    # RDKit molecule from SMILES
    molecule = Chem.MolFromSmiles(smiles)
    # Calculate Ro5-relevant chemical properties
    molecular_weight = Descriptors.ExactMolWt(molecule)
    n_hba = Descriptors.NumHAcceptors(molecule)
    n_hbd = Descriptors.NumHDonors(molecule)
    logp = Descriptors.MolLogP(molecule)
    # Check if Ro5 conditions fulfilled
    conditions = [molecular_weight <= 500, n_hba <= 10, n_hbd <= 5, logp <= 5]
    ro5_fulfilled = sum(conditions) >= 3
    # Return True if no more than one out of four conditions is violated
    return pd.Series(
        [molecular_weight, n_hba, n_hbd, logp, ro5_fulfilled],
        index=["molecular_weight", "n_hba", "n_hbd", "logp", "ro5_fulfilled"],
    )
# NBVAL_CHECK_OUTPUT
for name, smiles in zip(molecules["name"], molecules["smiles"]):
    print(f"Ro5 fulfilled for {name}: {calculate_ro5_properties(smiles)['ro5_fulfilled']}")
Ro5 fulfilled for cyclosporine: False
Ro5 fulfilled for clozapine: True
Ro5 fulfilled for beta-carotene: False
Ro5 fulfilled for cannabidiol: True
根据 Ro5,估计环孢菌素cyclosporin和β-胡萝卜素beta-carotene的生物利用度较差。
然而,由于它们都是批准的药物,它们是 Ro5 如何用作警报但不一定用作过滤器的好例子。
将 Ro5 应用于 EGFR 数据集
该calculate_ro5_properties函数可应用于符合 Ro5 标准的化合物的 EGFR 数据集。
molecules = pd.read_csv(HERE / "../T001_query_chembl/data/EGFR_compounds.csv", index_col=0)
print(molecules.shape)
molecules.head()
(5568, 5)
| molecule_chembl_id | IC50 | units | smiles | pIC50 | |
|---|---|---|---|---|---|
| 0 | CHEMBL63786 | 0.003 | nM | Brc1cccc(Nc2ncnc3cc4ccccc4cc23)c1 | 11.522879 |
| 1 | CHEMBL35820 | 0.006 | nM | CCOc1cc2ncnc(Nc3cccc(Br)c3)c2cc1OCC | 11.221849 |
| 2 | CHEMBL53711 | 0.006 | nM | CN(C)c1cc2c(Nc3cccc(Br)c3)ncnc2cn1 | 11.221849 |
| 3 | CHEMBL66031 | 0.008 | nM | Brc1cccc(Nc2ncnc3cc4[nH]cnc4cc23)c1 | 11.096910 |
| 4 | CHEMBL53753 | 0.008 | nM | CNc1cc2c(Nc3cccc(Br)c3)ncnc2cn1 | 11.096910 |
Apply the Ro5 to all molecules.
# This takes a couple of seconds
ro5_properties = molecules["smiles"].apply(calculate_ro5_properties)
ro5_properties.head()
| molecular_weight | n_hba | n_hbd | logp | ro5_fulfilled | |
|---|---|---|---|---|---|
| 0 | 349.021459 | 3 | 1 | 5.2891 | True |
| 1 | 387.058239 | 5 | 1 | 4.9333 | True |
| 2 | 343.043258 | 5 | 1 | 3.5969 | True |
| 3 | 339.011957 | 4 | 2 | 4.0122 | True |
| 4 | 329.027607 | 5 | 2 | 3.5726 | True |
Concatenate molecules with Ro5 data.
molecules = pd.concat([molecules, ro5_properties], axis=1)
molecules.head()
| molecule_chembl_id | IC50 | units | smiles | pIC50 | molecular_weight | n_hba | n_hbd | logp | ro5_fulfilled | |
|---|---|---|---|---|---|---|---|---|---|---|
| 0 | CHEMBL63786 | 0.003 | nM | Brc1cccc(Nc2ncnc3cc4ccccc4cc23)c1 | 11.522879 | 349.021459 | 3 | 1 | 5.2891 | True |
| 1 | CHEMBL35820 | 0.006 | nM | CCOc1cc2ncnc(Nc3cccc(Br)c3)c2cc1OCC | 11.221849 | 387.058239 | 5 | 1 | 4.9333 | True |
| 2 | CHEMBL53711 | 0.006 | nM | CN(C)c1cc2c(Nc3cccc(Br)c3)ncnc2cn1 | 11.221849 | 343.043258 | 5 | 1 | 3.5969 | True |
| 3 | CHEMBL66031 | 0.008 | nM | Brc1cccc(Nc2ncnc3cc4[nH]cnc4cc23)c1 | 11.096910 | 339.011957 | 4 | 2 | 4.0122 | True |
| 4 | CHEMBL53753 | 0.008 | nM | CNc1cc2c(Nc3cccc(Br)c3)ncnc2cn1 | 11.096910 | 329.027607 | 5 | 2 | 3.5726 | True |
# Note that the column "ro5_fulfilled" contains boolean values.
# Thus, we can use the column values directly to subset data.
# Note that ~ negates boolean values.
molecules_ro5_fulfilled = molecules[molecules["ro5_fulfilled"]]
molecules_ro5_violated = molecules[~molecules["ro5_fulfilled"]]

print(f"# compounds in unfiltered data set: {molecules.shape[0]}")
print(f"# compounds in filtered data set: {molecules_ro5_fulfilled.shape[0]}")
print(f"# compounds not compliant with the Ro5: {molecules_ro5_violated.shape[0]}")
# NBVAL_CHECK_OUTPUT
# compounds in unfiltered data set: 5568
# compounds in filtered data set: 4635
# compounds not compliant with the Ro5: 933
# Save filtered data
molecules_ro5_fulfilled.to_csv(DATA / "EGFR_compounds_lipinski.csv")
molecules_ro5_fulfilled.head()
| molecule_chembl_id | IC50 | units | smiles | pIC50 | molecular_weight | n_hba | n_hbd | logp | ro5_fulfilled | |
|---|---|---|---|---|---|---|---|---|---|---|
| 0 | CHEMBL63786 | 0.003 | nM | Brc1cccc(Nc2ncnc3cc4ccccc4cc23)c1 | 11.522879 | 349.021459 | 3 | 1 | 5.2891 | True |
| 1 | CHEMBL35820 | 0.006 | nM | CCOc1cc2ncnc(Nc3cccc(Br)c3)c2cc1OCC | 11.221849 | 387.058239 | 5 | 1 | 4.9333 | True |
| 2 | CHEMBL53711 | 0.006 | nM | CN(C)c1cc2c(Nc3cccc(Br)c3)ncnc2cn1 | 11.221849 | 343.043258 | 5 | 1 | 3.5969 | True |
| 3 | CHEMBL66031 | 0.008 | nM | Brc1cccc(Nc2ncnc3cc4[nH]cnc4cc23)c1 | 11.096910 | 339.011957 | 4 | 2 | 4.0122 | True |
| 4 | CHEMBL53753 | 0.008 | nM | CNc1cc2c(Nc3cccc(Br)c3)ncnc2cn1 | 11.096910 | 329.027607 | 5 | 2 | 3.5726 | True |
可视化 Ro5 属性(雷达图)
计算 Ro5 属性的统计数据
定义一个辅助函数来计算输入 DataFrame 的均值和标准差。
def calculate_mean_std(dataframe):
    """
    Calculate the mean and standard deviation of a dataset.

    Parameters
    ----------
    dataframe : pd.DataFrame
        Properties (columns) for a set of items (rows).

    Returns
    -------
    pd.DataFrame
        Mean and standard deviation (columns) for different properties (rows).
    """
    # Generate descriptive statistics for property columns
    stats = dataframe.describe()
    # Transpose DataFrame (statistical measures = columns)
    stats = stats.T
    # Select mean and standard deviation
    stats = stats[["mean", "std"]]
    return stats
计算满足 Ro5的化合物数据集的统计数据。
molecules_ro5_fulfilled_stats = calculate_mean_std(
    molecules_ro5_fulfilled[["molecular_weight", "n_hba", "n_hbd", "logp"]]
)
molecules_ro5_fulfilled_stats
# NBVAL_CHECK_OUTPUT
| mean | std | |
|---|---|---|
| molecular_weight | 414.439011 | 87.985100 |
| n_hba | 5.996548 | 1.875491 |
| n_hbd | 1.889968 | 1.008368 |
| logp | 4.070568 | 1.193034 |
计算了 违反 Ro5 的化合物数据集的统计数据
molecules_ro5_violated_stats = calculate_mean_std(
    molecules_ro5_violated[["molecular_weight", "n_hba", "n_hbd", "logp"]]
)
molecules_ro5_violated_stats
| mean | std | |
|---|---|---|
| molecular_weight | 587.961963 | 101.999229 |
| n_hba | 7.963558 | 2.373576 |
| n_hbd | 2.301179 | 1.719732 |
| logp | 5.973461 | 1.430636 |
定义辅助函数为雷达绘图准备数据
下面,我们将定义一些仅用于雷达绘图的辅助函数。
准备 y 值:用于 Ro5 标准的属性具有不同的大小。MWT 的阈值为 500,而 HBA 和 HBD 的数量以及 LogP 的阈值分别仅为 10、5 和 5。为了最简单地可视化这些不同的尺度,我们将把所有属性值缩放到5 的缩放阈值:
scaled property value = property value / property threshold * scaled property threshold
- scaled MWT = MWT / 500 * 5 = MWT / 100
- scaled HBA = HBA / 10 * 5 = HBA / 2
- scaled HBD = HBD / 5 * 5 = HBD
- scaled LogP = LogP / 5 * 5 = LogP
这导致 MWT 缩小 100,HBA 缩小 2,而 HBD 和 LogP 保持不变。
以下辅助函数执行此类缩放,稍后将在雷达绘图期间使用。
def _scale_by_thresholds(stats, thresholds, scaled_threshold):
    """
    Scale values for different properties that have each an individually defined threshold.

    Parameters
    ----------
    stats : pd.DataFrame
        Dataframe with "mean" and "std" (columns) for each physicochemical property (rows).
    thresholds : dict of str: int
        Thresholds defined for each property.
    scaled_threshold : int or float
        Scaled thresholds across all properties.

    Returns
    -------
    pd.DataFrame
        DataFrame with scaled means and standard deviations for each physiochemical property.
    """
    # Raise error if scaling keys and data_stats indicies are not matching
    for property_name in stats.index:
        if property_name not in thresholds.keys():
            raise KeyError(f"Add property '{property_name}' to scaling variable.")
    # Scale property data
    stats_scaled = stats.apply(lambda x: x / thresholds[x.name] * scaled_threshold, axis=1)
    return stats_scaled
Prepare x values:
以下辅助函数返回 雷达图的物理化学属性轴的角度。例如,如果我们想为 4 个属性生成雷达图,我们想将轴设置为 0°、90°、180° 和 270°。辅助函数返回弧度等角度。
def _define_radial_axes_angles(n_axes):
    """Define angles (radians) for radial (x-)axes depending on the number of axes."""
    x_angles = [i / float(n_axes) * 2 * math.pi for i in range(n_axes)]
    x_angles += x_angles[:1]
    return x_angles
Both functions will be used as helper functions in the radar plotting function, which is defined next.
生成雷达图!
现在,我们定义了一个函数,以雷达图的形式可视化化合物的化学性质。我们遵循了stackoverflow 上的这些说明。
def plot_radar(
    y,
    thresholds,
    scaled_threshold,
    properties_labels,
    y_max=None,
    output_path=None,
):
    """
    Plot a radar chart based on the mean and standard deviation of a data set's properties.

    Parameters
    ----------
    y : pd.DataFrame
        Dataframe with "mean" and "std" (columns) for each physicochemical property (rows).
    thresholds : dict of str: int
        Thresholds defined for each property.
    scaled_threshold : int or float
        Scaled thresholds across all properties.
    properties_labels : list of str
        List of property names to be used as labels in the plot.
    y_max : None or int or float
        Set maximum y value. If None, let matplotlib decide.
    output_path : None or pathlib.Path
        If not None, save plot to file.
    """

    # Define radial x-axes angles -- uses our helper function!
    x = _define_radial_axes_angles(len(y))
    # Scale y-axis values with respect to a defined threshold -- uses our helper function!
    y = _scale_by_thresholds(y, thresholds, scaled_threshold)
    # Since our chart will be circular we append the first value of each property to the end
    y = y.append(y.iloc[0])

    # Set figure and subplot axis
    plt.figure(figsize=(6, 6))
    ax = plt.subplot(111, polar=True)

    # Plot data
    ax.fill(x, [scaled_threshold] * 5, "cornflowerblue", alpha=0.2)
    ax.plot(x, y["mean"], "b", lw=3, ls="-")
    ax.plot(x, y["mean"] + y["std"], "orange", lw=2, ls="--")
    ax.plot(x, y["mean"] - y["std"], "orange", lw=2, ls="-.")

    # From here on, we only do plot cosmetics
    # Set 0° to 12 o'clock
    ax.set_theta_offset(math.pi / 2)
    # Set clockwise rotation
    ax.set_theta_direction(-1)

    # Set y-labels next to 180° radius axis
    ax.set_rlabel_position(180)
    # Set number of radial axes' ticks and remove labels
    plt.xticks(x, [])
    # Get maximal y-ticks value
    if not y_max:
        y_max = int(ax.get_yticks()[-1])
    # Set axes limits
    plt.ylim(0, y_max)
    # Set number and labels of y axis ticks
    plt.yticks(
        range(1, y_max),
        ["5" if i == scaled_threshold else "" for i in range(1, y_max)],
        fontsize=16,
    )

    # Draw ytick labels to make sure they fit properly
    # Note that we use [:1] to exclude the last element which equals the first element (not needed here)
    for i, (angle, label) in enumerate(zip(x[:-1], properties_labels)):
        if angle == 0:
            ha = "center"
        elif 0 < angle < math.pi:
            ha = "left"
        elif angle == math.pi:
            ha = "center"
        else:
            ha = "right"
        ax.text(
            x=angle,
            y=y_max + 1,
            s=label,
            size=16,
            horizontalalignment=ha,
            verticalalignment="center",
        )

    # Add legend relative to top-left plot
    labels = ("mean", "mean + std", "mean - std", "rule of five area")
    ax.legend(labels, loc=(1.1, 0.7), labelspacing=0.3, fontsize=16)

    # Save plot - use bbox_inches to include text boxes
    if output_path:
        plt.savefig(output_path, dpi=300, bbox_inches="tight", transparent=True)

    plt.show()
在下文中,我们要绘制两个数据集的雷达图:
- 满足 Ro5 的化合物
- 违反 Ro5 的化合物
定义两个雷达图应保持相同的输入参数
thresholds = {"molecular_weight": 500, "n_hba": 10, "n_hbd": 5, "logp": 5}
scaled_threshold = 5
properties_labels = [
    "Molecular weight (Da) / 100",
    "# HBA / 2",
    "# HBD",
    "LogP",
]
y_max = 8
- 绘制了满足 Ro5 的化合物数据集的雷达图。
plot_radar(
    molecules_ro5_fulfilled_stats,
    thresholds,
    scaled_threshold,
    properties_labels,
    y_max,
)
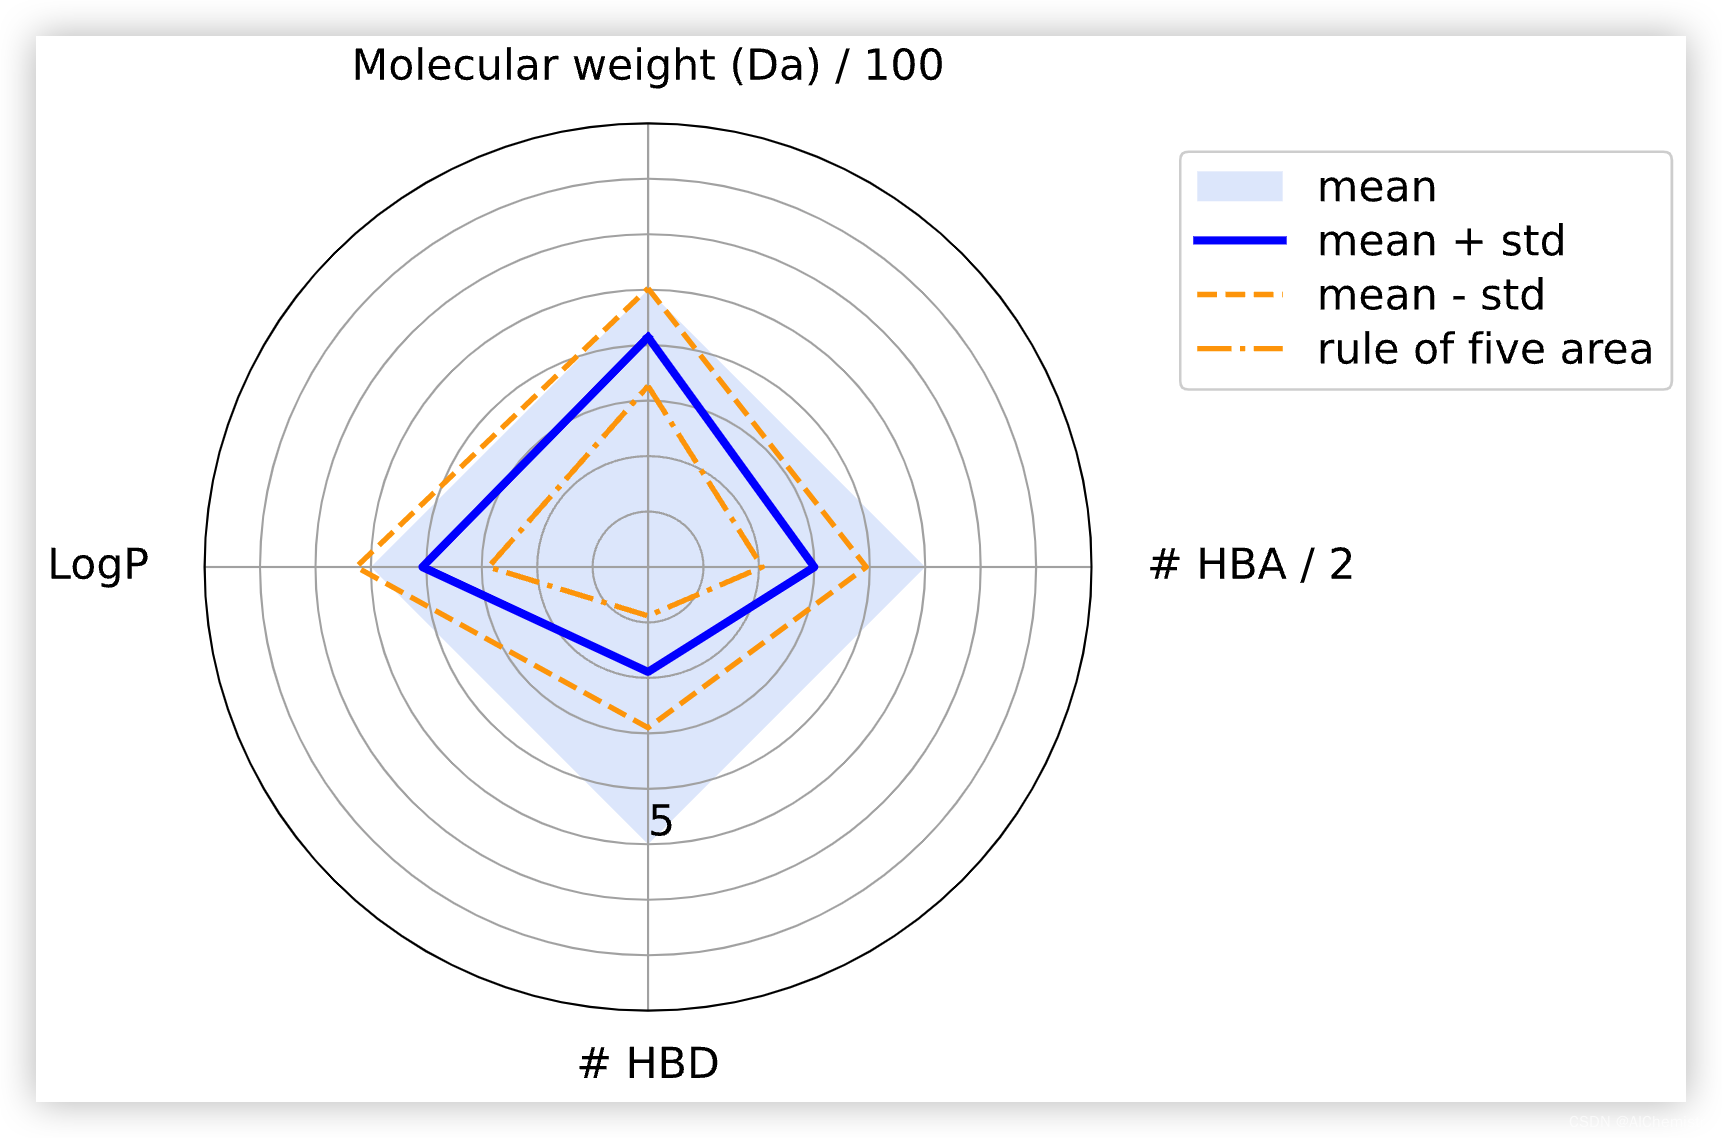
蓝色方块表示分子理化性质符合 Ro5 的区域。
蓝线突出显示平均值,而橙色虚线显示标准偏差。
我们可以看到,平均值从不违反任何 Lipinski 规则。但是,根据标准偏差,某些属性的值大于 Ro5 阈值。这是可以接受的,因为根据 Ro5,可以违反四项规则中的一项。
- 绘制了违反 Ro5 的化合物数据集的雷达图。 violate the Ro5.
plot_radar(
    molecules_ro5_violated_stats,
    thresholds,
    scaled_threshold,
    properties_labels,
    y_max,
)
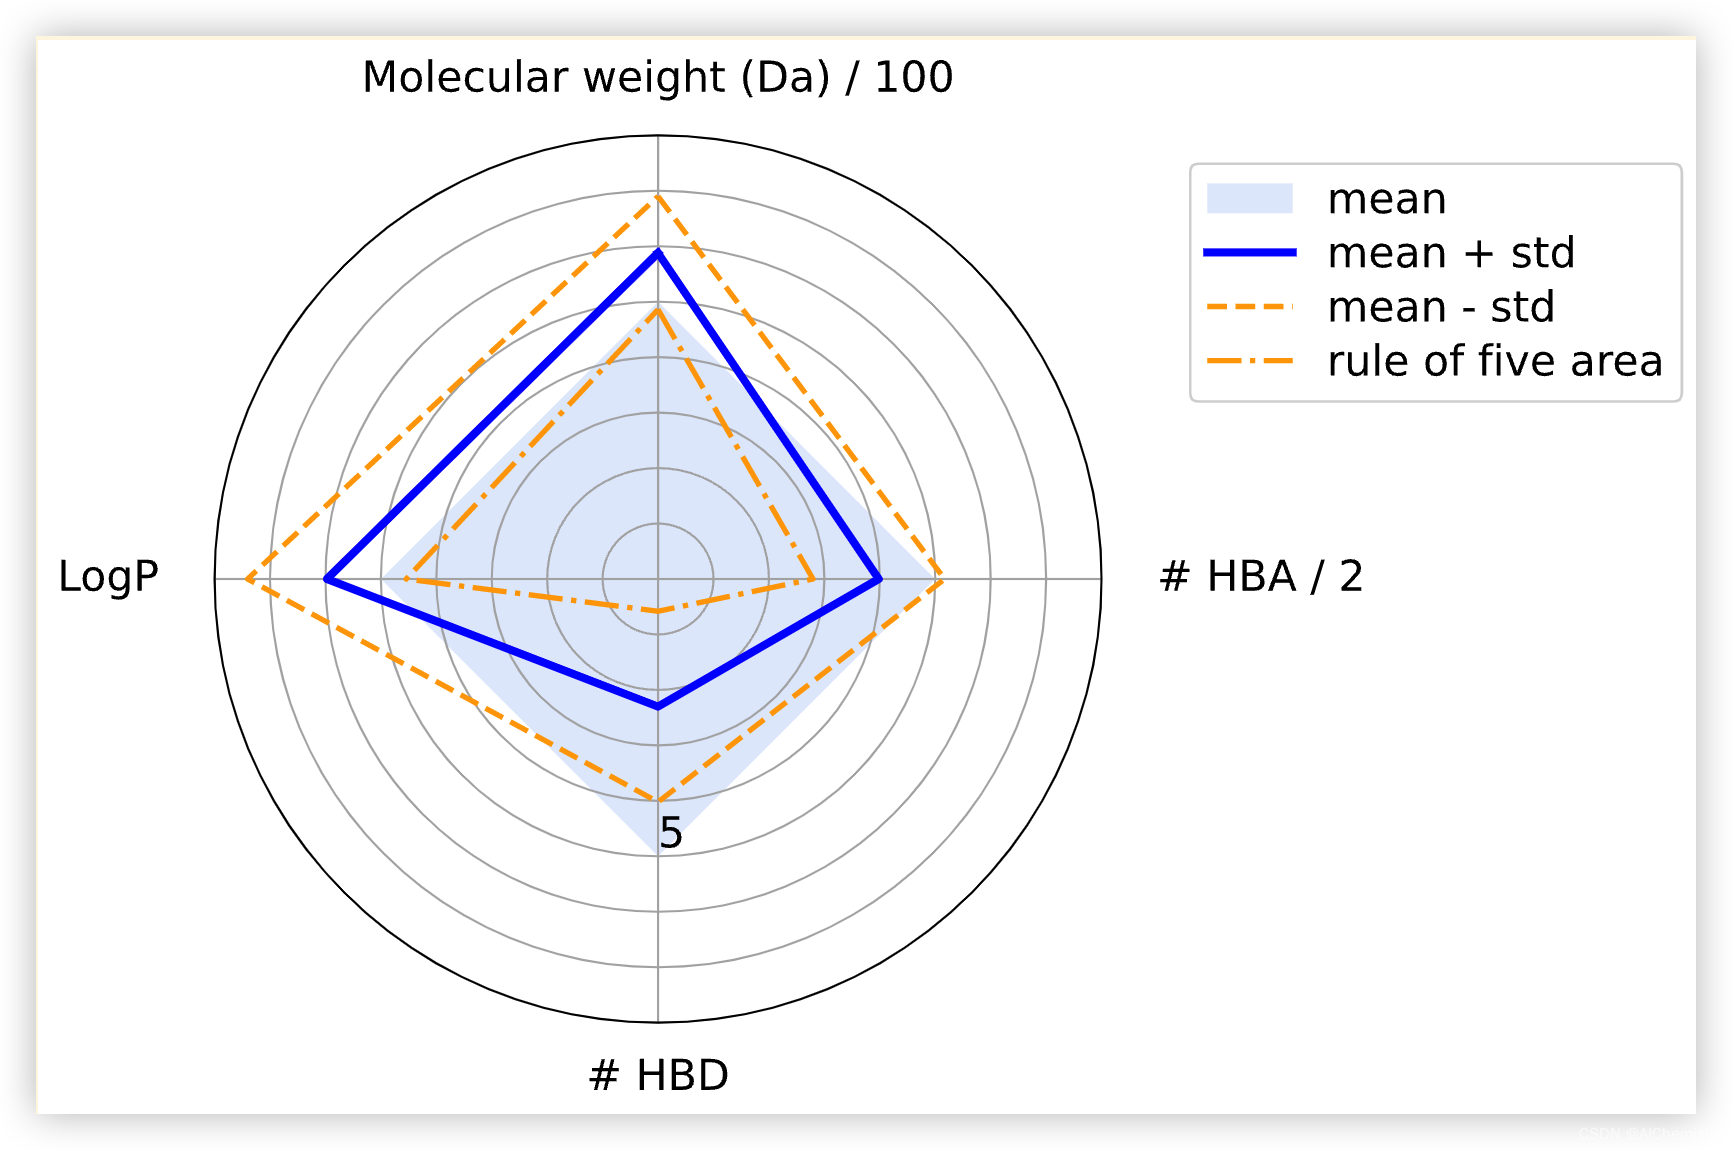
我们看到化合物大多违反 Ro5,因为它们的 logP 值和分子量。