目录
一、说明
二、使用mplfinance的前提
2.1 mplfinance生态圈
2.1 安装mplfinance
三、mplfinance绘图
3.1 单变量图
3.2 将用户自己生成的曲线添加到 mplfinance plot()
四、显示EWM和MACD
一、说明
在做量化分析的时候,需要有能力计算种种曲线,如EWM和MACD,或布林线等。经过多年研究,我们发现pandas和Mplfinance搭配是目前的最佳选择。然而,初学者对Mplfinance知道不多,因此,本系列文档将举出Mplfinance的开发潜力,并辅助一些实验演示给大家。
二、使用mplfinance的前提
2.1 mplfinance生态圈
使用mplfinance之前,首先了解mplfinance所依赖的环境,基本如下:
- python生态环境
- matplotlib 和 pandas生态环境
- Tushare应用包
- numpy环境
- QT5也需要额外安装
2.1 安装mplfinance
pip install --upgrade mplfinance三、mplfinance绘图
3.1 单变量图
1)函数原型:
mpf.plot(data, type, title, ylabel, style, volume, ylabel_lower, show_nontrading, figratio, mav)
2)参数表:
| 参数名称 | 参数意义 | 性质 |
|---|---|---|
| data | data为一个DataFrame对象,要保证其有Open, High, Low, Close四个列。且行索引的名称必须是’Date‘,此外还有一列是’Volume’,这一列不是必须的(如果要同时绘制成交量柱状图,则还需要该列名为Volume的列。) | |
| type | type为绘制图线的类型,可以的选择有* ‘ohlc’, ‘candle’(蜡烛图), ‘line’(直线,仅绘制收盘价时序图时用), ‘renko’, ‘pnf’。 | |
| title | title 即图片标题 默认不能有汉字和其他一些特殊字符,如果想使用汉字,需要加一些修改。 | |
| ylabel | ylabel: 纵轴的标签 | |
| style | 样式,这是我认为最赞的两个参数之一(另一个是mav,直接绘出均线,下边有介绍)。取值有‘binance’, ‘blueskies’, ‘brasil’, ‘charles’, ‘checkers’, ‘classic’, ‘default’, ‘mike’, ‘nightclouds’, ‘sas’, ‘starsandstripes’, ‘yahoo’ | |
| volume | volume: True表示添加成交量,默认False。 | |
| ylabel_lower | ylabel_lower: 成交量的Y轴标签。 | |
| show_nontrading | show_nontrading: True显示非交易日,默认False。(这个一般不怎么常用。) | |
| figratio | figratio: 控制图表大小的元组。 | |
| mav | mav: 整数或包含整数的元组,是否在图表中添加移动平均线。如mav=(5, 10)表示添加5日均线和10日均线。 | |
| savefig: | 如果要保存生成的图片,则加入savefig参数,参数值为要保存的路径+文件名。 |
注意:这里mplfinance专门针对股票,因此,这里默认dataframe是pandas对象,其中数据是包含开盘价(Open)、最高价(High)、最低价(Low)和收盘价(Close)数据的 Pandas DataFrame 对象,以及 Pandas的DatetimeIndex索引(name=“Date”)。
# 从tushare调取 平安银行(000001 ) 股价数据
import tushare as ts
import pandas as pd
import mplfinance as mpf

df = ts.get_k_data("000001")
# print(df.columns)   Index(['date', 'open', 'close', 'high', 'low', 'volume', 'code']

# 然后 将该DataFrame对象处理为适合我们使用的格式
df = df.loc[:, ['date', 'open', 'close', 'high', 'low', 'volume', 'code']]
df.rename(
    columns={
        'date': 'Date', 'open': 'Open','close': 'Close',
        'high': 'High', 'low': 'Low', 'volume': 'Volume'},
    inplace=True)       # 重定义列名,方便统一规范操作。
df['Date'] = pd.to_datetime(df['Date'])  # 转换日期列的格式,便于作图
df.set_index(['Date'], inplace=True)  # 将日期列作为行索引
df = df.sort_index()  # 倒序,因为Tushare的数据是最近的交易日数据显示在DataFrame上方,倒序后方能保证作图时X轴从左到右时间序列递增。

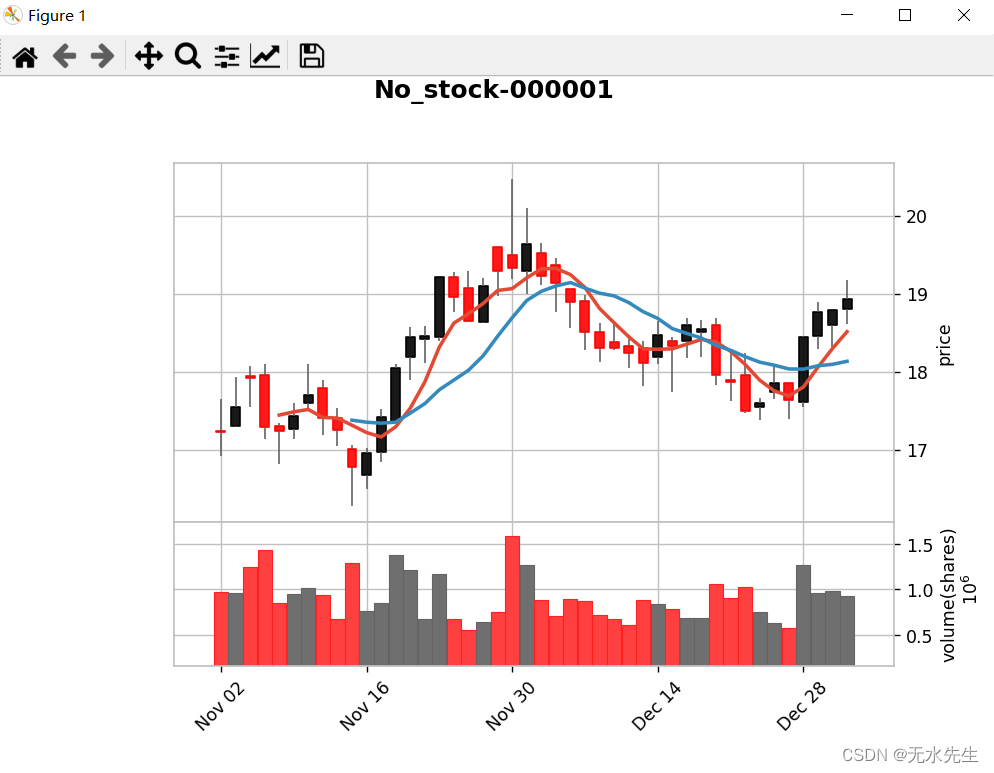
mpf.plot(df.loc['2020-11': '2020-12'], type='candle', ylabel="price", style='charles', title='No_stock-000001', mav=(5, 10), volume=True, ylabel_lower="volume(shares)")
3.2 将用户自己生成的曲线添加到 mplfinance plot()
mplfinance/addplot.ipynb at master · matplotlib/mplfinance · GitHub
有时您可能希望在与基本 OHLC 或Candle图相同的图形中绘制其他数据。例如,您可能想要添加技术研究的结果或一些额外的市场数据,比如,Ema线或Macd。
因为 mplfinance.plot()是唯一绘制函数,因此,这是通过使用 addplot(“附加图”)关键字将信息传递到对 mplfinance.plot() 的调用来完成的。
addplot 关键字需要一个字典。该字典必须包含键“数据”:其值是要绘制的实际附加数据。此附加数据可能是List、numpy.ndarray、pandas.Series 或 pandas.DataFrame。如果它是一个 DataFrame,那么将绘制该数据框中的所有列。
强烈建议调用者使用辅助函数 mplfinance.make_addplot() 构造 addplot 字典(参见下面的示例)。这个辅助函数:
- 简化了指定附加图的语法
- 确保字典包含所有可能的可配置关键字的默认值
- 对关键字值进行一些基本检查以确保它们的类型正确。
addplot 关键字还可以接受字典列表,作为在基本 OHLCV 数据之上绘制多个附加数据集的一种可能方式。请参阅以下示例中的具体详细信息。
我们知道,使用matplotlib.pyplot绘图的时候,采用的是面向对象绘图的思想。首先要有一个figure,即一个面板,然后我们只要在这个面板上添加各种对象,这个图像就会越来越完美。(理解面向对象绘图点击链接:Python–Matplotlib库与数据可视化③)。
matplotlib可以一句一句地逐句给图形添加元素。
有那么一点不同的是,mplfinance库把这一切都给封装起来了。最后把这一切对象全都集中在了一个mpf.plot()函数中,我们只需要为此传入合规的参数。
假设我们想要绘制下布林带以及基本的 OHLCV 图。我们使用 make_addplot() 创建 addplot 字典,并将其传递给 plot() 函数:
1)添加一条线'LowerB'
apdict = mpf.make_addplot(df['LowerB'])
mpf.plot(df,volume=True,addplot=apdict)
2)在创建 addplot 字典时,我们可以指定我们想要一个散点图:
apd = mpf.make_addplot(df['LowerB'],type='scatter')
mpf.plot(df,addplot=apd)
四、显示EWM和MACD
直到目前,我们已经有足够知识生成和显示EWM和MACD线了。值得注意的是,EWM不是Mplfinance的功能,而是pandas功能,其函数原型是:
Series.ewm(span,adjuest).mean()下面代码将介绍EWM的计算,以及MACD的曲线:
import pandas as pd
import mplfinance as mpf
import matplotlib.animation as animation

mins = pd.read_csv('sh300_1min.csv',index_col=0,parse_dates=True)
mins["day"] = pd.to_datetime(mins["day"])
mins = mins.set_index("day")
mins.index.name = 'Time'
candle_chart = mins.tail(240)

df = candle_chart

exp12     = df['close'].ewm(span=12, adjust=False).mean()
exp26     = df['close'].ewm(span=26, adjust=False).mean()
macd      = exp12 - exp26
signal    = macd.ewm(span=9, adjust=False).mean()
histogram = macd - signal

apds = [mpf.make_addplot(exp12,color='lime'),
        mpf.make_addplot(exp26,color='c'),
        mpf.make_addplot(histogram,type='bar',width=0.7,panel=1,
                         color='dimgray',alpha=1,secondary_y=False),
        mpf.make_addplot(macd,panel=1,color='fuchsia',secondary_y=True),
        mpf.make_addplot(signal,panel=1,color='b',secondary_y=True),
       ]

s = mpf.make_mpf_style(base_mpf_style='classic',rc={'figure.facecolor':'lightgray'})

fig, axes = mpf.plot(df,type='candle',addplot=apds,figscale=1.5,figratio=(7,5),title='\n\nMACD',
                     style=s,volume=True,volume_panel=2,panel_ratios=(6,3,2),returnfig=True)

mpf.show()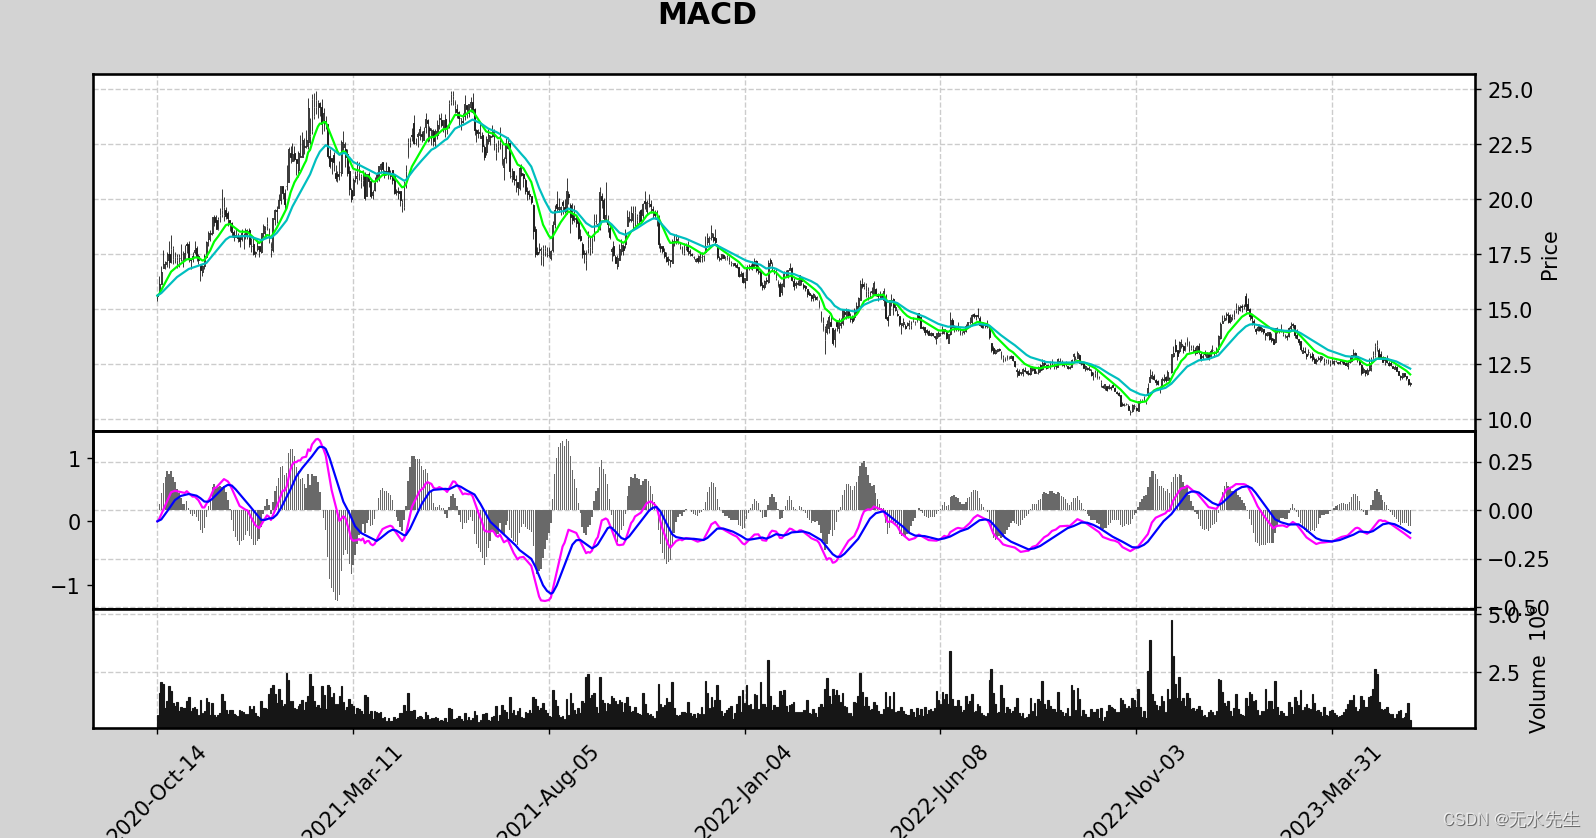
五、滚屏显示移动K线
如果你希望能动态看到整个绘制过程,增加个animation即可:
# 公众号:二七阿尔量化
import pandas as pd
import mplfinance as mpf
import matplotlib.animation as animation

mins = pd.read_csv('sh300_1min.csv',index_col=0,parse_dates=True)
mins["day"] = pd.to_datetime(mins["day"])
mins = mins.set_index("day")
mins.index.name = 'Time'
candle_chart = mins.tail(240)

df = candle_chart

exp12     = df['close'].ewm(span=12, adjust=False).mean()
exp26     = df['close'].ewm(span=26, adjust=False).mean()
macd      = exp12 - exp26
signal    = macd.ewm(span=9, adjust=False).mean()
histogram = macd - signal

apds = [mpf.make_addplot(exp12,color='lime'),
        mpf.make_addplot(exp26,color='c'),
        mpf.make_addplot(histogram,type='bar',width=0.7,panel=1,
                         color='dimgray',alpha=1,secondary_y=False),
        mpf.make_addplot(macd,panel=1,color='fuchsia',secondary_y=True),
        mpf.make_addplot(signal,panel=1,color='b',secondary_y=True),
       ]

s = mpf.make_mpf_style(base_mpf_style='classic',rc={'figure.facecolor':'lightgray'})

fig, axes = mpf.plot(df,type='candle',addplot=apds,figscale=1.5,figratio=(7,5),title='\n\nMACD',
                     style=s,volume=True,volume_panel=2,panel_ratios=(6,3,2),returnfig=True)

mpf.show()

ax_main = axes[0]
ax_emav = ax_main
ax_hisg = axes[2]
ax_macd = axes[3]
ax_sign = ax_macd
ax_volu = axes[4]


def animate(ival):
    if (20+ival) > len(df):
        print('no more data to plot')
        ani.event_source.interval *= 3
        if ani.event_source.interval > 12000:
            exit()
        return
    data = df.iloc[0:(30+ival)]
    exp12     = data['close'].ewm(span=12, adjust=False).mean()
    exp26     = data['close'].ewm(span=26, adjust=False).mean()
    macd      = exp12 - exp26
    signal    = macd.ewm(span=9, adjust=False).mean()
    histogram = macd - signal
    apds = [mpf.make_addplot(exp12,color='lime',ax=ax_emav),
            mpf.make_addplot(exp26,color='c',ax=ax_emav),
            mpf.make_addplot(histogram,type='bar',width=0.7,
                             color='dimgray',alpha=1,ax=ax_hisg),
            mpf.make_addplot(macd,color='fuchsia',ax=ax_macd),
            mpf.make_addplot(signal,color='b',ax=ax_sign),
           ]

    for ax in axes:
        ax.clear()
    mpf.plot(data,type='candle',addplot=apds,ax=ax_main,volume=ax_volu)

ani = animation.FuncAnimation(fig,animate,interval=100)

mpf.show()
参考资源:
mplfinance/addplot.ipynb at master · matplotlib/mplfinance · GitHub
mplfinance/examples at master · matplotlib/mplfinance · GitHub

