Django是一个高效、灵活的Python Web框架,它可以快速地构建Web应用程序。在本篇文章中,我们将介绍如何使用django读取csv文件生成数据可视化系统。
1.使用虚拟环境创建项目
pip install virtualenv
pip install virtualenvwrapper

2.安装django模块,可使用代码 pip install django 进行安装,也可以在Pycharm的Python解释器下”+”安装
pip install django3.创建项目,因为爬取的数据可能审核不通过,所以就不发了,读取的csv文件我们放到一个文件夹中
django-admin startproject bishe-master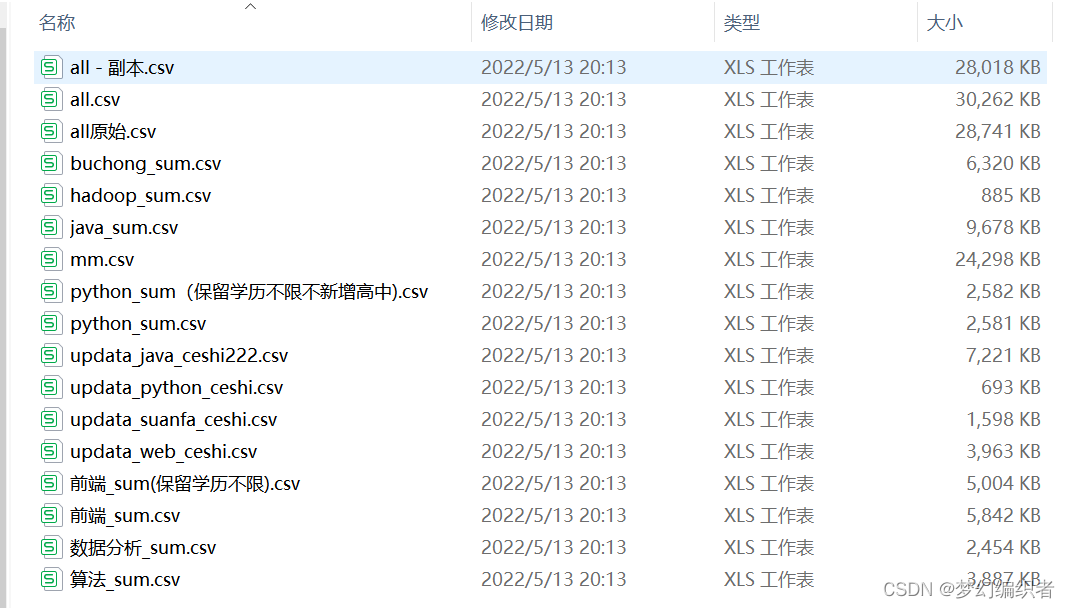
4.创建app
cd bishe-master

python manage.py startapp User
5..设置setting.py文件代码
INSTALLED_APPS = [
    'simpleui',
    'django.contrib.admin',
    'django.contrib.auth',
    'django.contrib.contenttypes',
    'django.contrib.sessions',
    'django.contrib.messages',
    'django.contrib.staticfiles',
    'user.apps.UserConfig',
    'import_export',

]

MIDDLEWARE = [
    'django.middleware.security.SecurityMiddleware',
    'django.contrib.sessions.middleware.SessionMiddleware',
    'django.middleware.common.CommonMiddleware',
    # 'django.middleware.csrf.CsrfViewMiddleware',
    'django.contrib.auth.middleware.AuthenticationMiddleware',
    'django.contrib.messages.middleware.MessageMiddleware',
    # 'django.middleware.clickjacking.XFrameOptionsMiddleware',
]

ROOT_URLCONF = 'testdjango.urls'

TEMPLATES = [
    {
        'BACKEND': 'django.template.backends.django.DjangoTemplates',
        'DIRS': [os.path.join(BASE_DIR, 'templates')],
        'APP_DIRS': True,
        'OPTIONS': {
            'context_processors': [
                'django.template.context_processors.debug',
                'django.template.context_processors.request',
                'django.contrib.auth.context_processors.auth',
                'django.contrib.messages.context_processors.messages',
            ],
        },
    },
]

WSGI_APPLICATION = 'testdjango.wsgi.application'

# Database
# https://docs.djangoproject.com/en/2.2/ref/settings/#databases

DATABASES = {
    'default': {
        'ENGINE': 'django.db.backends.mysql',
        'NAME': 'test',
        'HOST': '127.0.0.1',
        'PORT': '3306',
        'USER': 'bd',
        'PASSWORD': '123456',
    }
}

# Password validation
# https://docs.djangoproject.com/en/2.2/ref/settings/#auth-password-validators

AUTH_PASSWORD_VALIDATORS = [
    # {
    #     'NAME': 'django.contrib.auth.password_validation.UserAttributeSimilarityValidator',
    # },
    {
        'NAME': 'django.contrib.auth.password_validation.MinimumLengthValidator',
    },
    {
        'NAME': 'django.contrib.auth.password_validation.CommonPasswordValidator',
    },
    {
        'NAME': 'django.contrib.auth.password_validation.NumericPasswordValidator',
    },
]

# Internationalization
# https://docs.djangoproject.com/en/2.2/topics/i18n/

# 语言
# 时区
TIME_ZONE = 'Asia/Shanghai'


USE_I18N = True

USE_L10N = True

USE_TZ = True

# Static files (CSS, JavaScript, Images)
# https://docs.djangoproject.com/en/2.2/howto/static-files/

STATIC_URL = '/static/'

STATICFILES_DIRS = os.path.join(BASE_DIR, 'static'),

# SIMPLEUI_HOME_PAGE = '/echart/?type=index'
6.testdjango/urls.py配置,在这里定义了项目中所有可访问的 URL 地址和对应的视图函数
from django.contrib import admin
from django.urls import path,re_path
from user import views
from django.urls import include  # 导入include
from django.views.generic import RedirectView

urlpatterns = [
    path('admin/', admin.site.urls),
    re_path(r'^$',views.zhuce),
    path('ceshi2/', views.ceshi2),
    path('test_pic',views.test_pic),
    path('denglu/',views.denglu),
    path('zhuce/', views.zhuce),
    path('pie_bar_test', views.pie_bar_test),
    path('job_demand',views.job_demand),
    path('xinzi_bar', views.xinzi_bar),
    path('xinzi_predict',views.xinzi_predict),

]
8.user/models.py配置,这里定义了四个Django模型:job、stu、comp和test。每个模型都有不同的字段,例如job模型有岗位名称、能力要求、地点、公司名、公司规模、公司薪资等字段。同时,每个模型都定义了Meta类,用于设置模型的元数据,例如verbose_name_plural字段用于设置模型在Admin后台显示的名称。
from django.db import models


# Create your models here.

class job(models.Model):
    job_name = models.CharField('岗位名称', max_length=20, null=True)
    work_demand = models.CharField('能力要求', max_length=80, null=True)
    company_locale = models.CharField('地点', max_length=20, null=True)
    company_name = models.CharField('公司名', max_length=100, null=True)
    guimo = models.CharField('公司规模', max_length=20, null=True)
    job_salary = models.CharField('公司薪资', max_length=20, null=True)
    job_salary_fif = models.BooleanField('薪资是否不超过15K', choices=((True, '是'), (False, '否')), null=True)
    demand = models.CharField('demand', max_length=20, null=True)

    def __unicode__(self):
        return self.job_name

    class Meta:
        verbose_name_plural = '招聘岗位信息表'


class stu(models.Model):
    name = models.CharField(max_length=20, unique=True, verbose_name='姓名')  # ,help_text='不要写小名'
    gender = models.BooleanField('性别', choices=((True, '女'), (False, '男')))
    age = models.IntegerField(default=18, verbose_name='年纪')
    stuid = models.CharField(max_length=20, verbose_name='学号(登录账号)')
    password = models.CharField('登录密码', max_length=20, null=True)
    stuclass = models.CharField(max_length=20, verbose_name='班级')
    academy = models.CharField(max_length=20, verbose_name='学院')
    ability = models.TextField(blank=True, null=True, verbose_name='技能')  # 可插入为空或设置default

    def __str__(self):
        return self.name

    class Meta:
        verbose_name_plural = '学生信息表'


class comp(models.Model):
    name = models.CharField(max_length=20, verbose_name='公司名')
    type = models.CharField(max_length=20, verbose_name='类型')

    def __unicode__(self):
        return self.name

    class Meta:
        verbose_name_plural = '公司信息表'


class test(models.Model):
    uname = models.CharField(max_length=32)
    upwd = models.CharField(max_length=64)
9.user/tests.py配置,在这里定义了两个资源类(StuResource和JobResource),用于将模型(Model)转换为CSV、JSON、XML等格式。这里使用了import_export库来实现这个功能。在这个库中,资源类(Resource)用于定义如何将模型转换为其他格式,Meta类用于指定模型、导入ID字段和排除字段等信息。具体来说,StuResource将模型stu转换为其他格式,JobResource将模型job转换为其他格式
from import_export import resources
from .models import *


class StuResource(resources.ModelResource):
    class Meta:
        model =  stu
        # import_id_fields = ['id','name','stuid','stuclass','academy', 'ability', 'age','gender']
        # exclude = ['id']   #排除id
        #上一行决定了update_or_create,可以避免重复导入

class JobResource(resources.ModelResource):
    class Meta:
        model = job
10.user/views.py配置,在这里是处理用户输入的数据,将其存储在列表中,并且根据用户选择的职位类型,读取相应的数据文件。然后将城市、需求和公司规模等信息也加入到列表中,最后将这个列表作为参数传入到forest函数中进行预测,这里面是一个视图函数,用于生成总的岗位数量的饼图和柱状图。它首先读取一个CSV文件,并将其中的数据转换为DataFrame格式。然后,它从DataFrame中过滤出所有职位名称不为“其他职业”的数据,并统计每个职位名称出现的次数。接着,它将职位名称和出现次数分别存储在pie_data_index和pie_data中,并将它们组合成一个字典列表data。最后,它将这些数据传递给一个HTML模板,用于生成饼图和柱状图。
from django.shortcuts import render, redirect
import pandas as pd
from user.models import *
from sklearn.ensemble import RandomForestClassifier
from sklearn.model_selection import train_test_split


# 核心算法函数
def forest(list, df):
    df['job_salary_range'] = df['job_salary_range'].astype(str).map({'0-10K': 0, '10-20K': 1, '20-30K': 2, '>30K': 3})
    y = df['job_salary_range']
    x = df.drop(labels=['job_salary_range', 'job_name', 'company_name'], axis=1)  # 删除掉无关列
    x = pd.get_dummies(x)  # 独热编码
    xtrain, xtest, ytrain, ytest = train_test_split(x, y, test_size=0.2, random_state=5)  # test_size是x,y测试集占总的20%
    rfc = RandomForestClassifier(max_depth=None, min_samples_split=2,
                                 random_state=0)  # 实例化rfc = rfc.fit(xtrain, ytrain)    #用训练集数据训练
    rfc = rfc.fit(xtrain, ytrain)
    # result = rfc.score(xtest, ytest)  # 导入测试集,rfc的接口score计算的是模型准确率accuracy
    res = rfc.predict(list)
    return res


def xinzi_predict(request):
    if request.method == 'GET':
        return render(request, 'predict_xinzi.html')
    else:
        list1 = []
        list_sum = []
        java1 = request.POST.get('java1')  # JAVA要求
        spring1 = request.POST.get('spring1')
        sql1 = request.POST.get('sql1')
        python1 = request.POST.get('python1')  # Python要求
        linux1 = request.POST.get('linux1')
        spider1 = request.POST.get('spider1')
        html1 = request.POST.get('html1')  # web要求
        cssjs1 = request.POST.get('cssjs1')
        vue1 = request.POST.get('vue1')
        jiqi1 = request.POST.get('jiqi1')  # 算法工程师要求
        tuxiang1 = request.POST.get('tuxiang1')
        C1 = request.POST.get('C1')
        city = request.POST.get('city')
        demand = request.POST.get('demand')
        guimo = request.POST.get('guimo')
        a = request.POST.get('job_name')
        global df  # 声明全局变量
        if a == 'Java开发工程师':
            list1.append(java1)
            list1.append(spring1)
            list1.append(sql1)
            df = pd.read_csv('C:\\pythonProject\\pythonProject2\\bishe-master\\data_sum\\updata_java_ceshi222.csv',
                             encoding='gbk')
        elif a == 'Python开发工程师':
            list1.append(python1)
            list1.append(linux1)
            list1.append(spider1)
            df = pd.read_csv('C:\\pythonProject\\pythonProject2\\bishe-master\\data_sum\\updata_python_ceshi.csv',
                             encoding='gbk')
        elif a == 'web前端开发师':
            list1.append(html1)
            list1.append(cssjs1)
            list1.append(vue1)
            df = pd.read_csv('C:\\pythonProject\\pythonProject2\\bishe-master\\data_sum\\updata_web_ceshi.csv',
                             encoding='gbk')
        elif a == '算法工程师':
            list1.append(jiqi1)
            list1.append(tuxiang1)
            list1.append(C1)
            df = pd.read_csv('C:\\pythonProject\\pythonProject2\bishe-master\\data_sum\\updata_suanfa_ceshi.csv',
                             encoding='gbk')
        city = city.split(',')
        list1.extend(city)
        demand = demand.split(',')
        list1.extend(demand)
        guimo = guimo.split(',')
        list1.extend(guimo)
        list_sum.append(list1)  # 得到双中括号包起来的列表,并且里面的元素都变成了算法可以直接调用的元素

        res = forest(list_sum, df)
        if res[0] == 0:
            message = '预测薪资范围是每月5-10K'
        elif res[0] == 1:
            message = '预测薪资范围是每月10-20K'
        elif res[0] == 2:
            message = '预测薪资范围是每月20-30K'
        else:
            message = '预测薪资范围是每月在30k以上'
    return render(request, 'predict_xinzi.html', {'message': message})


def ceshi2(request):
    return render(request
                  , 'ceshi2.html',
                  {
                      'name': 'all',
                      'users': ['ab', 'qwe'],
                      'user_dict': {'k1': 'v1', 'k2': 'v2'},
                      'us': [
                          {'id': 1, 'name': 'xiaomm', 'email': '1111@qq.com'},
                          {'id': 2, 'name': 'xoapxaopx', 'email': 'ssss@163.com'},
                      ]
                  }
                  )


def job_demand(request):
    return render(request, 'job_demand_pie_sum.html', )


def xinzi_bar(request):
    return render(request, 'xinzi_bar_sum.html')


def denglu(request):
    if request.method == "GET":
        return render(request, 'zhuce.html')
    else:
        name = request.POST.get('username')
        pwd = request.POST.get('password')
        test = stu.objects.filter(stuid=name, password=pwd)
        name = test.values('name')[0]['name']  # 通过学号和登录密码查询到学生的姓名
        if test:
            return render(request, 'zhuye.html', {'username': name})
        else:
            error_msg = '用户名或密码错误'
            return render(request, 'zhuce.html', {"error_msg": error_msg})


def zhuce(request):
    if request.method == "POST":
        name = request.POST.get("uname")
        stuid = request.POST.get("stuid")
        if stu.objects.filter(stuid=stuid):
            return render(request, 'zhuce.html', {"message": '该账号已存在,请重新注册!'})
        aca = request.POST.get("aca")
        clas = request.POST.get("class")
        password = request.POST.get("password")
        age = request.POST.get("age")
        stu.objects.create(name=name, stuid=stuid, academy=aca, stuclass=clas, age=age, gender=1, password=password)
        return render(request, 'zhuce.html', {"msg": '注册成功'})
    else:
        return render(request, "zhuce.html")


# 总的岗位数量的饼图和柱状图
def pie_bar_test(request):
    df = pd.read_csv('C:\\pythonProject\\pythonProject2\\bishe-master\data_sum\\all.csv', encoding='gbk',
                     low_memory=False,
                     converters={'work_demand': str})
    dd = df.loc[df['job_name'] != '其他职业']
    pie_data_index = list(dd['job_name'].value_counts().index)
    pie_data = list(dd['job_name'].value_counts())
    data = []
    for i in range(len(pie_data)):
        dic = {}
        dic['name'] = pie_data_index[i]
        dic['value'] = pie_data[i]
        data.append(dic)
    return render(request, 'test.html', {"pie_data_index": pie_data_index,
                                         "data": data,
                                         "pie_data": pie_data,
                                         })


# 辅助函数,用于主展示屏展示工作要求饼图
def abi_class(list):
    newlist = []
    for ele in list:
        newlist += ele.split(',')
    newlist = [x.strip() for x in newlist]  # 这两行是为了使原df的工作要求单个呈现以逗号分割
    res = dict()
    for a in set(newlist):
        res[a] = newlist.count(a)
    ll = sorted(res.items(), key=lambda item: item[1], reverse=True)  # 按从大到小排序每种技能的出现次数
    ll = ll[0:6]  # 取出list前6个值
    return ll


def test_pic(request):
    df = pd.read_csv('C:\\pythonProject\\pythonProject2\\bishe-master\\data_sum\\all.csv', encoding='gbk', low_memory=False,
                     converters={'work_demand': str})
    # 取出每个城市及其岗位数
    job = list(df['company_locale'].value_counts().index)
    job1 = list(df['company_locale'].value_counts())

    # 修改成元素为字典的list,以便地图绘制
    data2 = []
    for i in range(len(job)):
        dic = {}
        dic['name'] = job[i]
        dic['value'] = job1[i]
        data2.append(dic)

    # 取出java技能各占比
    a = df['work_demand'].str.split()
    list1 = []
    x = a.copy()
    for i in range(len(x)):
        if 'Java' in df['job_name'][i]:
            list1 += x[i]
    list1 = abi_class(list1)
    abi_num = []
    abi_name = []
    for i in range(len(list1)):
        if i < 6:
            abi_num.append(list1[i][1])
            abi_name.append(list1[i][0])
    abi_snum = []
    for i in range(len(abi_name)):
        dict = {}
        dict['value'] = abi_num[i]
        dict['name'] = abi_name[i]
        abi_snum.append(dict)

    # 取出java、python和web在各地区薪资图
    dff = df.loc[df['job_name'] == 'Java']
    grouped2 = dff.groupby([df['job_name'], df['company_locale']])
    a = grouped2['job_salary'].mean()
    a = a.map(lambda x: int(x))
    java_cities_price = a.values.tolist()

    ddff = df.loc[df['job_name'] == 'Python']
    grouped2 = ddff.groupby([df['job_name'], df['company_locale']])
    a = grouped2['job_salary'].mean()
    a = a.map(lambda x: int(x))
    python_cities_price = a.values.tolist()

    ddd = df.loc[df['job_name'] == 'web']
    grouped2 = ddd.groupby([df['job_name'], df['company_locale']])
    a = grouped2['job_salary'].mean()
    a = a.map(lambda x: int(x))
    web_cities_price = a.values.tolist()

    dfdf = df.loc[df['job_name'] == '大数据']
    grouped2 = dfdf.groupby([df['job_name'], df['company_locale']])
    a = grouped2['job_salary'].mean()
    a = a.map(lambda x: int(x))
    hadoop_cities_price = a.values.tolist()

    # 得到招聘岗位数排名前八的公司,返回元素为字符串的列表
    a = list(df['company_name'].value_counts().index)
    b = list(df['company_name'].value_counts())
    ll = []
    for i in range(0, 10):
        c = str(i + 1) + '  ' + a[i] + '  ' + str(b[i]) + '个岗位'
        ll.append(c)

    # 取出不同岗位类型平均薪资
    gp = df.groupby('demand')
    a = gp['job_salary'].mean().sort_values(ascending=False)
    job_price_index = a.index.tolist()
    job_price = a.values.tolist()
    for i in range(len(job_price)):
        job_price[i] = int(job_price[i])
    # job_price = np.trunc(job_price)              #对list每个元素进行取整

    return render(request, '../templates/index.html', {"job": job,
                                                       "job1": job1,
                                                       "data2": data2,
                                                       "job_price_index": job_price_index,
                                                       "job_price": job_price,
                                                       "abi_name": abi_name,
                                                       "abi_snum": abi_snum,
                                                       "java_cities_price": java_cities_price,
                                                       "python_cities_price": python_cities_price,
                                                       "web_cities_price": web_cities_price,
                                                       "hadoop_cities_price": hadoop_cities_price,
                                                       "ll": ll,
                                                       })
11.templates/index.html
<html>
<head>
    <meta charset="utf-8">
    <title>index</title>
    <script type="text/javascript" src="/static/js/jquery.js"></script>
    <script type="text/javascript" src="/static/js/echarts.min.js"></script>
    <link rel="stylesheet" href="/static/css/comon0.css">
</head>
<script>
    $(window).load(function () {
        $(".loading").fadeOut()
    })


    $(document).ready(function () {
        var whei = $(window).width()
        $("html").css({ fontSize: whei / 20 })
        $(window).resize(function () {
            var whei = $(window).width()
            $("html").css({ fontSize: whei / 20 })
        });
    });
</script>
<!--右下角文字滚动效果-->
<script type="text/javascript">
	$(document).ready(function(){
		var html=$(".wrap ul").html()
		$(".wrap ul").append(html)
		var ls=$(".wrap li").length/2+1
		i=0
		ref = setInterval(function(){
			i++
			if(i==ls){
				i=1
				$(".wrap ul").css({marginTop:0})
				$(".wrap ul").animate({marginTop:-'.52'*i+'rem'},1000)
			}
	    	$(".wrap ul").animate({marginTop:-'.52'*i+'rem'},1000)


		},2400);
	})
</script>

<script>
    var my = {
        var_1: {{ job|safe }}
    }
    var my1 = {
        var_2: {{ job1|safe }}
    }
    var geo = {
        geo_1:{{ data2|safe }}
    }
    var job_prices = {
        job_price_index:{{ job_price_index|safe }},
        job_price:{{ job_price|safe }},
        java_cities_price:{{ java_cities_price|safe }},
        python_cities_price:{{ python_cities_price|safe }},
        web_cities_price:{{ web_cities_price|safe }},
        hadoop_cities_price:{{ hadoop_cities_price|safe }}
    }
    var job_ability = {
        abi_name:{{ abi_name|safe }},
        abi_snum:{{ abi_snum|safe }}

    }
</script>
<script language="JavaScript" src="/static/js/js.js"></script>
<body>
    <div class="canvas" style="opacity: .2">
        <iframe frameborder="0" src="/static/js/index.html" style="width: 100%; height: 100%"></iframe>
    </div>
    <div class="loading">
        <div class="loadbox"> <img src="/static/images/loading.gif"> 页面加载中... </div>
    </div>
    <div class="head">
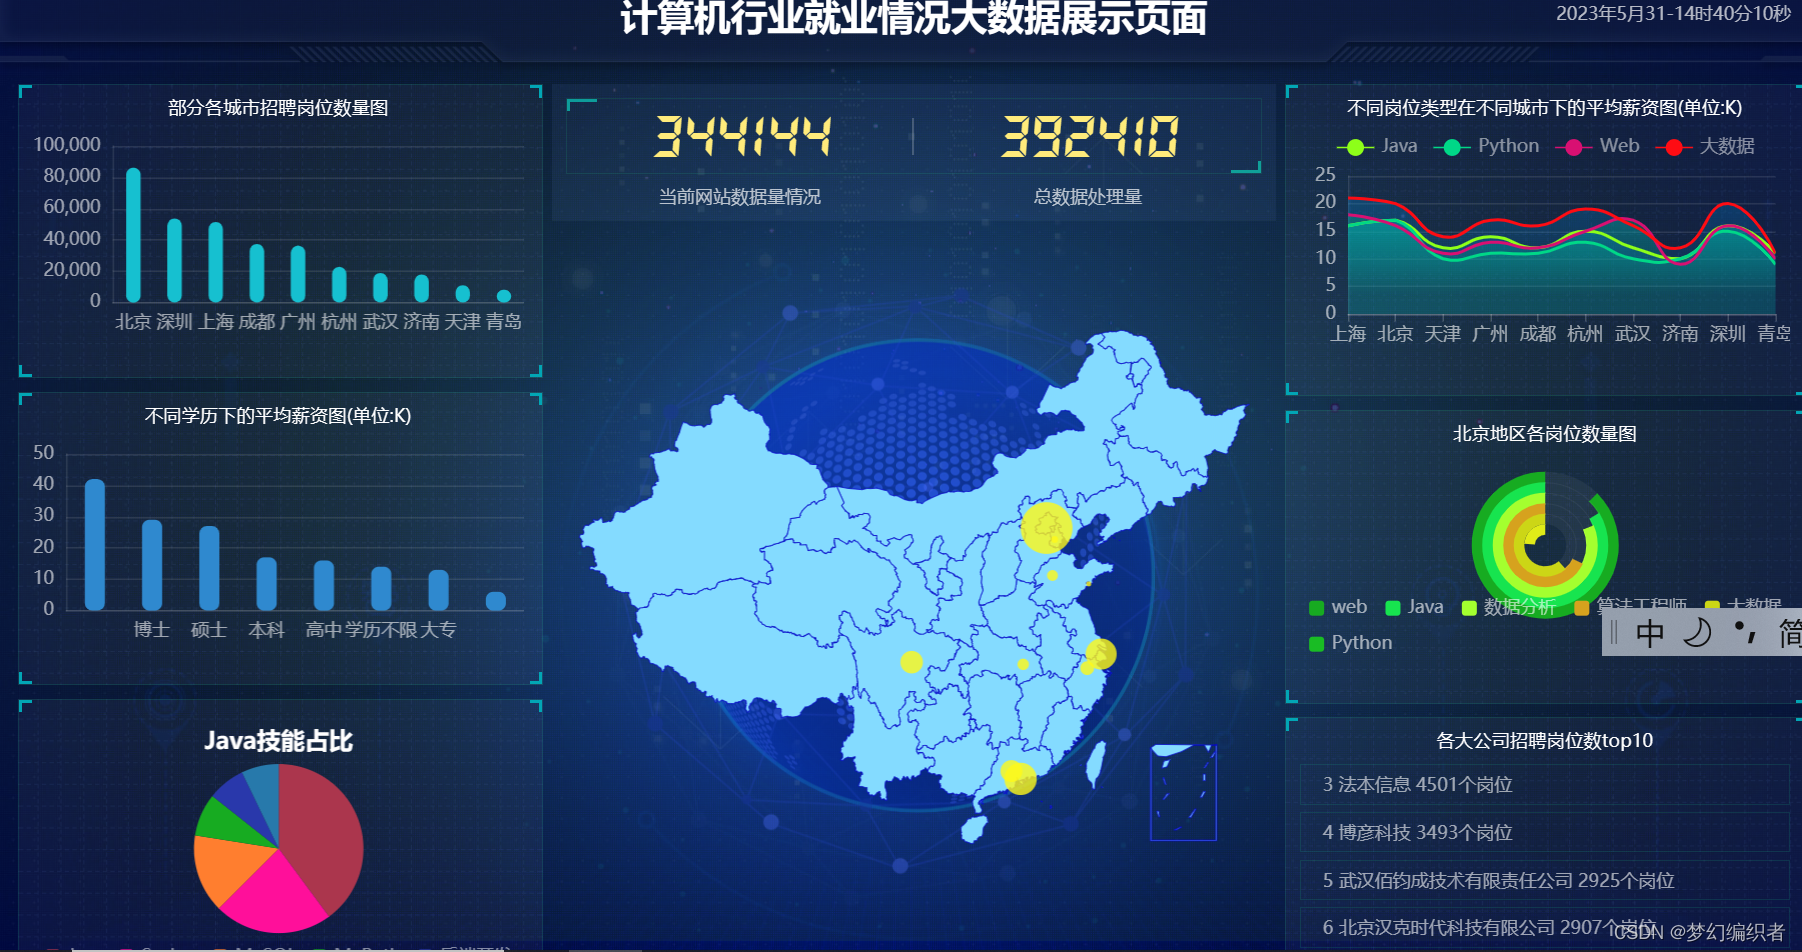
        <h1>计算机行业就业情况大数据展示页面</h1>
        <div class="weather"><!--<img src="images/weather.png"><span>多云转小雨</span>--><span id="showTime"></span></div>
        <script>
            var t = null;
            t = setTimeout(time, 1000);
            function time() {
                clearTimeout(t);
                dt = new Date();
                var y = dt.getFullYear();
                var mt = dt.getMonth() + 1;
                var day = dt.getDate();
                var h = dt.getHours();
                var m = dt.getMinutes();
                var s = dt.getSeconds();
                document.getElementById("showTime").innerHTML = y + "年" + mt + "月" + day + "-" + h + "时" + m + "分" + s + "秒";
                t = setTimeout(time, 1000);
            }
        </script>
    </div>


    <div class="mainbox">
        <ul class="clearfix">
            <li>
                <div class="boxall" style="height: 3.2rem">
                    <div class="alltitle"><a href="/pie_bar_test" style="color: white">部分各城市招聘岗位数量图</a></div>
                    <div class="allnav" id="echart1"></div>
                    <div class="boxfoot"></div>
                </div>
                <div class="boxall" style="height: 3.2rem">
                    <div class="alltitle"><a href="/xinzi_bar" style="color: white">不同学历下的平均薪资图(单位:K)</a></div>
                    <div class="allnav" id="echart2"></div>
                    <div class="boxfoot"></div>
                </div>
                <div class="boxall" style="height: 3.2rem">
                    <div style="height:100%; width: 100%;">
                        <div class="sy" id="fb1"></div>
                    </div>
                    <div class="boxfoot">

                    </div>
                </div>
            </li>


            <li>
                <div class="bar">
                    <div class="barbox">
                        <ul class="clearfix">
                            <li class="pulll_left counter">344144</li>
                            <li class="pulll_left counter">392410</li>
                        </ul>
                    </div>
                    <div class="barbox2">
                        <ul class="clearfix">
                            <li class="pulll_left">当前网站数据量情况 </li>
                            <li class="pulll_left">总数据处理量</li>
                        </ul>
                    </div>
                </div>
                <div class="map">
                    <div class="map1"><img src="/static/images/lbx.png"></div>
                    <div class="map2"><img src="/static/images/jt.png"></div>
                    <div class="map3"><img src="/static/images/map.png"></div>    <!-- 这里是三个图片压在一块 -->
                    <div class="map4" id="map_1"></div>
                </div>
            </li>


            <li>
                <div class="boxall" style="height:3.4rem">
                    <div class="alltitle">不同岗位类型在不同城市下的平均薪资图(单位:K)</div>
                    <div class="allnav" id="echart4"></div>
                    <div class="boxfoot"></div>
                </div>
                <div class="boxall" style="height: 3.2rem">
                    <div class="alltitle">北京地区各岗位数量图</div>
                    <div class="allnav" id="echart6"></div>
                    <div class="boxfoot"></div>
                </div>
                <div class="boxall" style="height: 3rem">
                    <div class="alltitle">各大公司招聘岗位数top10</div>
                    <div class="wrap">
                        <ul>
                        {% for item in ll %}
                            <li><p>{{ item }} </p></li>
                        {% endfor %}
                        </ul>
                    </div>
                    <div class="boxfoot"></div>
                </div>
            </li>
        </ul>
    </div>
    <div class="back"></div>


    <script type="text/javascript" src="/static/js/china.js"></script>
    <script type="text/javascript" src="/static/js/area_echarts.js"></script>


</body>
</html>
12templates/ceshi2.html
<!DOCTYPE html>
<html lang="en">
<head>
    <meta charset="UTF-8">
    <title>Title</title>
</head>
<body>
    <h1>模板学习</h1>
    <p>{{ name }}</p>
    <p>{{ users.0 }}</p>
    <p>{{ users.1 }}</p>
    <p>{{ k1 }}</p>
    <p>{{ k2 }}</p>
    <h2>循环测试</h2>
    <ul>
    {% for item in users %}
        <li>{{ item }} </li>
    {% endfor %}
    </ul>
    <h2>循环测试2</h2>
    <table border="1">
    {% for item in us %}
        <tr>
            <td>{{ item.id }} </td>
            <td>{{ item.name }}</td>
            <td>{{ item.email }}</td>
            <td>
                <a>编辑</a> | <a href="/del/?nid={{item.id}}">删除</a>
            </td>
        </tr>
    {% endfor %}
    </table>

    <form method="POST" action="/ceshi2/">
        <select name="job_name">
        <option>Java开发工程师</option>
        <option>Python开发工程师</option>
        <option>数据分析师</option>
            <option>web前端开发师</option>
            <option>算法工程师</option>
  </select>
        <br>
        是否擅长Java语言:<input type="radio" name="java1" value="1">非常熟练
            <input type="radio" name="java1" value="0">了解一点
    <input type="radio" name="java1" value="0">完全不懂
        <br>
        是否擅长spring:<input type="radio" name="spring1" value="1">非常熟练
            <input type="radio" name="spring1" value="0">了解一点
    <input type="radio" name="spring1" value="0">完全不懂
        <br>
        是否擅长一门数据库:<input type="radio" name="sql1" value="1">非常熟练
            <input type="radio" name="sql1" value="0">了解一点
    <input type="radio" name="sql1" value="0">完全不懂
        <br>
        最期望去的城市:
		<input type="radio" name="city" value="0,1,0,0,0,0,0">北京
        <input type="radio" name="city" value="1,0,0,0,0,0,0">上海
        <input type="radio" name="city" value="0,0,0,1,0,0,0">广州
        <input type="radio" name="city" value="0,0,0,0,0,0,1">深圳
        <input type="radio" name="city" value="0,0,0,0,0,1,0">济南
        <input type="radio" name="city" value="0,0,0,0,1,0,0">武汉
        <input type="radio" name="city" value="0,0,1,0,0,0,0">天津
        <br>
        当前最高学历:
		<input type="radio" name="demand" value="0,0,0,1,0">硕士
        <input type="radio" name="demand" value="0,0,1,0,0">本科
        <input type="radio" name="demand" value="0,1,0,0,0">大专
        <input type="radio" name="demand" value="1,0,0,0,0">中专/中技
        <input type="radio" name="demand" value="0,0,0,0,1">高中
        <br>
        最期望的公司规模:
		<input type="radio" name="guimo" value="0,0,0,0,1,0,0">20人以下
        <input type="radio" name="guimo" value="0,0,0,1,0,0,0">20-99人
        <input type="radio" name="guimo" value="1,0,0,0,0,0,0">100-299人
        <input type="radio" name="guimo" value="0,0,0,0,0,1,0">300-499人
        <input type="radio" name="guimo" value="0,0,0,0,0,0,1">500-999人
        <input type="radio" name="guimo" value="0,1,0,0,0,0,0">1000-9999人
        <input type="radio" name="guimo" value="0,0,1,0,0,0,0">10000人以上
        <input type="submit" value="提交" style="color: black;"/>
    </form>

    <h1>{{ message }}</h1>
</body>
</html>
13 templates/job_demand_pie_sum.html
<!DOCTYPE html>
<html>
<head>
<meta charset="UTF-8">
<title>Awesome-pyecharts</title>
<script type="text/javascript" src="https://assets.pyecharts.org/assets/echarts.min.js"></script>
<script type="text/javascript" src="https://assets.pyecharts.org/assets/themes/macarons.js"></script>
<script type="text/javascript" src="https://assets.pyecharts.org/assets/jquery.min.js"></script>
<script type="text/javascript" src="https://assets.pyecharts.org/assets/jquery-ui.min.js"></script>
<script type="text/javascript" src="https://assets.pyecharts.org/assets/ResizeSensor.js"></script>
<link rel="stylesheet" type="text/css" href="../static/css/zhuce.css">
<script src="../static/js/jquery.js"></script>
<script src="../static/js/vector.js"></script>
<link rel="stylesheet" href="https://assets.pyecharts.org/assets/jquery-ui.css">
<style>
ul {
list-style: none;
}
a {
text-decoration: none;
}
/*一级菜单样式, 头部导航栏以及登录注册按钮*/
.toubu {
z-index: 1000;
min-width: 1100px;
width: 100%;
height: 50px;
margin: 0px auto;
background-color: white;
font-size: 18px;
font-family: 微软雅黑;
position: fixed;
}
.toubu ul{
height: 50px;
}
.toubu ul li {
left: 500px;
float: left;
/*包含块*/
position:relative;
}
.toubu ul li a {
display: block;
font-size: 18px;
width: 160px;
height: 50px;
line-height: 46px;
text-align: center;
color: black;
}
.toubu ul li a:hover {
color: black;
background-color: aqua;
}
/*二级菜单样式*/
.toubu ul li ul {
position:absolute;
top:50px;
left:-500px;
display:none;
}
.toubu ul li ul li {
float:none;
}
.toubu ul li ul li a{
background-color: white;
font-size: 16px;
color: black;
/* border-top:1px solid #ccc; */
}
/*一级菜单悬停时二级菜单可见*/
.toubu ul li:hover ul {
display:block;
}
.img_1{ /*logo图片设置*/
position: absolute;
float: left;
top: 4px;
left: 250px;
}
.logo_1{
position: absolute;
float: left;
top: 9px;
font-family: "楷体";
font-size: 25px;
font-weight: bold;
left: 335px;
}
.btn_1{ /*登录按钮设置*/
position: absolute;
float: left;
width: 200px;
left: 1150px;
top: 8px;
color: darkslategrey;
background-color: white;
font-size: 15px;
border: 0;
}
</style>
</head>
<body>
<style>.box { z-index: 999; }</style>
<div class="toubu">
<ul>
<a href=""><img src="../static/images/J.png" alt="" class="img_1" width="70" height="40"/></a>
<span class="logo_1">就业信息</span>
<li><a href="">首页</a>
</li>
<li><a href="">平台数据展</a>
<ul>
<li><a href="/test_pic">大数据展示屏</a></li>
<li><a href="/job_demand">各岗位技能分析</a></li>
<li><a href="/xinzi_bar">薪资职位分析</a></li>
<li><a href="/pie_bar_test">各地区岗位分析</a></li>
</ul>
</li>
<li><a href="">其他功能</a>
<ul>
<li><a href="/xinzi_predict">岗位薪资预测</a></li>
</ul>
</li>
<li class="weather"><span id="showTime"></span></li>
<style>
.weather{
padding: 15px;
}
</style>
<script>
var t = null;
t = setTimeout(time, 1000);
function time() {
clearTimeout(t);
dt = new Date();
var y = dt.getFullYear();
var mt = dt.getMonth() + 1;
var day = dt.getDate();
var h = dt.getHours();
var m = dt.getMinutes();
var s = dt.getSeconds();
document.getElementById("showTime").innerHTML = y + "年" + mt + "月" + day + "-" + h + "时" + m + "分" + s + "秒";
t = setTimeout(time, 1000);
}
</script>
</ul>
</div>
<div class="box">
<div id="0a6f805201844143ac83e3238dd2d149" class="chart-container" style="position: absolute; width: 752px; height: 457px; top: 79.80000305175781px; left: 8px;"></div>
<script>
var chart_0a6f805201844143ac83e3238dd2d149 = echarts.init(
document.getElementById('0a6f805201844143ac83e3238dd2d149'), 'macarons', {renderer: 'canvas'});
var option_0a6f805201844143ac83e3238dd2d149 = {
"animation": true,
"animationThreshold": 2000,
"animationDuration": 1000,
"animationEasing": "cubicOut",
"animationDelay": 0,
"animationDurationUpdate": 300,
"animationEasingUpdate": "cubicOut",
"animationDelayUpdate": 0,
"series": [
{
"type": "pie",
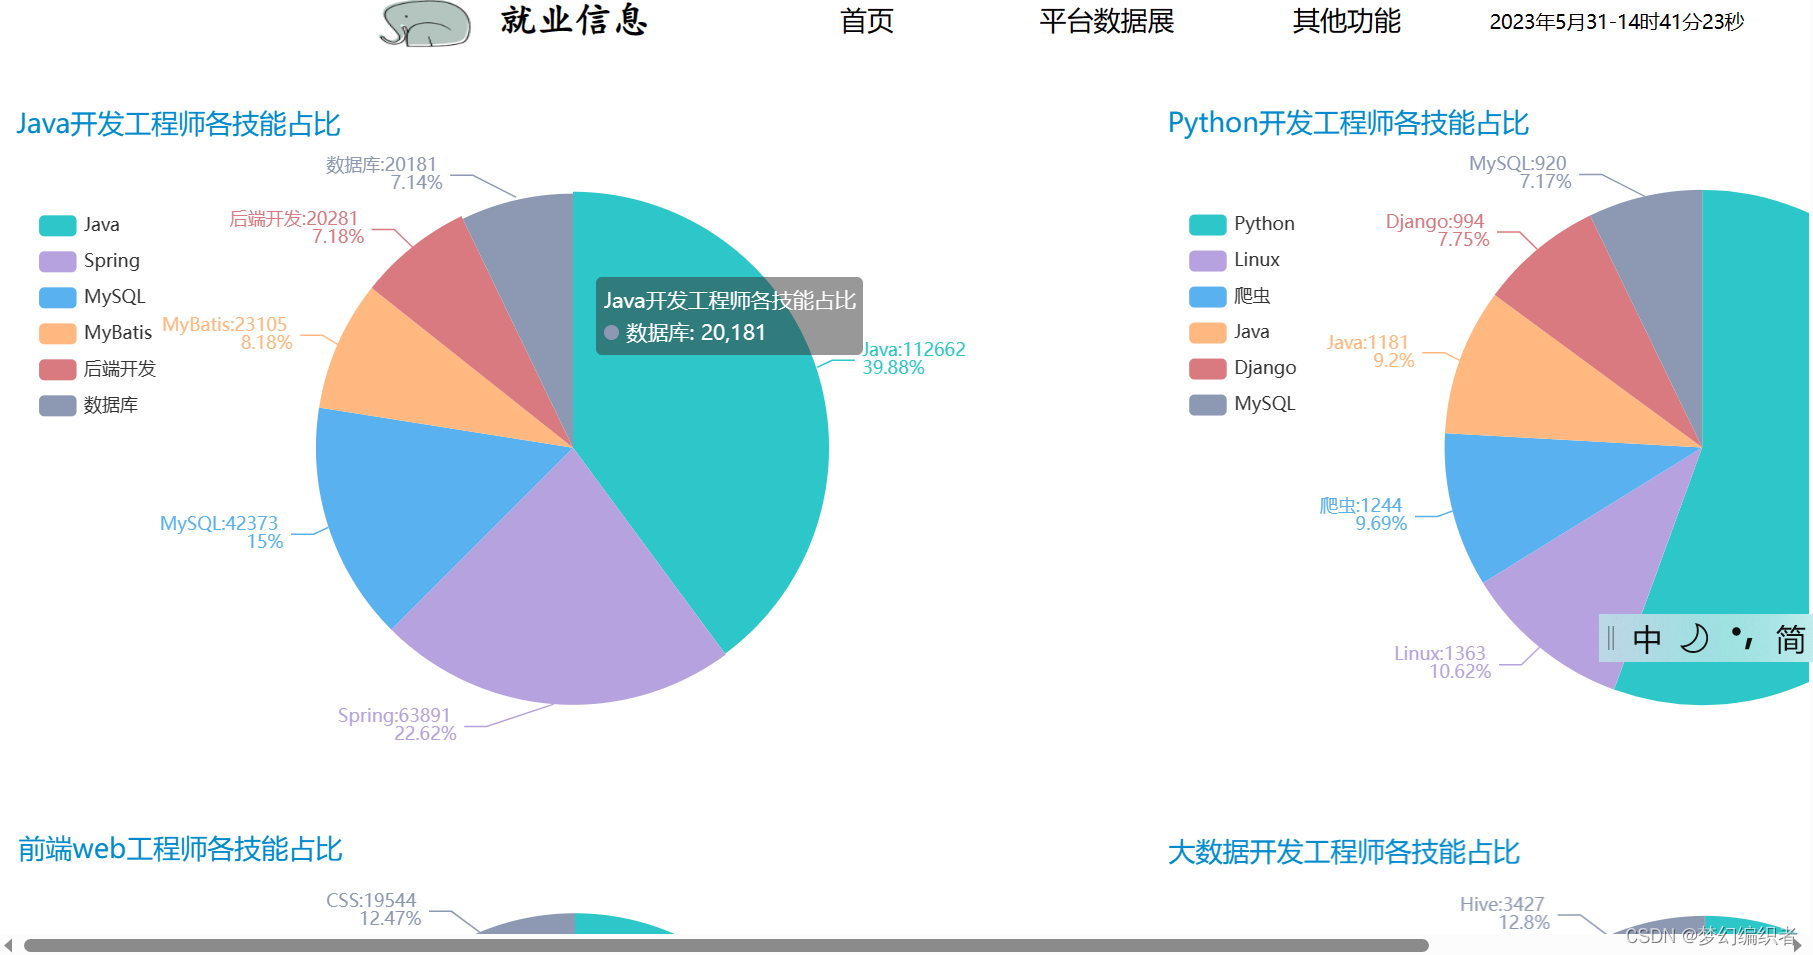
"name": "Java\u5f00\u53d1\u5de5\u7a0b\u5e08\u5404\u6280\u80fd\u5360\u6bd4",
"clockwise": true,
"data": [
{
"name": "Java",
"value": 112662
},
{
"name": "Spring",
"value": 63891
},
{
"name": "MySQL",
"value": 42373
},
{
"name": "MyBatis",
"value": 23105
},
{
"name": "\u540e\u7aef\u5f00\u53d1",
"value": 20281
},
{
"name": "\u6570\u636e\u5e93",
"value": 20181
}
],
"radius": [
"0%",
"75%"
],
"center": [
"50%",
"50%"
],
"label": {
"show": true,
"position": "top",
"margin": 8,
"formatter": "{b}:{c} \n{d}%"
},
"rippleEffect": {
"show": true,
"brushType": "stroke",
"scale": 2.5,
"period": 4
},
"position": "right"
}
],
"legend": [
{
"data": [
"Java",
"Spring",
"MySQL",
"MyBatis",
"\u540e\u7aef\u5f00\u53d1",
"\u6570\u636e\u5e93"
],
"selected": {},
"show": true,
"left": "2%",
"top": "15%",
"orient": "vertical",
"padding": 5,
"itemGap": 10,
"itemWidth": 25,
"itemHeight": 14
}
],
"tooltip": {
"show": true,
"trigger": "item",
"triggerOn": "mousemove|click",
"axisPointer": {
"type": "line"
},
"showContent": true,
"alwaysShowContent": false,
"showDelay": 0,
"hideDelay": 100,
"textStyle": {
"fontSize": 14
},
"borderWidth": 0,
"padding": 5
},
"title": [
{
"text": "Java\u5f00\u53d1\u5de5\u7a0b\u5e08\u5404\u6280\u80fd\u5360\u6bd4",
"padding": 5,
"itemGap": 10
}
]
};
chart_0a6f805201844143ac83e3238dd2d149.setOption(option_0a6f805201844143ac83e3238dd2d149);
</script>
<br/> <div id="42738d0013fb4c6c93c64937db653208" class="chart-container" style="position: absolute; width: 723px; height: 458px; top: 79.5999984741211px; left: 775px;"></div>
<script>
var chart_42738d0013fb4c6c93c64937db653208 = echarts.init(
document.getElementById('42738d0013fb4c6c93c64937db653208'), 'macarons', {renderer: 'canvas'});
var option_42738d0013fb4c6c93c64937db653208 = {
"animation": true,
"animationThreshold": 2000,
"animationDuration": 1000,
"animationEasing": "cubicOut",
"animationDelay": 0,
"animationDurationUpdate": 300,
"animationEasingUpdate": "cubicOut",
"animationDelayUpdate": 0,
"series": [
{
"type": "pie",
"name": "Python\u5f00\u53d1\u5de5\u7a0b\u5e08\u5404\u6280\u80fd\u5360\u6bd4",
"clockwise": true,
"data": [
{
"name": "Python",
"value": 7132
},
{
"name": "Linux",
"value": 1363
},
{
"name": "\u722c\u866b",
"value": 1244
},
{
"name": "Java",
"value": 1181
},
{
"name": "Django",
"value": 994
},
{
"name": "MySQL",
"value": 920
}
],
"radius": [
"0%",
"75%"
],
"center": [
"50%",
"50%"
],
"label": {
"show": true,
"position": "top",
"margin": 8,
"formatter": "{b}:{c} \n{d}%"
},
"rippleEffect": {
"show": true,
"brushType": "stroke",
"scale": 2.5,
"period": 4
},
"position": "right"
}
],
"legend": [
{
"data": [
"Python",
"Linux",
"\u722c\u866b",
"Java",
"Django",
"MySQL"
],
"selected": {},
"show": true,
"left": "2%",
"top": "15%",
"orient": "vertical",
"padding": 5,
"itemGap": 10,
"itemWidth": 25,
"itemHeight": 14
}
],
"tooltip": {
"show": true,
"trigger": "item",
"triggerOn": "mousemove|click",
"axisPointer": {
"type": "line"
},
"showContent": true,
"alwaysShowContent": false,
"showDelay": 0,
"hideDelay": 100,
"textStyle": {
"fontSize": 14
},
"borderWidth": 0,
"padding": 5
},
"title": [
{
"text": "Python\u5f00\u53d1\u5de5\u7a0b\u5e08\u5404\u6280\u80fd\u5360\u6bd4",
"padding": 5,
"itemGap": 10
}
]
};
chart_42738d0013fb4c6c93c64937db653208.setOption(option_42738d0013fb4c6c93c64937db653208);
</script>
<br/> <div id="ac982e0480fe48afb6922dd6c1221d18" class="chart-container" style="position: absolute; width: 752px; height: 444px; top: 563.4000244140625px; left: 9px;"></div>
<script>
var chart_ac982e0480fe48afb6922dd6c1221d18 = echarts.init(
document.getElementById('ac982e0480fe48afb6922dd6c1221d18'), 'macarons', {renderer: 'canvas'});
var option_ac982e0480fe48afb6922dd6c1221d18 = {
"animation": true,
"animationThreshold": 2000,
"animationDuration": 1000,
"animationEasing": "cubicOut",
"animationDelay": 0,
"animationDurationUpdate": 300,
"animationEasingUpdate": "cubicOut",
"animationDelayUpdate": 0,
"series": [
{
"type": "pie",
"name": "\u524d\u7aefweb\u5de5\u7a0b\u5e08\u5404\u6280\u80fd\u5360\u6bd4",
"clockwise": true,
"data": [
{
"name": "Web\u524d\u7aef",
"value": 34964
},
{
"name": "Vue",
"value": 34107
},
{
"name": "Javascript",
"value": 24562
},
{
"name": "HTML5",
"value": 22785
},
{
"name": "HTML",
"value": 20816
},
{
"name": "CSS",
"value": 19544
}
],
"radius": [
"0%",
"75%"
],
"center": [
"50%",
"50%"
],
"label": {
"show": true,
"position": "top",
"margin": 8,
"formatter": "{b}:{c} \n{d}%"
},
"rippleEffect": {
"show": true,
"brushType": "stroke",
"scale": 2.5,
"period": 4
},
"position": "right"
}
],
"legend": [
{
"data": [
"Web\u524d\u7aef",
"Vue",
"Javascript",
"HTML5",
"HTML",
"CSS"
],
"selected": {},
"show": true,
"left": "2%",
"top": "15%",
"orient": "vertical",
"padding": 5,
"itemGap": 10,
"itemWidth": 25,
"itemHeight": 14
}
],
"tooltip": {
"show": true,
"trigger": "item",
"triggerOn": "mousemove|click",
"axisPointer": {
"type": "line"
},
"showContent": true,
"alwaysShowContent": false,
"showDelay": 0,
"hideDelay": 100,
"textStyle": {
"fontSize": 14
},
"borderWidth": 0,
"padding": 5
},
"title": [
{
"text": "\u524d\u7aefweb\u5de5\u7a0b\u5e08\u5404\u6280\u80fd\u5360\u6bd4",
"padding": 5,
"itemGap": 10
}
]
};
chart_ac982e0480fe48afb6922dd6c1221d18.setOption(option_ac982e0480fe48afb6922dd6c1221d18);
</script>
<br/> <div id="d19508ed4fcd4a9095ac4f03ebe969e3" class="chart-container" style="position: absolute; width: 725px; height: 442px; top: 565.0625px; left: 776px;"></div>
<script>
var chart_d19508ed4fcd4a9095ac4f03ebe969e3 = echarts.init(
document.getElementById('d19508ed4fcd4a9095ac4f03ebe969e3'), 'macarons', {renderer: 'canvas'});
var option_d19508ed4fcd4a9095ac4f03ebe969e3 = {
"animation": true,
"animationThreshold": 2000,
"animationDuration": 1000,
"animationEasing": "cubicOut",
"animationDelay": 0,
"animationDurationUpdate": 300,
"animationEasingUpdate": "cubicOut",
"animationDelayUpdate": 0,
"series": [
{
"type": "pie",
"name": "\u5927\u6570\u636e\u5f00\u53d1\u5de5\u7a0b\u5e08\u5404\u6280\u80fd\u5360\u6bd4",
"clockwise": true,
"data": [
{
"name": "Hadoop",
"value": 7569
},
{
"name": "Spark",
"value": 4313
},
{
"name": "Python",
"value": 3903
},
{
"name": "\u6570\u636e\u4ed3\u5e93",
"value": 3837
},
{
"name": "\u5927\u6570\u636e\u5f00\u53d1",
"value": 3721
},
{
"name": "Hive",
"value": 3427
}
],
"radius": [
"0%",
"75%"
],
"center": [
"50%",
"50%"
],
"label": {
"show": true,
"position": "top",
"margin": 8,
"formatter": "{b}:{c} \n{d}%"
},
"rippleEffect": {
"show": true,
"brushType": "stroke",
"scale": 2.5,
"period": 4
},
"position": "right"
}
],
"legend": [
{
"data": [
"Hadoop",
"Spark",
"Python",
"\u6570\u636e\u4ed3\u5e93",
"\u5927\u6570\u636e\u5f00\u53d1",
"Hive"
],
"selected": {},
"show": true,
"left": "2%",
"top": "15%",
"orient": "vertical",
"padding": 5,
"itemGap": 10,
"itemWidth": 25,
"itemHeight": 14
}
],
"tooltip": {
"show": true,
"trigger": "item",
"triggerOn": "mousemove|click",
"axisPointer": {
"type": "line"
},
"showContent": true,
"alwaysShowContent": false,
"showDelay": 0,
"hideDelay": 100,
"textStyle": {
"fontSize": 14
},
"borderWidth": 0,
"padding": 5
},
"title": [
{
"text": "\u5927\u6570\u636e\u5f00\u53d1\u5de5\u7a0b\u5e08\u5404\u6280\u80fd\u5360\u6bd4",
"padding": 5,
"itemGap": 10
}
]
};
chart_d19508ed4fcd4a9095ac4f03ebe969e3.setOption(option_d19508ed4fcd4a9095ac4f03ebe969e3);
</script>
<br/> <div id="0f9a08e1882449e383401c822ea21d64" class="chart-container" style="position: absolute; width: 752px; height: 447px; top: 1031.862548828125px; left: 8px;"></div>
<script>
var chart_0f9a08e1882449e383401c822ea21d64 = echarts.init(
document.getElementById('0f9a08e1882449e383401c822ea21d64'), 'macarons', {renderer: 'canvas'});
var option_0f9a08e1882449e383401c822ea21d64 = {
"animation": true,
"animationThreshold": 2000,
"animationDuration": 1000,
"animationEasing": "cubicOut",
"animationDelay": 0,
"animationDurationUpdate": 300,
"animationEasingUpdate": "cubicOut",
"animationDelayUpdate": 0,
"series": [
{
"type": "pie",
"name": "\u6570\u636e\u5206\u6790\u5e08\u5404\u6280\u80fd\u5360\u6bd4",
"clockwise": true,
"data": [
{
"name": "\u6570\u636e\u5206\u6790",
"value": 14554
},
{
"name": "Python",
"value": 6807
},
{
"name": "SQL",
"value": 6367
},
{
"name": "\u6570\u636e\u6316\u6398",
"value": 4178
},
{
"name": "\u6570\u636e\u5efa\u6a21",
"value": 3036
},
{
"name": "\u5927\u6570\u636e\u5206\u6790",
"value": 2444
}
],
"radius": [
"0%",
"75%"
],
"center": [
"50%",
"50%"
],
"label": {
"show": true,
"position": "top",
"margin": 8,
"formatter": "{b}:{c} \n{d}%"
},
"rippleEffect": {
"show": true,
"brushType": "stroke",
"scale": 2.5,
"period": 4
},
"position": "right"
}
],
"legend": [
{
"data": [
"\u6570\u636e\u5206\u6790",
"Python",
"SQL",
"\u6570\u636e\u6316\u6398",
"\u6570\u636e\u5efa\u6a21",
"\u5927\u6570\u636e\u5206\u6790"
],
"selected": {},
"show": true,
"left": "2%",
"top": "15%",
"orient": "vertical",
"padding": 5,
"itemGap": 10,
"itemWidth": 25,
"itemHeight": 14
}
],
"tooltip": {
"show": true,
"trigger": "item",
"triggerOn": "mousemove|click",
"axisPointer": {
"type": "line"
},
"showContent": true,
"alwaysShowContent": false,
"showDelay": 0,
"hideDelay": 100,
"textStyle": {
"fontSize": 14
},
"borderWidth": 0,
"padding": 5
},
"title": [
{
"text": "\u6570\u636e\u5206\u6790\u5e08\u5404\u6280\u80fd\u5360\u6bd4",
"padding": 5,
"itemGap": 10
}
]
};
chart_0f9a08e1882449e383401c822ea21d64.setOption(option_0f9a08e1882449e383401c822ea21d64);
</script>
<br/> <div id="ac71e33ea6714fed8af256745df2f75c" class="chart-container" style="position: absolute; width: 728px; height: 448px; top: 1031.2625732421875px; left: 778px;"></div>
<script>
var chart_ac71e33ea6714fed8af256745df2f75c = echarts.init(
document.getElementById('ac71e33ea6714fed8af256745df2f75c'), 'macarons', {renderer: 'canvas'});
var option_ac71e33ea6714fed8af256745df2f75c = {
"animation": true,
"animationThreshold": 2000,
"animationDuration": 1000,
"animationEasing": "cubicOut",
"animationDelay": 0,
"animationDurationUpdate": 300,
"animationEasingUpdate": "cubicOut",
"animationDelayUpdate": 0,
"series": [
{
"type": "pie",
"name": "\u7b97\u6cd5\u5de5\u7a0b\u5e08\u5404\u6280\u80fd\u5360\u6bd4",
"clockwise": true,
"data": [
{
"name": "C++",
"value": 7153
},
{
"name": "\u6df1\u5ea6\u5b66\u4e60",
"value": 5715
},
{
"name": "Python",
"value": 5645
},
{
"name": "\u56fe\u50cf\u5904\u7406",
"value": 5298
},
{
"name": "\u673a\u5668\u5b66\u4e60",
"value": 4455
},
{
"name": "\u56fe\u50cf\u7b97\u6cd5",
"value": 3637
}
],
"radius": [
"0%",
"75%"
],
"center": [
"50%",
"50%"
],
"label": {
"show": true,
"position": "top",
"margin": 8,
"formatter": "{b}:{c} \n{d}%"
},
"rippleEffect": {
"show": true,
"brushType": "stroke",
"scale": 2.5,
"period": 4
},
"position": "right"
}
],
"legend": [
{
"data": [
"C++",
"\u6df1\u5ea6\u5b66\u4e60",
"Python",
"\u56fe\u50cf\u5904\u7406",
"\u673a\u5668\u5b66\u4e60",
"\u56fe\u50cf\u7b97\u6cd5"
],
"selected": {},
"show": true,
"left": "2%",
"top": "15%",
"orient": "vertical",
"padding": 5,
"itemGap": 10,
"itemWidth": 25,
"itemHeight": 14
}
],
"tooltip": {
"show": true,
"trigger": "item",
"triggerOn": "mousemove|click",
"axisPointer": {
"type": "line"
},
"showContent": true,
"alwaysShowContent": false,
"showDelay": 0,
"hideDelay": 100,
"textStyle": {
"fontSize": 14
},
"borderWidth": 0,
"padding": 5
},
"title": [
{
"text": "\u7b97\u6cd5\u5de5\u7a0b\u5e08\u5404\u6280\u80fd\u5360\u6bd4",
"padding": 5,
"itemGap": 10
}
]
};
chart_ac71e33ea6714fed8af256745df2f75c.setOption(option_ac71e33ea6714fed8af256745df2f75c);
</script>
<br/> <div id="d344a0a689fa4cc980d37f13af96ffeb" class="chart-container" style="position: absolute; width: 731px; height: 459px; top: 1508.6624755859375px; left: 780px;"></div>
<script>
var chart_d344a0a689fa4cc980d37f13af96ffeb = echarts.init(
document.getElementById('d344a0a689fa4cc980d37f13af96ffeb'), 'macarons', {renderer: 'canvas'});
var option_d344a0a689fa4cc980d37f13af96ffeb = {
"animation": true,
"animationThreshold": 2000,
"animationDuration": 1000,
"animationEasing": "cubicOut",
"animationDelay": 0,
"animationDurationUpdate": 300,
"animationEasingUpdate": "cubicOut",
"animationDelayUpdate": 0,
"series": [
{
"type": "pie",
"name": "\u5176\u4ed6\u540e\u7aef\u5f00\u53d1\u5de5\u7a0b\u5e08\u5404\u6280\u80fd\u5360\u6bd4",
"clockwise": true,
"data": [
{
"name": "Python",
"value": 1161
},
{
"name": "Java",
"value": 943
},
{
"name": "\u540e\u7aef\u5f00\u53d1",
"value": 702
},
{
"name": "C++",
"value": 659
},
{
"name": "MySQL",
"value": 497
},
{
"name": "Linux",
"value": 389
}
],
"radius": [
"0%",
"75%"
],
"center": [
"50%",
"50%"
],
"label": {
"show": true,
"position": "top",
"margin": 8,
"formatter": "{b}:{c} \n{d}%"
},
"rippleEffect": {
"show": true,
"brushType": "stroke",
"scale": 2.5,
"period": 4
},
"position": "right"
}
],
"legend": [
{
"data": [
"Python",
"Java",
"\u540e\u7aef\u5f00\u53d1",
"C++",
"MySQL",
"Linux"
],
"selected": {},
"show": true,
"left": "2%",
"top": "15%",
"orient": "vertical",
"padding": 5,
"itemGap": 10,
"itemWidth": 25,
"itemHeight": 14
}
],
"tooltip": {
"show": true,
"trigger": "item",
"triggerOn": "mousemove|click",
"axisPointer": {
"type": "line"
},
"showContent": true,
"alwaysShowContent": false,
"showDelay": 0,
"hideDelay": 100,
"textStyle": {
"fontSize": 14
},
"borderWidth": 0,
"padding": 5
},
"title": [
{
"text": "\u5176\u4ed6\u540e\u7aef\u5f00\u53d1\u5de5\u7a0b\u5e08\u5404\u6280\u80fd\u5360\u6bd4",
"padding": 5,
"itemGap": 10
}
]
};
chart_d344a0a689fa4cc980d37f13af96ffeb.setOption(option_d344a0a689fa4cc980d37f13af96ffeb);
</script>
<br/> <div id="c6c46d14d8b440d49758c9a21fdc4551" class="chart-container" style="position: absolute; width: 756px; height: 460px; top: 1509.0625px; left: 4px;"></div>
<script>
var chart_c6c46d14d8b440d49758c9a21fdc4551 = echarts.init(
document.getElementById('c6c46d14d8b440d49758c9a21fdc4551'), 'macarons', {renderer: 'canvas'});
var option_c6c46d14d8b440d49758c9a21fdc4551 = {
"animation": true,
"animationThreshold": 2000,
"animationDuration": 1000,
"animationEasing": "cubicOut",
"animationDelay": 0,
"animationDurationUpdate": 300,
"animationEasingUpdate": "cubicOut",
"animationDelayUpdate": 0,
"series": [
{
"type": "pie",
"name": "\u6570\u636e\u5e93\u5f00\u53d1\u5de5\u7a0b\u5e08\u5404\u6280\u80fd\u5360\u6bd4",
"clockwise": true,
"data": [
{
"name": "\u6570\u636e\u5e93\u5f00\u53d1",
"value": 366
},
{
"name": "\u6570\u636e\u5e93",
"value": 365
},
{
"name": "MySQL",
"value": 328
},
{
"name": "\u6570\u636e\u4ed3\u5e93",
"value": 254
},
{
"name": "Python",
"value": 252
},
{
"name": "Oracle",
"value": 250
}
],
"radius": [
"0%",
"75%"
],
"center": [
"50%",
"50%"
],
"label": {
"show": true,
"position": "top",
"margin": 8,
"formatter": "{b}:{c} \n{d}%"
},
"rippleEffect": {
"show": true,
"brushType": "stroke",
"scale": 2.5,
"period": 4
},
"position": "right"
}
],
"legend": [
{
"data": [
"\u6570\u636e\u5e93\u5f00\u53d1",
"\u6570\u636e\u5e93",
"MySQL",
"\u6570\u636e\u4ed3\u5e93",
"Python",
"Oracle"
],
"selected": {},
"show": true,
"left": "2%",
"top": "15%",
"orient": "vertical",
"padding": 5,
"itemGap": 10,
"itemWidth": 25,
"itemHeight": 14
}
],
"tooltip": {
"show": true,
"trigger": "item",
"triggerOn": "mousemove|click",
"axisPointer": {
"type": "line"
},
"showContent": true,
"alwaysShowContent": false,
"showDelay": 0,
"hideDelay": 100,
"textStyle": {
"fontSize": 14
},
"borderWidth": 0,
"padding": 5
},
"title": [
{
"text": "\u6570\u636e\u5e93\u5f00\u53d1\u5de5\u7a0b\u5e08\u5404\u6280\u80fd\u5360\u6bd4",
"padding": 5,
"itemGap": 10
}
]
};
chart_c6c46d14d8b440d49758c9a21fdc4551.setOption(option_c6c46d14d8b440d49758c9a21fdc4551);
</script>
<br/> </div>
<script>
$('#0a6f805201844143ac83e3238dd2d149').css('border-style', 'dashed').css('border-width', '0px');$("#0a6f805201844143ac83e3238dd2d149>div:nth-child(1)").width("100%").height("100%");
new ResizeSensor(jQuery('#0a6f805201844143ac83e3238dd2d149'), function() { chart_0a6f805201844143ac83e3238dd2d149.resize()});
$('#42738d0013fb4c6c93c64937db653208').css('border-style', 'dashed').css('border-width', '0px');$("#42738d0013fb4c6c93c64937db653208>div:nth-child(1)").width("100%").height("100%");
new ResizeSensor(jQuery('#42738d0013fb4c6c93c64937db653208'), function() { chart_42738d0013fb4c6c93c64937db653208.resize()});
$('#ac982e0480fe48afb6922dd6c1221d18').css('border-style', 'dashed').css('border-width', '0px');$("#ac982e0480fe48afb6922dd6c1221d18>div:nth-child(1)").width("100%").height("100%");
new ResizeSensor(jQuery('#ac982e0480fe48afb6922dd6c1221d18'), function() { chart_ac982e0480fe48afb6922dd6c1221d18.resize()});
$('#d19508ed4fcd4a9095ac4f03ebe969e3').css('border-style', 'dashed').css('border-width', '0px');$("#d19508ed4fcd4a9095ac4f03ebe969e3>div:nth-child(1)").width("100%").height("100%");
new ResizeSensor(jQuery('#d19508ed4fcd4a9095ac4f03ebe969e3'), function() { chart_d19508ed4fcd4a9095ac4f03ebe969e3.resize()});
$('#0f9a08e1882449e383401c822ea21d64').css('border-style', 'dashed').css('border-width', '0px');$("#0f9a08e1882449e383401c822ea21d64>div:nth-child(1)").width("100%").height("100%");
new ResizeSensor(jQuery('#0f9a08e1882449e383401c822ea21d64'), function() { chart_0f9a08e1882449e383401c822ea21d64.resize()});
$('#ac71e33ea6714fed8af256745df2f75c').css('border-style', 'dashed').css('border-width', '0px');$("#ac71e33ea6714fed8af256745df2f75c>div:nth-child(1)").width("100%").height("100%");
new ResizeSensor(jQuery('#ac71e33ea6714fed8af256745df2f75c'), function() { chart_ac71e33ea6714fed8af256745df2f75c.resize()});
$('#d344a0a689fa4cc980d37f13af96ffeb').css('border-style', 'dashed').css('border-width', '0px');$("#d344a0a689fa4cc980d37f13af96ffeb>div:nth-child(1)").width("100%").height("100%");
new ResizeSensor(jQuery('#d344a0a689fa4cc980d37f13af96ffeb'), function() { chart_d344a0a689fa4cc980d37f13af96ffeb.resize()});
$('#c6c46d14d8b440d49758c9a21fdc4551').css('border-style', 'dashed').css('border-width', '0px');$("#c6c46d14d8b440d49758c9a21fdc4551>div:nth-child(1)").width("100%").height("100%");
new ResizeSensor(jQuery('#c6c46d14d8b440d49758c9a21fdc4551'), function() { chart_c6c46d14d8b440d49758c9a21fdc4551.resize()});
var charts_id = ['0a6f805201844143ac83e3238dd2d149','42738d0013fb4c6c93c64937db653208','ac982e0480fe48afb6922dd6c1221d18','d19508ed4fcd4a9095ac4f03ebe969e3','0f9a08e1882449e383401c822ea21d64','ac71e33ea6714fed8af256745df2f75c','d344a0a689fa4cc980d37f13af96ffeb','c6c46d14d8b440d49758c9a21fdc4551'];
function downloadCfg () {
const fileName = 'chart_config.json'
let downLink = document.createElement('a')
downLink.download = fileName
let result = []
for(let i=0; i<charts_id.length; i++) {
chart = $('#'+charts_id[i])
result.push({
cid: charts_id[i],
width: chart.css("width"),
height: chart.css("height"),
top: chart.offset().top + "px",
left: chart.offset().left + "px"
})
}
let blob = new Blob([JSON.stringify(result)])
downLink.href = URL.createObjectURL(blob)
document.body.appendChild(downLink)
downLink.click()
document.body.removeChild(downLink)
}
</script>
</body>
</html>
14.templates/predict_xinzi.html
<!DOCTYPE html>
<html lang="en">
<head>
<meta charset="UTF-8">
<title>岗位薪资预测</title>
<link rel="stylesheet" type="text/css" href="../static/css/predict.css">
<script src="../static/js/jquery.js"></script>
<script src="../static/js/vector.js"></script>
<script type="text/javascript"></script>
<script type="text/javascript">
$(function(){
Victor("container", "output"); //登陆背景函数
});
</script>
<style>
ul {
list-style: none;
}
a {
text-decoration: none;
}
/*一级菜单样式, 头部导航栏以及登录注册按钮*/
.toubu {
z-index: 1000;
min-width: 1100px;
width: 100%;
height: 50px;
margin: 0px auto;
background-color: white;
font-size: 18px;
font-family: 微软雅黑;
position: fixed;
}
.toubu ul{
height: 50px;
}
.toubu ul li {
left: 500px;
float: left;
/*包含块*/
position:relative;
}
.toubu ul li a {
display: block;
font-size: 18px;
width: 160px;
height: 50px;
line-height: 46px;
text-align: center;
color: black;
}
.toubu ul li a:hover {
color: black;
background-color: aqua;
}
/*二级菜单样式*/
.toubu ul li ul {
position:absolute;
top:50px;
left:-500px;
display:none;
}
.toubu ul li ul li {
float:none;
}
.toubu ul li ul li a{
background-color: white;
font-size: 16px;
color: black;
/* border-top:1px solid #ccc; */
}
/*一级菜单悬停时二级菜单可见*/
.toubu ul li:hover ul {
display:block;
}
.img_1{ /*logo图片设置*/
position: absolute;
float: left;
top: 4px;
left: 250px;
}
.logo_1{
position: absolute;
float: left;
top: 9px;
font-family: "楷体";
font-size: 25px;
font-weight: bold;
left: 335px;
}
.containerT1{
width:800px;
height:1000px;
text-align:center;
position:absolute;
top: 200px;
left:38%;
margin:-150px 0 0 -200px;
border-radius:3px;
background-color: azure;
}
</style>
</head>
<body >
<style>.box { z-index: 999; }</style>
<div id="container">
<div id="output">
<div class="toubu">
<ul>
<a href=""><img src="../static/images/J.png" alt="" class="img_1" width="70" height="40"/></a>
<span class="logo_1">就业信息</span>
<li><a href="">首页</a>
</li>
<li><a href="">平台数据展</a>
<ul>
<li><a href="/test_pic">大数据展示屏</a></li>
<li><a href="/job_demand">各岗位技能分析</a></li>
<li><a href="/xinzi_bar">薪资职位分析</a></li>
<li><a href="/pie_bar_test">各地区岗位分析</a></li>
</ul>
</li>
<li><a href="">其他功能</a>
<ul>
<li><a href="/">岗位薪资预测</a></li>
</ul>
</li>
<li class="weather"><span id="showTime"></span></li>
<style>
.weather{
padding: 15px;
}
</style>
<script>
var t = null;
t = setTimeout(time, 1000);
function time() {
clearTimeout(t);
dt = new Date();
var y = dt.getFullYear();
var mt = dt.getMonth() + 1;
var day = dt.getDate();
var h = dt.getHours();
var m = dt.getMinutes();
var s = dt.getSeconds();
document.getElementById("showTime").innerHTML = y + "年" + mt + "月" + day + "-" + h + "时" + m + "分" + s + "秒";
t = setTimeout(time, 1000);
}
</script>
</ul>
</div>
<div class="containerT1">
<div class="t1">
<p style="font-size: 16px; padding: 10px; float: left;">其他功能 > 岗位薪资预测</p>
<br><br><br>
<hr style="border: 1px dashed gray;"/>
<br>
<p style="font-size: 22px;font-family: 宋体;font-weight: 900;color: #000d4a">岗位薪资预测</p>
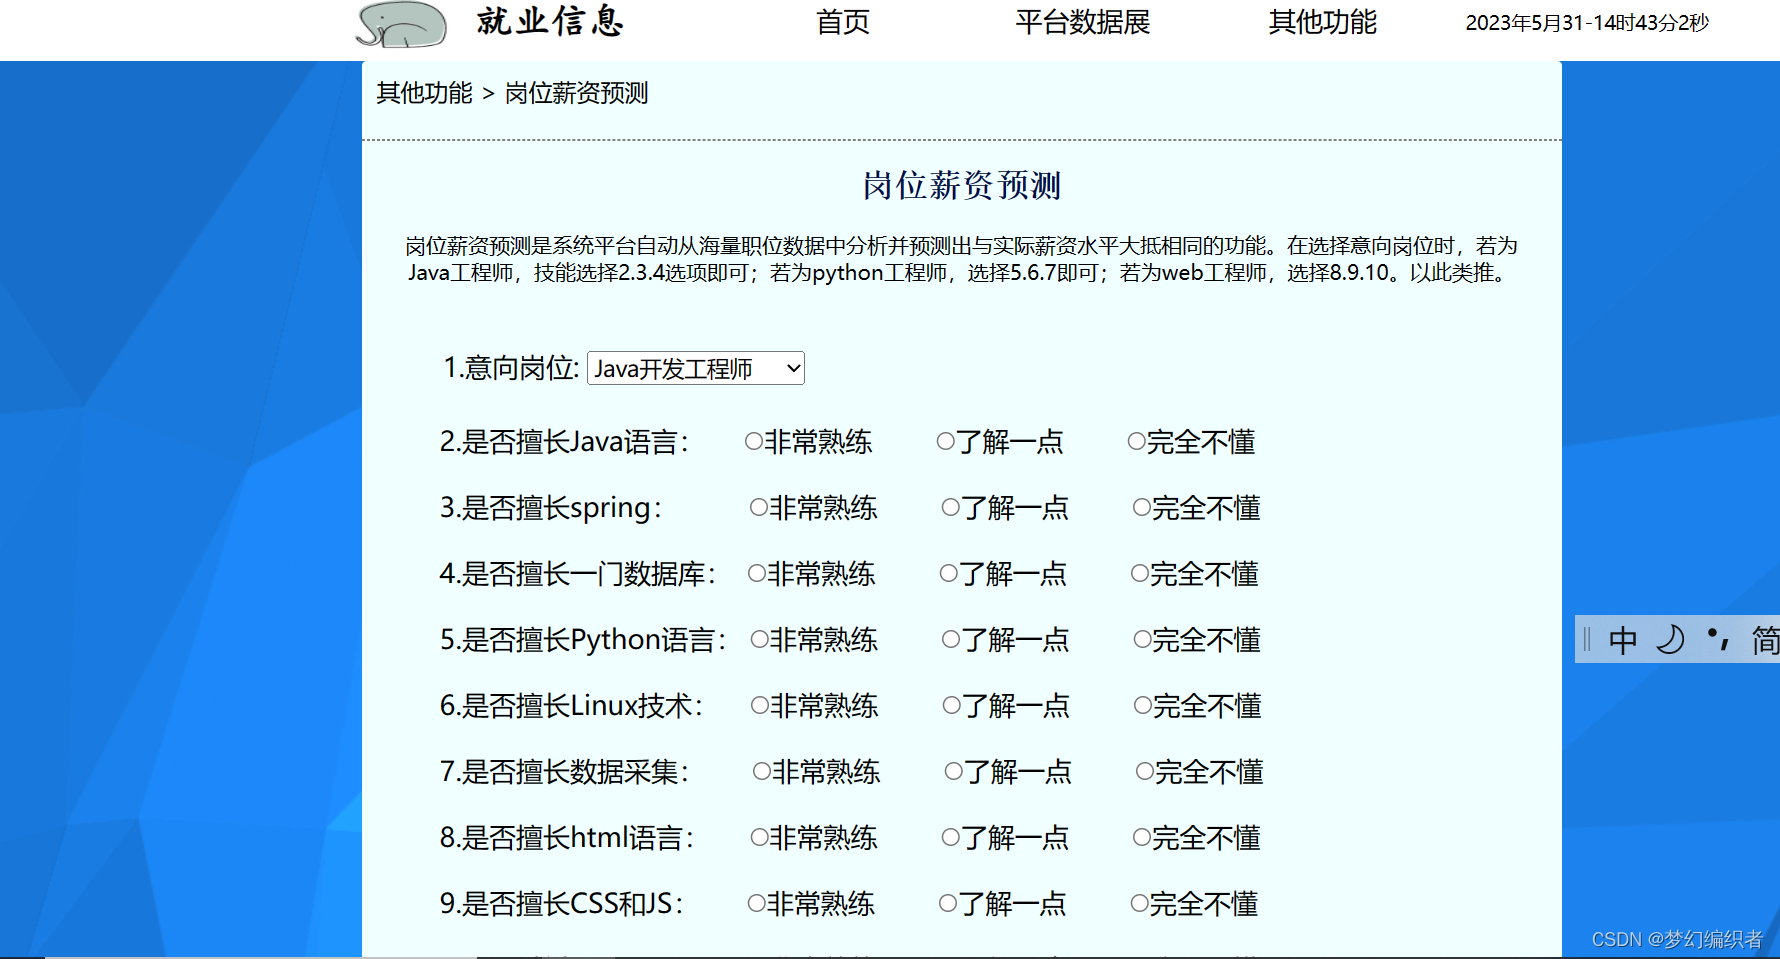
<p style="padding: 17px;font-size: 14px">岗位薪资预测是系统平台自动从海量职位数据中分析并预测出与实际薪资水平大抵相同的功能。在选择意向岗位时,若为Java工程师,技能选择2.3.4选项即可;若为python工程师,选择5.6.7即可;若为web工程师,选择8.9.10。以此类推。</p>
<form method="POST" action="/xinzi_predict">
<p style="font-size: 18px; padding: 5px;float: left; width: 300px">1.意向岗位:
<select name="job_name" style="font-size: 15px">
<option>Java开发工程师</option>
<option>Python开发工程师</option>
<option>web前端开发师</option>
<option>算法工程师</option>
</select></p>
<p style="font-size: 18px; padding: 20px 0 0 32px;float: left">2.是否擅长Java语言:
<input type="radio" name="java1" value="1">非常熟练
<input type="radio" name="java1" value="0">了解一点
<input type="radio" name="java1" value="0">完全不懂</p>
<p style="font-size: 18px; padding: 20px 0 0 32px;float: left">3.是否擅长spring:
<input type="radio" name="spring1" value="1">非常熟练
<input type="radio" name="spring1" value="0">了解一点
<input type="radio" name="spring1" value="0">完全不懂</p>
<p style="font-size: 18px; padding: 20px 0 0 32px;float: left">4.是否擅长一门数据库:
<input type="radio" name="sql1" value="1">非常熟练
<input type="radio" name="sql1" value="0">了解一点
<input type="radio" name="sql1" value="0">完全不懂</p>
<p style="font-size: 18px; padding: 20px 0 0 32px;float: left">5.是否擅长Python语言:
<input type="radio" name="python1" value="1">非常熟练
<input type="radio" name="python1" value="0">了解一点
<input type="radio" name="python1" value="0">完全不懂</p>
<p style="font-size: 18px; padding: 20px 0 0 32px;float: left">6.是否擅长Linux技术:
<input type="radio" name="linux1" value="1">非常熟练
<input type="radio" name="linux1" value="0">了解一点
<input type="radio" name="linux1" value="0">完全不懂</p>
<p style="font-size: 18px; padding: 20px 0 0 32px;float: left">7.是否擅长数据采集:
<input type="radio" name="spider1" value="1">非常熟练
<input type="radio" name="spider1" value="0">了解一点
<input type="radio" name="spider1" value="0">完全不懂</p>
<p style="font-size: 18px; padding: 20px 0 0 32px;float: left">8.是否擅长html语言:
<input type="radio" name="html1" value="1">非常熟练
<input type="radio" name="html1" value="0">了解一点
<input type="radio" name="html1" value="0">完全不懂</p>
<p style="font-size: 18px; padding: 20px 0 0 32px;float: left">9.是否擅长CSS和JS:
<input type="radio" name="cssjs1" value="1">非常熟练
<input type="radio" name="cssjs1" value="0">了解一点
<input type="radio" name="cssjs1" value="0">完全不懂</p>
<p style="font-size: 18px; padding: 20px 0 0 32px;float: left">10.是否擅长Vue:
<input type="radio" name="vue1" value="1">非常熟练
<input type="radio" name="vue1" value="0">了解一点
<input type="radio" name="vue1" value="0">完全不懂</p>
<p style="font-size: 18px; padding: 20px 0 0 32px;float: left">11.是否擅长机器学习:
<input type="radio" name="jiqi1" value="1">非常熟练
<input type="radio" name="jiqi1" value="0">了解一点
<input type="radio" name="jiqi1" value="0">完全不懂</p>
<p style="font-size: 18px; padding: 20px 0 0 32px;float: left">12.是否擅长图像处理:
<input type="radio" name="tuxiang1" value="1">非常熟练
<input type="radio" name="tuxiang1" value="0">了解一点
<input type="radio" name="tuxiang1" value="0">完全不懂</p>
<p style="font-size: 18px; padding: 20px 0 0 32px;float: left">13.是否擅长C++:
<input type="radio" name="C1" value="1">非常熟练
<input type="radio" name="C1" value="0">了解一点
<input type="radio" name="C1" value="0">完全不懂</p>
<p style="font-size: 18px; padding: 20px 0 0 32px;float: left">14.最期望去的城市:
<input type="radio" name="city" value="0,1,0,0,0,0,0">北京
<input type="radio" name="city" value="1,0,0,0,0,0,0">上海
<input type="radio" name="city" value="0,0,0,1,0,0,0">广州
<input type="radio" name="city" value="0,0,0,0,0,0,1">深圳
<input type="radio" name="city" value="0,0,0,0,0,1,0">济南
<input type="radio" name="city" value="0,0,0,0,1,0,0">武汉
<input type="radio" name="city" value="0,0,1,0,0,0,0">天津</p>
<p style="font-size: 18px; padding: 20px 0 0 32px;float: left">15.当前最高学历:
<input type="radio" name="demand" value="0,0,0,1,0">硕士
<input type="radio" name="demand" value="0,0,1,0,0">本科
<input type="radio" name="demand" value="0,1,0,0,0">大专
<input type="radio" name="demand" value="1,0,0,0,0">中专/中技
<input type="radio" name="demand" value="0,0,0,0,1">高中</p>
<p style="font-size: 18px; padding: 20px 2px 0 20px;float: left">16.最期望的公司规模:
<input type="radio" name="guimo" value="0,0,0,0,1,0,0">20人以下
<input type="radio" name="guimo" value="0,0,0,1,0,0,0">20-99人
<input type="radio" name="guimo" value="1,0,0,0,0,0,0">100-299人
<input type="radio" name="guimo" value="0,0,0,0,0,1,0">300-499人
<input type="radio" name="guimo" value="0,0,0,0,0,0,1">500-999人
<input type="radio" name="guimo" value="0,1,0,0,0,0,0">1000-9999人
<input type="radio" name="guimo" value="0,0,1,0,0,0,0">10000人以上</p>
<input type="submit" value="点击体验" style="color: black; font-size: 18px;background-color: deepskyblue; width: 100px;height: 34px;border: none;float: left;margin-left: 350px;
margin-top: 35px;"/>
</form>
{% if message %}
<script>
alert('{{ message }}');
</script>
{% endif %}
</div>
</div>
</div>
</div>
</body>
</html>15.templates/test.html
<!DOCTYPE html>
<html>
	<head>
		<meta charset="utf-8">

		<title>test</title>
		<link rel="stylesheet" type="text/css" href="../static/css/zhuce.css">
		<script src="../static/js/jquery.js"></script>
		<script src="../static/js/vector.js"></script>
		<script type="text/javascript" src="../static/js/echarts.min.js"></script>


<style>
		ul {
				list-style: none;
			}
			a {
				text-decoration: none;
			}
			/*一级菜单样式, 头部导航栏以及登录注册按钮*/
			.toubu {
				position: fixed;
				min-width: 1100px;
				width: 100%;
				height: 50px;
				margin: 0px auto;
				background-color: white;
				font-size: 18px;
				font-family: 微软雅黑;
				position: fixed;
				z-index: 1000;
			}
			.toubu ul{
				height: 50px;
			}
		   .toubu ul li {
			   left: 500px;
		        float: left;
		        /*包含块*/
		        position:relative;
		    }
		    .toubu ul li a {
				display: block;
				font-size: 18px;
				width: 160px;
				height: 50px;
				line-height: 46px;
				text-align: center;
				color: black;
		        }

			.toubu ul li a:hover {
				color: black;
			   background-color: aqua;
			}
		/*二级菜单样式*/
		        .toubu ul li ul {
		        position:absolute;
		        top:50px;
		        left:-500px;
		        display:none;

		        }
				.toubu ul li ul li {
				float:none;
				}
				.toubu ul li ul li a{
				background-color: white;
				font-size: 16px;
				color: black;
				/* border-top:1px solid #ccc; */
				}
		            /*一级菜单悬停时二级菜单可见*/
		        .toubu ul li:hover ul {
		        display:block;
		        }
			.img_1{   /*logo图片设置*/
				position: absolute;
				float: left;
				top: 4px;
				left: 250px;
			}
			.logo_1{
				position: absolute;
				float: left;
				top: 9px;
				font-family: "楷体";
				font-size: 25px;
				font-weight: bold;

				left: 335px;
			}


	   .body{
		   top: 60px;
		   width: 100%;
		   height: 1000px;
		   position: absolute;
           background-color: #c5ccff;

	   }
	   .lbody{
	   	width: 650px;
	   	height: 550px;
	   	position: absolute;
	   	left: 50px;
	   z-index: 999;
	   }

	   .rbody{
		z-index: 999;
	   	width: 700px;
	   	height: 500px;
	   	position: absolute;
	   	left: 800px;


	   }


    </style>


	</head>
	<body>
		<div class="toubu">
			<ul>
				<a href=""><img src="../static/images/J.png" alt="" class="img_1" width="70" height="40"/></a>
				<span class="logo_1">就业信息</span>
			    <li><a href="">首页</a>

		        </li>
		        <li><a href="">平台数据展</a>
		            <ul>
		                <li><a href="/test_pic">大数据展示屏</a></li>
		                <li><a href="/job_demand">各岗位技能分析</a></li>
		                <li><a href="/xinzi_bar">薪资职位分析</a></li>
						<li><a href="/pie_bar_test">各地区岗位分析</a></li>
		            </ul>
		        </li>
		        <li><a href="">其他功能</a>
                    <ul>
                        <li><a href="/xinzi_predict">岗位薪资预测</a></li>
                    </ul>
                </li>

                <li class="weather"><span id="showTime"></span></li>
                <style>
                    .weather{
                        padding: 15px;
                    }
                </style>
        <script>
            var t = null;
            t = setTimeout(time, 1000);
            function time() {
                clearTimeout(t);
                dt = new Date();
                var y = dt.getFullYear();
                var mt = dt.getMonth() + 1;
                var day = dt.getDate();
                var h = dt.getHours();
                var m = dt.getMinutes();
                var s = dt.getSeconds();
                document.getElementById("showTime").innerHTML = y + "年" + mt + "月" + day + "-" + h + "时" + m + "分" + s + "秒";
                t = setTimeout(time, 1000);
            }
        </script>

			</ul>
		</div>

        <script>
            var pie_data = {
                pie_data_index: {{ pie_data_index|safe }},
                data :{{ data|safe }}
            }
            var bar_data = {
                bardata :{{ pie_data|safe }}
            }
        </script>
		<div class="body">
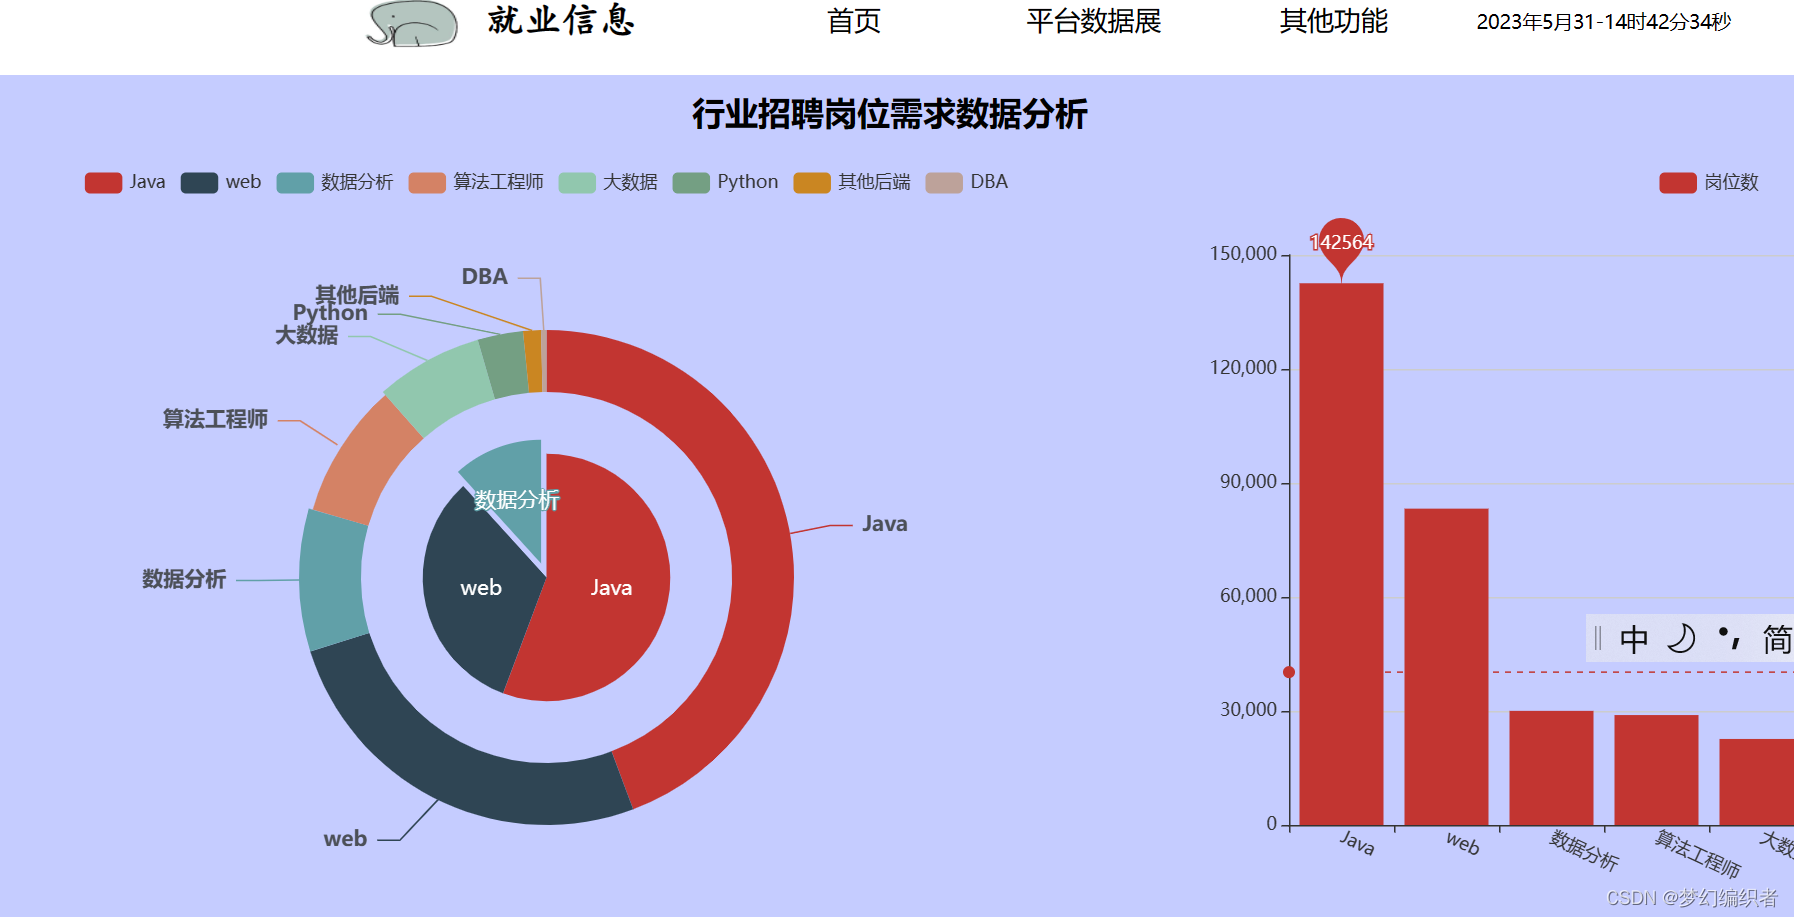
            <div style="width: 100%; height: 50px; margin-top: 10px"><h1 align="center" style="font-size:22px; font-family: '微软雅黑', 'Microsoft Yahei'">行业招聘岗位需求数据分析</h1></div>
			<div class="lbody" id="fb1">
			</div>

			<div class="rbody" id="fb2">
			</div>
		</div>

		<script type="text/javascript">
			$(function (){
				echarts_1();
				echarts_2();

			function echarts_1(){
				var myChart = echarts.init(document.getElementById('fb1'));
		var	option = {
    tooltip: {
        trigger: 'item',
        formatter: '{a} <br/>{b}: {c} ({d}%)'
    },
    legend: {
        data: pie_data.pie_data_index,
        //data:['直达', '营销广告', '搜索引擎', '邮件营销', '联盟广告', '视频广告', '百度', '谷歌', '必应', '其他'],
    },
    series: [
        {
            name: '访问来源',
            type: 'pie',
            selectedMode: 'single',
            radius: [0, '30%'],
            label: {
                position: 'inner',
                fontSize: 14,
            },
            labelLine: {
                show: false
            },
            data: [
                {value: 142569, name: 'Java'},
                {value: 83251, name: 'web'},
                {value: 30037, name: '数据分析', selected: true}
            ]
        },
        {
            name: '访问来源',
            type: 'pie',
            radius: ['45%', '60%'],
            labelLine: {
                length: 30,
            },
            label: {
                formatter: ' {b|{b}} ',
                rich: {
                    a: {
                        color: '#6E7079',
                        lineHeight: 22,
                        align: 'center'
                    },
                    hr: {
                        borderColor: '#8C8D8E',
                        width: '100%',
                        borderWidth: 1,
                        height: 0
                    },
                    b: {
                        color: '#4C5058',
                        fontSize: 14,
                        fontWeight: 'bold',
                        lineHeight: 33
                    },
                    per: {
                        color: '#fff',
                        backgroundColor: '#4C5058',
                        padding: [3, 4],
                        borderRadius: 4
                    }
                }
            },
            data:  pie_data.data,
        }
    ]
};
	// 使用刚指定的配置项和数据显示图表。
        myChart.setOption(option);
		}


	function echarts_2(){
		var myChart = echarts.init(document.getElementById('fb2'));

		var	option = {
    title: {
        text: '',
        subtext: ''
    },
    tooltip: {
        trigger: 'axis'
    },
    legend: {
        data: ['岗位数']
    },
    toolbox: {
        show: true,
        feature: {
            dataView: {show: true, readOnly: false},
            magicType: {show: true, type: ['line', 'bar']},
            restore: {show: true},
            saveAsImage: {show: true}
        }
    },
    calculable: true,
    xAxis: [
        {
            type: 'category',
            data: pie_data.pie_data_index,
            axisLabel:{
                interval:0,
                rotate:-25,
            }
            //data:['1月', '2月', '3月', '4月', '5月', '6月', '7月', '8月', '9月', '10月', '11月', '12月']
        }
    ],
    yAxis: [
        {
            type: 'value'
        }
    ],
    series: [
        {
            name: '岗位数',
            type: 'bar',
            data: bar_data.bardata,
            markPoint: {
                data: [
                    {type: 'max', name: '最大值'},
                    {type: 'min', name: '最小值'}
                ]
            },
            markLine: {
                data: [
                    {type: 'average', name: '平均值'}
                ]
            }
        },

    ]
};
		 myChart.setOption(option);

		}


		})
		</script>
	</body>
</html>
16.templates/xinzi_bar_sum.html
<!DOCTYPE html>
<html>
<head>
<meta charset="UTF-8">
<title>Awesome-pyecharts</title>
<script type="text/javascript" src="https://assets.pyecharts.org/assets/echarts.min.js"></script>
<script type="text/javascript" src="https://assets.pyecharts.org/assets/themes/purple-passion.js"></script>
<script type="text/javascript" src="https://assets.pyecharts.org/assets/jquery.min.js"></script>
<script type="text/javascript" src="https://assets.pyecharts.org/assets/jquery-ui.min.js"></script>
<script type="text/javascript" src="https://assets.pyecharts.org/assets/ResizeSensor.js"></script>
<link rel="stylesheet" type="text/css" href="../static/css/zhuce.css">
<script src="../static/js/jquery.js"></script>
<script src="../static/js/vector.js"></script>
<link rel="stylesheet" href="https://assets.pyecharts.org/assets/jquery-ui.css">
<style>
ul {
list-style: none;
}
a {
text-decoration: none;
}
/*一级菜单样式, 头部导航栏以及登录注册按钮*/
.toubu {
z-index: 1000;
min-width: 1100px;
width: 100%;
height: 50px;
margin: 0px auto;
background-color: white;
font-size: 18px;
font-family: 微软雅黑;
position: fixed;
}
.toubu ul{
height: 50px;
}
.toubu ul li {
left: 500px;
float: left;
/*包含块*/
position:relative;
}
.toubu ul li a {
display: block;
font-size: 18px;
width: 160px;
height: 50px;
line-height: 46px;
text-align: center;
color: black;
}
.toubu ul li a:hover {
color: black;
background-color: aqua;
}
/*二级菜单样式*/
.toubu ul li ul {
position:absolute;
top:50px;
left:-500px;
display:none;
}
.toubu ul li ul li {
float:none;
}
.toubu ul li ul li a{
background-color: white;
font-size: 16px;
color: black;
/* border-top:1px solid #ccc; */
}
/*一级菜单悬停时二级菜单可见*/
.toubu ul li:hover ul {
display:block;
}
.img_1{ /*logo图片设置*/
position: absolute;
float: left;
top: 4px;
left: 250px;
}
.logo_1{
position: absolute;
float: left;
top: 9px;
font-family: "楷体";
font-size: 25px;
font-weight: bold;
left: 335px;
}
.btn_1{ /*登录按钮设置*/
position: absolute;
float: left;
width: 200px;
left: 1150px;
top: 8px;
color: darkslategrey;
background-color: white;
font-size: 15px;
border: 0;
}
</style>
</head>
<body>
<style>.box { z-index: 999; } </style>
<div class="toubu">
<ul>
<a href=""><img src="../static/images/J.png" alt="" class="img_1" width="70" height="40"/></a>
<span class="logo_1">就业信息</span>
<li><a href="">首页</a>
</li>
<li><a href="">平台数据展</a>
<ul>
<li><a href="/test_pic">大数据展示屏</a></li>
<li><a href="/job_demand">各岗位技能分析</a></li>
<li><a href="/xinzi_bar">薪资职位分析</a></li>
<li><a href="/pie_bar_test">各地区岗位分析</a></li>
</ul>
</li>
<li><a href="">其他功能</a>
<ul>
<li><a href="/xinzi_predict">岗位薪资预测</a></li>
</ul>
</li>
<li class="weather"><span id="showTime"></span></li>
<style>
.weather{
padding: 15px;
}
</style>
<script>
var t = null;
t = setTimeout(time, 1000);
function time() {
clearTimeout(t);
dt = new Date();
var y = dt.getFullYear();
var mt = dt.getMonth() + 1;
var day = dt.getDate();
var h = dt.getHours();
var m = dt.getMinutes();
var s = dt.getSeconds();
document.getElementById("showTime").innerHTML = y + "年" + mt + "月" + day + "-" + h + "时" + m + "分" + s + "秒";
t = setTimeout(time, 1000);
}
</script>
</ul>
</div>
<div class="box">
<div id="7d251dbd36804c9ba29bcda69bd228d8" class="chart-container" style="position: absolute; width: 730px; height: 504px; top: 60px; left: 760px;"></div>
<script>
var chart_7d251dbd36804c9ba29bcda69bd228d8 = echarts.init(
document.getElementById('7d251dbd36804c9ba29bcda69bd228d8'), 'purple-passion', {renderer: 'canvas'});
var option_7d251dbd36804c9ba29bcda69bd228d8 = {
"animation": true,
"animationThreshold": 2000,
"animationDuration": 1000,
"animationEasing": "cubicOut",
"animationDelay": 0,
"animationDurationUpdate": 300,
"animationEasingUpdate": "cubicOut",
"animationDelayUpdate": 0,
"series": [
{
"type": "bar",
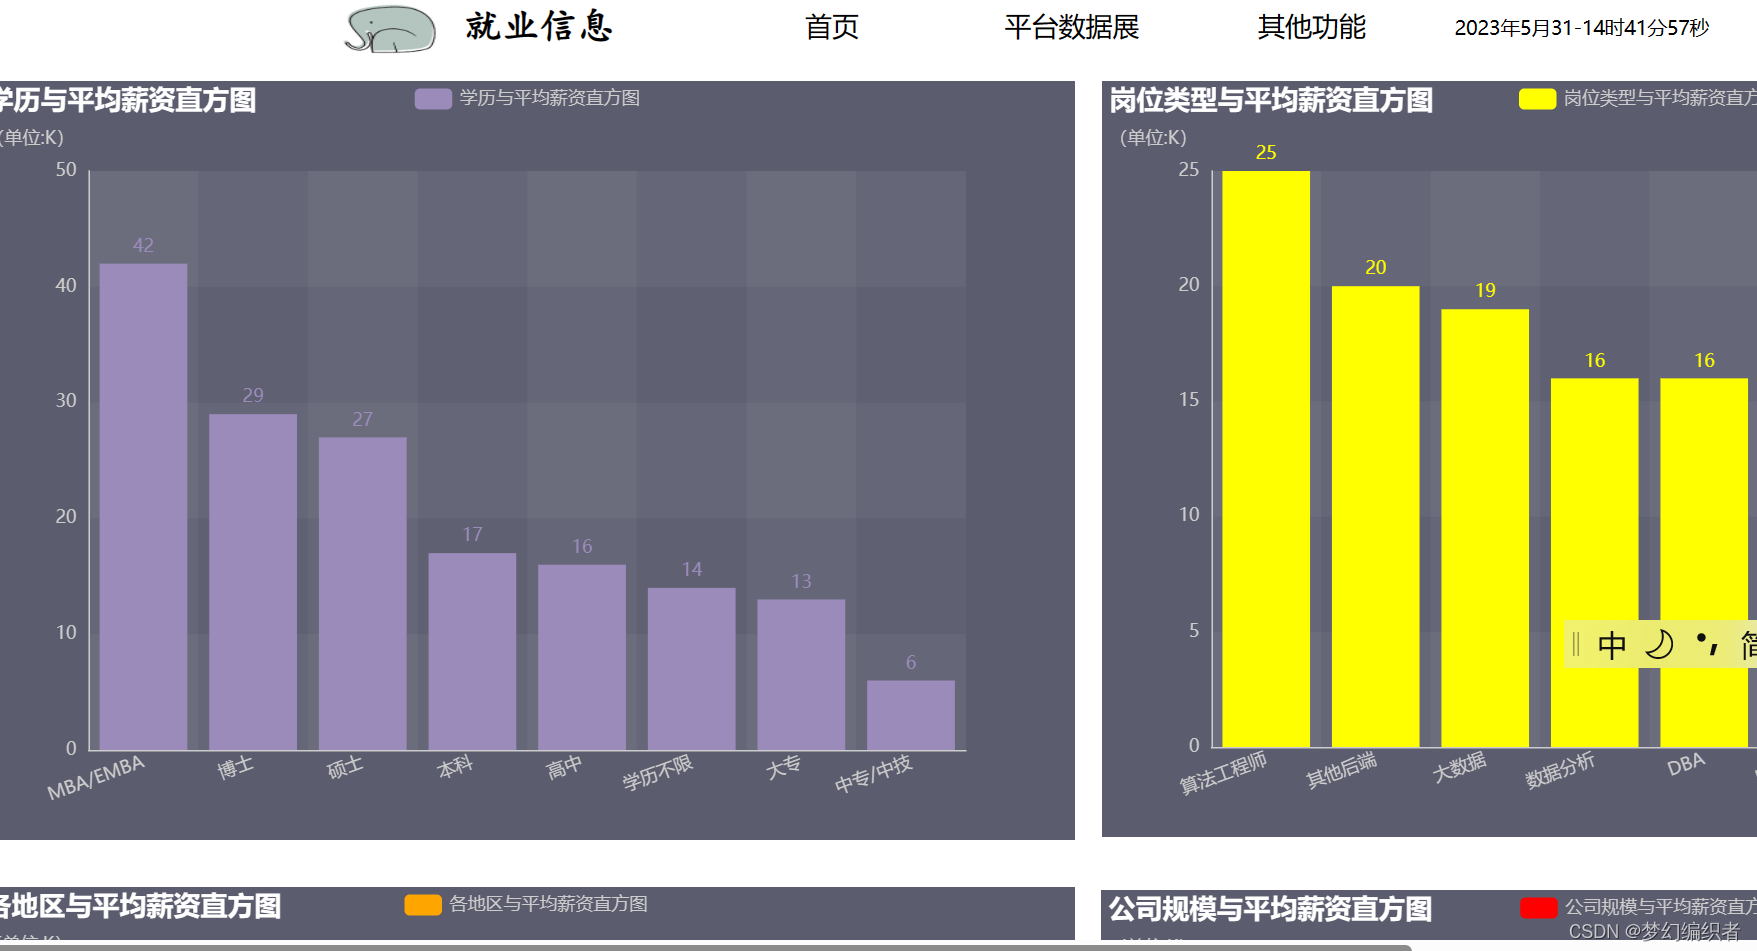
"name": "\u5c97\u4f4d\u7c7b\u578b\u4e0e\u5e73\u5747\u85aa\u8d44\u76f4\u65b9\u56fe",
"legendHoverLink": true,
"data": [
25,
20,
19,
16,
16,
15,
15,
14
],
"showBackground": false,
"barMinHeight": 0,
"barCategoryGap": "20%",
"barGap": "30%",
"large": false,
"largeThreshold": 400,
"seriesLayoutBy": "column",
"datasetIndex": 0,
"clip": true,
"zlevel": 0,
"z": 2,
"label": {
"show": true,
"position": "top",
"margin": 8
},
"itemStyle": {
"color": "yellow"
}
}
],
"legend": [
{
"data": [
"\u5c97\u4f4d\u7c7b\u578b\u4e0e\u5e73\u5747\u85aa\u8d44\u76f4\u65b9\u56fe"
],
"selected": {
"\u5c97\u4f4d\u7c7b\u578b\u4e0e\u5e73\u5747\u85aa\u8d44\u76f4\u65b9\u56fe": true
},
"show": true,
"padding": 5,
"itemGap": 10,
"itemWidth": 25,
"itemHeight": 14
}
],
"tooltip": {
"show": true,
"trigger": "item",
"triggerOn": "mousemove|click",
"axisPointer": {
"type": "line"
},
"showContent": true,
"alwaysShowContent": false,
"showDelay": 0,
"hideDelay": 100,
"textStyle": {
"fontSize": 14
},
"borderWidth": 0,
"padding": 5
},
"xAxis": [
{
"show": true,
"scale": false,
"nameLocation": "end",
"nameGap": 15,
"gridIndex": 0,
"axisLabel": {
"rotate": 20
},
"inverse": false,
"offset": 0,
"splitNumber": 5,
"minInterval": 0,
"splitLine": {
"show": false,
"lineStyle": {
"show": true,
"width": 1,
"opacity": 1,
"curveness": 0,
"type": "solid"
}
},
"data": [
"\u7b97\u6cd5\u5de5\u7a0b\u5e08",
"\u5176\u4ed6\u540e\u7aef",
"\u5927\u6570\u636e",
"\u6570\u636e\u5206\u6790",
"DBA",
"Python",
"web",
"Java"
]
}
],
"yAxis": [
{
"show": true,
"scale": false,
"nameLocation": "end",
"nameGap": 15,
"gridIndex": 0,
"inverse": false,
"offset": 0,
"splitNumber": 5,
"minInterval": 0,
"splitLine": {
"show": false,
"lineStyle": {
"show": true,
"width": 1,
"opacity": 1,
"curveness": 0,
"type": "solid"
}
}
}
],
"title": [
{
"text": "\u5c97\u4f4d\u7c7b\u578b\u4e0e\u5e73\u5747\u85aa\u8d44\u76f4\u65b9\u56fe",
"subtext": "\uff08\u5355\u4f4d:K\uff09",
"padding": 5,
"itemGap": 10
}
]
};
chart_7d251dbd36804c9ba29bcda69bd228d8.setOption(option_7d251dbd36804c9ba29bcda69bd228d8);
</script>
<br/> <div id="411e6df3a0104c269628f2832f615e7d" class="chart-container" style="position: absolute; width: 731px; height: 506px; top: 60px; left: 11px;"></div>
<script>
var chart_411e6df3a0104c269628f2832f615e7d = echarts.init(
document.getElementById('411e6df3a0104c269628f2832f615e7d'), 'purple-passion', {renderer: 'canvas'});
var option_411e6df3a0104c269628f2832f615e7d = {
"animation": true,
"animationThreshold": 2000,
"animationDuration": 1000,
"animationEasing": "cubicOut",
"animationDelay": 0,
"animationDurationUpdate": 300,
"animationEasingUpdate": "cubicOut",
"animationDelayUpdate": 0,
"series": [
{
"type": "bar",
"name": "\u5b66\u5386\u4e0e\u5e73\u5747\u85aa\u8d44\u76f4\u65b9\u56fe",
"legendHoverLink": true,
"data": [
42,
29,
27,
17,
16,
14,
13,
6
],
"showBackground": false,
"barMinHeight": 0,
"barCategoryGap": "20%",
"barGap": "30%",
"large": false,
"largeThreshold": 400,
"seriesLayoutBy": "column",
"datasetIndex": 0,
"clip": true,
"zlevel": 0,
"z": 2,
"label": {
"show": true,
"position": "top",
"margin": 8
}
}
],
"legend": [
{
"data": [
"\u5b66\u5386\u4e0e\u5e73\u5747\u85aa\u8d44\u76f4\u65b9\u56fe"
],
"selected": {
"\u5b66\u5386\u4e0e\u5e73\u5747\u85aa\u8d44\u76f4\u65b9\u56fe": true
},
"show": true,
"padding": 5,
"itemGap": 10,
"itemWidth": 25,
"itemHeight": 14
}
],
"tooltip": {
"show": true,
"trigger": "item",
"triggerOn": "mousemove|click",
"axisPointer": {
"type": "line"
},
"showContent": true,
"alwaysShowContent": false,
"showDelay": 0,
"hideDelay": 100,
"textStyle": {
"fontSize": 14
},
"borderWidth": 0,
"padding": 5
},
"xAxis": [
{
"show": true,
"scale": false,
"nameLocation": "end",
"nameGap": 15,
"gridIndex": 0,
"axisLabel": {
"rotate": 20
},
"inverse": false,
"offset": 0,
"splitNumber": 5,
"minInterval": 0,
"splitLine": {
"show": false,
"lineStyle": {
"show": true,
"width": 1,
"opacity": 1,
"curveness": 0,
"type": "solid"
}
},
"data": [
"MBA/EMBA",
"\u535a\u58eb",
"\u7855\u58eb",
"\u672c\u79d1",
"\u9ad8\u4e2d",
"\u5b66\u5386\u4e0d\u9650",
"\u5927\u4e13",
"\u4e2d\u4e13/\u4e2d\u6280"
]
}
],
"yAxis": [
{
"show": true,
"scale": false,
"nameLocation": "end",
"nameGap": 15,
"gridIndex": 0,
"inverse": false,
"offset": 0,
"splitNumber": 5,
"minInterval": 0,
"splitLine": {
"show": false,
"lineStyle": {
"show": true,
"width": 1,
"opacity": 1,
"curveness": 0,
"type": "solid"
}
}
}
],
"title": [
{
"text": "\u5b66\u5386\u4e0e\u5e73\u5747\u85aa\u8d44\u76f4\u65b9\u56fe",
"subtext": "\uff08\u5355\u4f4d:K\uff09",
"padding": 5,
"itemGap": 10
}
]
};
chart_411e6df3a0104c269628f2832f615e7d.setOption(option_411e6df3a0104c269628f2832f615e7d);
</script>
<br/> <div id="a055deb0d1c64d54bb3590af48b4bc18" class="chart-container" style="position: absolute; width: 732px; height: 474px; top: 597.2222290039062px; left: 10px;"></div>
<script>
var chart_a055deb0d1c64d54bb3590af48b4bc18 = echarts.init(
document.getElementById('a055deb0d1c64d54bb3590af48b4bc18'), 'purple-passion', {renderer: 'canvas'});
var option_a055deb0d1c64d54bb3590af48b4bc18 = {
"animation": true,
"animationThreshold": 2000,
"animationDuration": 1000,
"animationEasing": "cubicOut",
"animationDelay": 0,
"animationDurationUpdate": 300,
"animationEasingUpdate": "cubicOut",
"animationDelayUpdate": 0,
"series": [
{
"type": "bar",
"name": "\u5404\u5730\u533a\u4e0e\u5e73\u5747\u85aa\u8d44\u76f4\u65b9\u56fe",
"legendHoverLink": true,
"data": [
19,
19,
18,
16,
14,
13,
12,
12,
11,
10
],
"showBackground": false,
"barMinHeight": 0,
"barCategoryGap": "20%",
"barGap": "30%",
"large": false,
"largeThreshold": 400,
"seriesLayoutBy": "column",
"datasetIndex": 0,
"clip": true,
"zlevel": 0,
"z": 2,
"label": {
"show": true,
"position": "top",
"margin": 8
},
"itemStyle": {
"color": "orange"
}
}
],
"legend": [
{
"data": [
"\u5404\u5730\u533a\u4e0e\u5e73\u5747\u85aa\u8d44\u76f4\u65b9\u56fe"
],
"selected": {
"\u5404\u5730\u533a\u4e0e\u5e73\u5747\u85aa\u8d44\u76f4\u65b9\u56fe": true
},
"show": true,
"padding": 5,
"itemGap": 10,
"itemWidth": 25,
"itemHeight": 14
}
],
"tooltip": {
"show": true,
"trigger": "item",
"triggerOn": "mousemove|click",
"axisPointer": {
"type": "line"
},
"showContent": true,
"alwaysShowContent": false,
"showDelay": 0,
"hideDelay": 100,
"textStyle": {
"fontSize": 14
},
"borderWidth": 0,
"padding": 5
},
"xAxis": [
{
"show": true,
"scale": false,
"nameLocation": "end",
"nameGap": 15,
"gridIndex": 0,
"axisLabel": {
"rotate": 20
},
"inverse": false,
"offset": 0,
"splitNumber": 5,
"minInterval": 0,
"splitLine": {
"show": false,
"lineStyle": {
"show": true,
"width": 1,
"opacity": 1,
"curveness": 0,
"type": "solid"
}
},
"data": [
"\u4e0a\u6d77",
"\u5317\u4eac",
"\u6df1\u5733",
"\u676d\u5dde",
"\u5e7f\u5dde",
"\u6210\u90fd",
"\u6b66\u6c49",
"\u5929\u6d25",
"\u6d4e\u5357",
"\u9752\u5c9b"
]
}
],
"yAxis": [
{
"show": true,
"scale": false,
"nameLocation": "end",
"nameGap": 15,
"gridIndex": 0,
"inverse": false,
"offset": 0,
"splitNumber": 5,
"minInterval": 0,
"splitLine": {
"show": false,
"lineStyle": {
"show": true,
"width": 1,
"opacity": 1,
"curveness": 0,
"type": "solid"
}
}
}
],
"title": [
{
"text": "\u5404\u5730\u533a\u4e0e\u5e73\u5747\u85aa\u8d44\u76f4\u65b9\u56fe",
"subtext": "\uff08\u5355\u4f4d:K\uff09",
"padding": 5,
"itemGap": 10
}
]
};
chart_a055deb0d1c64d54bb3590af48b4bc18.setOption(option_a055deb0d1c64d54bb3590af48b4bc18);
</script>
<br/> <div id="a3adc9a1473448a3b76a0b0170583ffd" class="chart-container" style="position: absolute; width: 733px; height: 472px; top: 599.1527709960938px; left: 759px;"></div>
<script>
var chart_a3adc9a1473448a3b76a0b0170583ffd = echarts.init(
document.getElementById('a3adc9a1473448a3b76a0b0170583ffd'), 'purple-passion', {renderer: 'canvas'});
var option_a3adc9a1473448a3b76a0b0170583ffd = {
"animation": true,
"animationThreshold": 2000,
"animationDuration": 1000,
"animationEasing": "cubicOut",
"animationDelay": 0,
"animationDurationUpdate": 300,
"animationEasingUpdate": "cubicOut",
"animationDelayUpdate": 0,
"series": [
{
"type": "bar",
"name": "\u516c\u53f8\u89c4\u6a21\u4e0e\u5e73\u5747\u85aa\u8d44\u76f4\u65b9\u56fe",
"legendHoverLink": true,
"data": [
19,
16,
16,
16,
16,
15,
15
],
"showBackground": false,
"barMinHeight": 0,
"barCategoryGap": "20%",
"barGap": "30%",
"large": false,
"largeThreshold": 400,
"seriesLayoutBy": "column",
"datasetIndex": 0,
"clip": true,
"zlevel": 0,
"z": 2,
"label": {
"show": true,
"position": "top",
"margin": 8
},
"itemStyle": {
"color": "red"
}
}
],
"legend": [
{
"data": [
"\u516c\u53f8\u89c4\u6a21\u4e0e\u5e73\u5747\u85aa\u8d44\u76f4\u65b9\u56fe"
],
"selected": {
"\u516c\u53f8\u89c4\u6a21\u4e0e\u5e73\u5747\u85aa\u8d44\u76f4\u65b9\u56fe": true
},
"show": true,
"padding": 5,
"itemGap": 10,
"itemWidth": 25,
"itemHeight": 14
}
],
"tooltip": {
"show": true,
"trigger": "item",
"triggerOn": "mousemove|click",
"axisPointer": {
"type": "line"
},
"showContent": true,
"alwaysShowContent": false,
"showDelay": 0,
"hideDelay": 100,
"textStyle": {
"fontSize": 14
},
"borderWidth": 0,
"padding": 5
},
"xAxis": [
{
"show": true,
"scale": false,
"nameLocation": "end",
"nameGap": 15,
"gridIndex": 0,
"axisLabel": {
"rotate": 20
},
"inverse": false,
"offset": 0,
"splitNumber": 5,
"minInterval": 0,
"splitLine": {
"show": false,
"lineStyle": {
"show": true,
"width": 1,
"opacity": 1,
"curveness": 0,
"type": "solid"
}
},
"data": [
"10000\u4eba\u4ee5\u4e0a",
"1000-9999\u4eba",
"500-999\u4eba",
"300-499\u4eba",
"20-99\u4eba",
"100-299\u4eba",
"20\u4eba\u4ee5\u4e0b"
]
}
],
"yAxis": [
{
"show": true,
"scale": false,
"nameLocation": "end",
"nameGap": 15,
"gridIndex": 0,
"inverse": false,
"offset": 0,
"splitNumber": 5,
"minInterval": 0,
"splitLine": {
"show": false,
"lineStyle": {
"show": true,
"width": 1,
"opacity": 1,
"curveness": 0,
"type": "solid"
}
}
}
],
"title": [
{
"text": "\u516c\u53f8\u89c4\u6a21\u4e0e\u5e73\u5747\u85aa\u8d44\u76f4\u65b9\u56fe",
"subtext": "\uff08\u5355\u4f4d:K\uff09",
"padding": 5,
"itemGap": 10
}
]
};
chart_a3adc9a1473448a3b76a0b0170583ffd.setOption(option_a3adc9a1473448a3b76a0b0170583ffd);
</script>
<br/> </div>
<script>
$('#7d251dbd36804c9ba29bcda69bd228d8').css('border-style', 'dashed').css('border-width', '0px');$("#7d251dbd36804c9ba29bcda69bd228d8>div:nth-child(1)").width("100%").height("100%");
new ResizeSensor(jQuery('#7d251dbd36804c9ba29bcda69bd228d8'), function() { chart_7d251dbd36804c9ba29bcda69bd228d8.resize()});
$('#411e6df3a0104c269628f2832f615e7d').css('border-style', 'dashed').css('border-width', '0px');$("#411e6df3a0104c269628f2832f615e7d>div:nth-child(1)").width("100%").height("100%");
new ResizeSensor(jQuery('#411e6df3a0104c269628f2832f615e7d'), function() { chart_411e6df3a0104c269628f2832f615e7d.resize()});
$('#a055deb0d1c64d54bb3590af48b4bc18').css('border-style', 'dashed').css('border-width', '0px');$("#a055deb0d1c64d54bb3590af48b4bc18>div:nth-child(1)").width("100%").height("100%");
new ResizeSensor(jQuery('#a055deb0d1c64d54bb3590af48b4bc18'), function() { chart_a055deb0d1c64d54bb3590af48b4bc18.resize()});
$('#a3adc9a1473448a3b76a0b0170583ffd').css('border-style', 'dashed').css('border-width', '0px');$("#a3adc9a1473448a3b76a0b0170583ffd>div:nth-child(1)").width("100%").height("100%");
new ResizeSensor(jQuery('#a3adc9a1473448a3b76a0b0170583ffd'), function() { chart_a3adc9a1473448a3b76a0b0170583ffd.resize()});
var charts_id = ['7d251dbd36804c9ba29bcda69bd228d8','411e6df3a0104c269628f2832f615e7d','a055deb0d1c64d54bb3590af48b4bc18','a3adc9a1473448a3b76a0b0170583ffd'];
function downloadCfg () {
const fileName = 'chart_config.json'
let downLink = document.createElement('a')
downLink.download = fileName
let result = []
for(let i=0; i<charts_id.length; i++) {
chart = $('#'+charts_id[i])
result.push({
cid: charts_id[i],
width: chart.css("width"),
height: chart.css("height"),
top: chart.offset().top + "px",
left: chart.offset().left + "px"
})
}
let blob = new Blob([JSON.stringify(result)])
downLink.href = URL.createObjectURL(blob)
document.body.appendChild(downLink)
downLink.click()
document.body.removeChild(downLink)
}
</script>
</body>
</html>
17.templates/zhuce.html
<!DOCTYPE html>
<html>
<head>
<meta charset="utf-8" />
 <title>登录注册</title>
    <link rel="stylesheet" type="text/css" href="../static/css/zhuce.css">
    <script src="../static/js/jquery.js"></script>
    <script src="../static/js/vector.js"></script>
    <script type="text/javascript">

    $(function(){
    	Victor("container", "output");   //登陆背景函数

      });
//     function login(){
//         $.ajax({
//             url: "/ssm-test/findUser",//指定请求地址
//             data:{
//             "username":	$("input[name=u]").val(),
//             "password": $("input[name=p]").val() },//承载参数数据
//             type:"POST",//指定提交类型
//             dataType:"TEXT",//指定返回数据
//             success: function(data){
//             if(data){
// //             	alert(data);
// 				var fid = data.split('id":')[1];
// 				var id = fid.split(',"nickname')[0];
// // 				alert(id);
//             	alert("登录成功");
//             	window.location.href="frame.html?id=" + id;
//             }
//             else{
//             	alert("密码或用户名错误");
//             }
//             },//程序异常回应函数
//             error:function(err){
//                    console.log(err,"出错了");
//             }
//          });
//
//     };
//     $(document).ready(function(){

//      });
    </script>
    <style>
		ul {
				list-style: none;
			}
			a {
				text-decoration: none;
			}
			/*一级菜单样式, 头部导航栏以及登录注册按钮*/
			.toubu {
				min-width: 1100px;
				width: 100%;
				height: 50px;
				margin: 0px auto;
				background-color: white;
				font-size: 18px;
				font-family: 微软雅黑;
				position: fixed;
			}
			.toubu ul{
				height: 50px;
			}
		   .toubu ul li {
			   left: 500px;
		        float: left;
		        /*包含块*/
		        position:relative;
		    }
		    .toubu ul li a {
				display: block;
				font-size: 18px;
				width: 160px;
				height: 50px;
				line-height: 46px;
				text-align: center;
				color: black;
		        }

			.toubu ul li a:hover {
				color: black;
			   background-color: aqua;
			}
		/*二级菜单样式*/
		        .toubu ul li ul {
		        position:absolute;
		        top:50px;
		        left:-500px;
		        display:none;

		        }
				.toubu ul li ul li {
				float:none;
				}
				.toubu ul li ul li a{
				background-color: white;
				font-size: 16px;
				color: black;
				/* border-top:1px solid #ccc; */
				}
		            /*一级菜单悬停时二级菜单可见*/
		        .toubu ul li:hover ul {
		        display:block;
		        }
			.img_1{   /*logo图片设置*/
				position: absolute;
				float: left;
				top: 4px;
				left: 250px;
			}
			.logo_1{
				position: absolute;
				float: left;
				top: 9px;
				font-family: "楷体";
				font-size: 25px;
				font-weight: bold;

				left: 335px;
			}
		.btn_1{   /*登录按钮设置*/
			position: absolute;
			float: left;
			width: 65px;
			left: 1150px;
			top: 12px;
			color: darkslategrey;
			background-color: gainsboro;
			font-size: 18px;
			border: 0;
		}			/*注册按钮设置*/
		.btn_2{
			position: absolute;
			float: left;
			top: 12px;
			width: 65px;
			left: 1230px;
			color: darkslategrey;
			background-color: gainsboro;
			font-size: 18px;
			border: 0;
		}

		/*隐藏层,遮罩层,hide*/
		.hide{
			display: none;

		}
		.shadow{
			position: fixed;
			left: 0;
			top: 0;
			right: 0;
			bottom: 0;
			background-color: black;
			opacity: 0.3;
			z-index: 999;
		}
		.modal{
			position: fixed;
			z-index: 1000;
			left: 68%;
			top: 9%;
			height: 500px;
			width: 400px;
			background-color: white;
		}
		.modal form input{
			background-color: aliceblue;
			margin-top: 20px;
			font-size: 16px;
			border: 1px darkgrey;
			color: darkslategrey;
		}


       #entry_btn{
       		width:100px;
       		height:35px;
       }
    </style>
</head>
<body>
<div id="container">
	<div id="output">
		<div class="toubu">
		    <ul>
				<a href=""><img src="../static/images/J.png" alt="" class="img_1"  width="70" height="40"/></a>
				<span class="logo_1">就业信息</span>
		        <li><a href="">首页</a>
		        </li>
		        <li><a href="">平台数据展</a>
		            <ul>
		                <li><a href="/test_pic">大数据展示屏</a></li>
		                <li><a href="/job_demand">各岗位技能分析</a></li>
		                <li><a href="/xinzi_bar">薪资职位分析</a></li>
						<li><a href="/pie_bar_test">各地区岗位分析</a></li>
		            </ul>
		        </li>
		        <li><a href="">其他功能</a>
                    <ul>
                        <li><a href="/xinzi_predict">岗位薪资预测</a></li>
                    </ul>
                </li>
		    </ul>
			<a href="/denglu/"><button class="btn_1" style="cursor:hand" >登录</button></a>
			<button class="btn_2" onclick="showModel()">注册</button>
			<div class="shadow hide" id="shadow"></div>
			<div class="modal hide" id="modal">
				<form method="POST" action="/zhuce/">
				<div style="width: 360px; height: 20px;  right: 20px; ">
				<span style=" float: right;"  ><a href="/denglu/" style="font-size: 15px; color: black;">关闭</a></span>
				</div>
				<h2 style="font-size: 21px;  font-family: '楷体'" align="center" >用户注册</h2>

				<p>
					<input type="text" name="aca" placeholder="请输入学院"/>
				</p>
				<p>
					<input type="text" name="class" placeholder="请输入班级"/>
				</p>
				<p>
					<input type="text" name="uname" placeholder="请输入姓名"/>
				</p>
				<p>
					<input type="text" name="stuid" placeholder="请输入学号"/>
				</p>
				<p>
					<input type="password" name="password" placeholder="请输入密码"/>
				</p>
				<p>
					<input type="text" name="age" placeholder="请输入年龄"/>
				</p>
				<input type="submit" value="提交" style="color: black;"/>
				</form>
			</div>
			<a href="/denglu/"><button class="btn_1" style="cursor:hand" >登录</button></a>
			<button class="btn_2" onclick="showModel()">注册</button>
		</div>

        {% if message %}
                    <script>
                        alert('{{ message }}');
                    </script>
                 {% endif %}

        {% if msg %}
                    <script>
                        alert('{{ msg }}');
                    </script>
                 {% endif %}


		<script>
			function showModel(){
				document.getElementById("shadow").classList.remove('hide');
				document.getElementById('modal').classList.remove('hide');

			}
		</script>

		<div class="containerT">
			<h1>用户登录 <p style="color: red;text-align: center">{{error_msg}}</p></h1>
			<form class="form" id="entry_form"  action="/denglu/" method="post">
				<input type="text" placeholder="用户名" name="username">
				<input type="password" placeholder="密码" name="password">
				<button type="submit" id="entry_btn">登录</button>

				<div id="prompt" class="prompt"></div>
			</form>
		</div>
	</div>
</div>
</body>
</body>
</html>

<!--


 -->
18.templates/zhuye.html
<!DOCTYPE html>
<html lang="en">
<head>
<meta charset="UTF-8">
<title>就业信息网</title>
<link rel="stylesheet" type="text/css" href="../static/css/zhuce.css">
<script src="../static/js/jquery.js"></script>
<script src="../static/js/vector.js"></script>
<script type="text/javascript"></script>
<script type="text/javascript">
$(function(){
Victor("container", "output"); //登陆背景函数
});
</script>
<style>
ul {
list-style: none;
}
a {
text-decoration: none;
}
/*一级菜单样式, 头部导航栏以及登录注册按钮*/
.toubu {
z-index: 1000;
min-width: 1100px;
width: 100%;
height: 50px;
margin: 0px auto;
background-color: white;
font-size: 18px;
font-family: 微软雅黑;
position: fixed;
}
.toubu ul{
height: 50px;
}
.toubu ul li {
left: 500px;
float: left;
/*包含块*/
position:relative;
}
.toubu ul li a {
display: block;
font-size: 18px;
width: 160px;
height: 50px;
line-height: 46px;
text-align: center;
color: black;
}
.toubu ul li a:hover {
color: black;
background-color: aqua;
}
/*二级菜单样式*/
.toubu ul li ul {
position:absolute;
top:50px;
left:-500px;
display:none;
}
.toubu ul li ul li {
float:none;
}
.toubu ul li ul li a{
background-color: white;
font-size: 16px;
color: black;
/* border-top:1px solid #ccc; */
}
/*一级菜单悬停时二级菜单可见*/
.toubu ul li:hover ul {
display:block;
}
.img_1{ /*logo图片设置*/
position: absolute;
float: left;
top: 4px;
left: 250px;
}
.logo_1{
position: absolute;
float: left;
top: 9px;
font-family: "楷体";
font-size: 25px;
font-weight: bold;
left: 335px;
}
.btn_1{ /*登录按钮设置*/
position: absolute;
float: left;
width: 200px;
left: 1150px;
top: 8px;
color: darkslategrey;
background-color: white;
font-size: 15px;
border: 0;
}
/* 中间插件设置 */
.containerT1{
width:300px;
height:400px;
text-align:center;
position:absolute;
top:40%;
left:28%;
margin:-150px 0 0 -200px;
border-radius:3px;
background-color: azure;
}
.containerT2{
width:300px;
height:400px;
text-align:center;
position:absolute;
top:40%;
left:53%;
margin:-150px 0 0 -200px;
border-radius:3px;
background-color: azure;
z-index: 999;
}
.containerT3{
width:300px;
height:400px;
text-align:center;
position:absolute;
top:40%;
left:78%;
margin:-150px 0 0 -200px;
border-radius:3px;
background-color: azure;
}
.t1{
margin-top: 40px;
}
.t1 p{
font-family: "微软雅黑";
font-size: 22px;
padding: 20px;
}
.t1 button{
background-color: deepskyblue;
width: 100px;
height: 34px;
border: none;
}
.zixun{
position: absolute;
width: 100%;
height: 900px;
margin-top: 660px;
background-color: beige;
}
.zixun p{
padding-top: 20px;
font-size: 14px;
text-align: center;
}
</style>
</head>
<body>
<div id="container">
<div id="output">
<div class="toubu">
<ul>
<a href=""><img src="../static/images/J.png" alt="" class="img_1" width="70" height="40"/></a>
<span class="logo_1">就业信息</span>
<li><a href="">首页</a>
</li>
<li><a href="">平台数据展</a>
<ul>
<li><a href="/test_pic">大数据展示屏</a></li>
<li><a href="/job_demand">各岗位技能分析</a></li>
<li><a href="/xinzi_bar">薪资职位分析</a></li>
<li><a href="/pie_bar_test">各地区岗位分析</a></li>
</ul>
</li>
<li><a href="">其他功能</a>
<ul>
<li><a href="/xinzi_predict">岗位薪资预测</a></li>
</ul>
</li>
</ul>
<h2 class="btn_1">欢迎您,{{username}}</h2>
</div>
<!-- 中间三个小插件 -->
<div class="containerT1">
<div class="t1">
<img src="../static/images/mid_1.png" />
<p>大数据展示屏</p>
<h3 style="font-size: 18px;padding-top: 25px;padding-left: 35px;padding-right: 35px;">可视化海量职位的数据大屏,为计算机行业各类招聘情况、主要城市工作岗位需求提供便利化方案。</h3>
<br /><br />
<a href="/test_pic"><button style="font-size: 18px; ">点击体验</button></a>
</div>
</div>
<div class="containerT2">
<div class="t1">
<img src="../static/images/mid_2.png" />
<p>数据分析</p>
<h3 style="font-size: 18px;padding-top: 25px;padding-left: 35px;padding-right: 35px;">包含拉勾网、智联招聘和BOSS直聘 职位数据的数据采集,同时提供了计算机行业工作岗位需求分析。</h3>
<br /><br />
<a href="/pie_bar_test"><button style="font-size: 18px; ">点击体验</button></a>
</div>
</div>
<div class="containerT3">
<div class="t1">
<img src="../static/images/mid_3.png" />
<p>就业服务预测</p>
<h3 style="font-size: 18px;padding-top: 25px;padding-left: 35px;padding-right: 35px;">利用专业的测量工具,根据有关字段进行预测,让用户真正了解行业就业情况,寻找适合自己的岗位。</h3>
<br /><br />
<a href="/xinzi_predict"><button style="font-size: 18px;">点击体验</button></a>
</div>
</div>
<!-- 设置资讯 -->
<div class="zixun">
<a href="/denglu/"><p>关于网站 | 关于我们</p></a>
</div>
</div>
</div>
</body>
</body>
</html>19.数据库迁移
python manage.py makemigrations20.更新数据库
python manage.py migrate21.运行项目,Django 项目中运行本地服务器的命令。它会启动一个本地的开发服务器,使你能够在浏览器中查看你的 Django 应用程序。在运行该命令后,你可以在浏览器中输入 http://127.0.0.1:8000/ 或 http://localhost:8000/ 访问你的应用程序。
python manage.py runserver
最后进入网站页面,首页页面如下图所示:
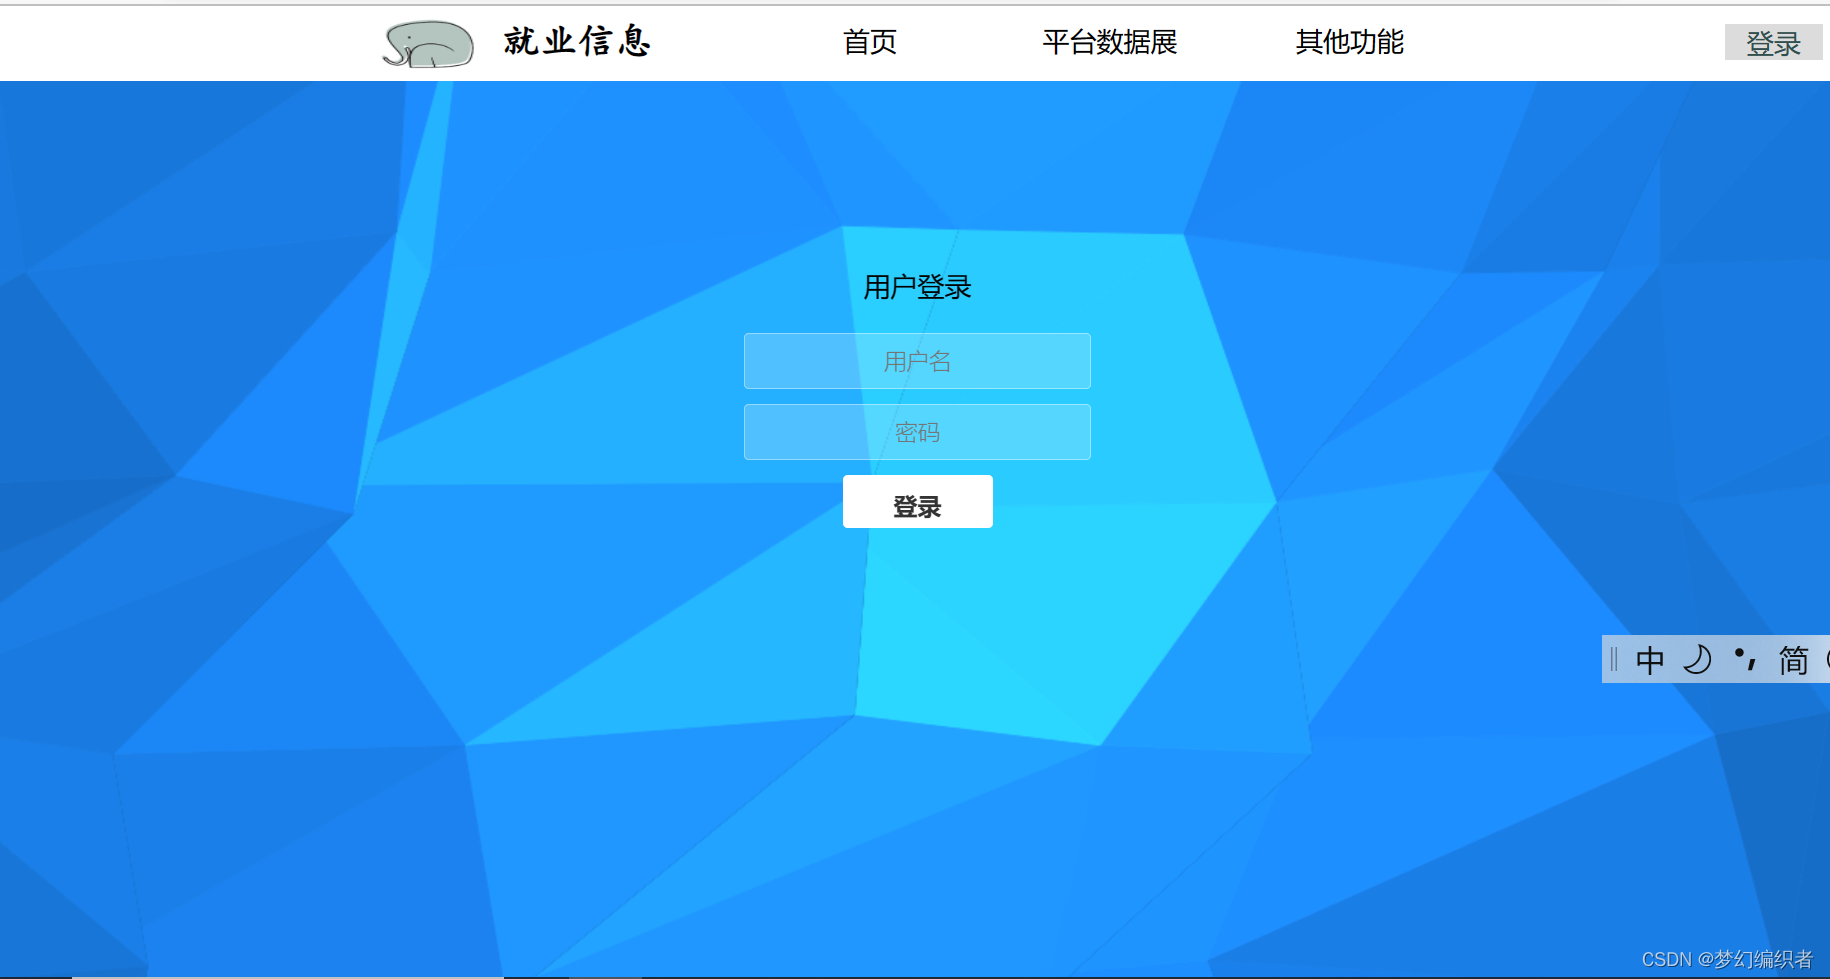
登录后,点击平台数据展,一下有几个数据可视化,如下图所示:
