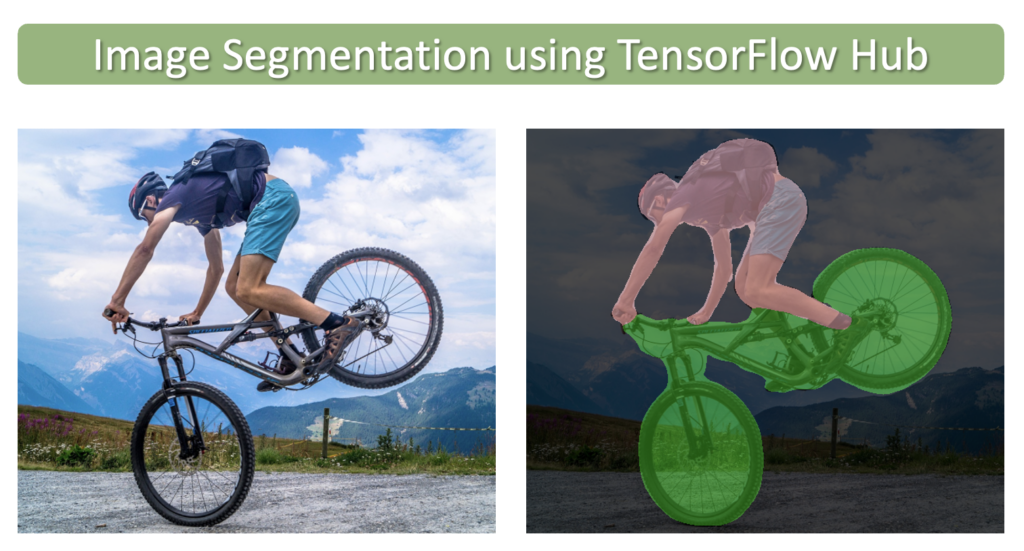
在本文中,我们将学习如何使用 TensorFlow Hub中提供的预训练模型执行语义图像分割。TensorFlow Hub 是一个库和平台,旨在共享、发现和重用预训练的机器学习模型。TensorFlow Hub 的主要目标是简化重用现有模型的过程,从而促进协作、减少冗余工作并加速机器学习的研发。用户可以搜索社区贡献或谷歌提供的预训练模型,称为模块。只需几行代码,就可以将这些模块轻松集成到用户自己的机器学习项目中。
图像分割类似于图像分类,但在像素级别。图像分割的目标是简化图像的表示,使其对分析或进一步处理更有意义。换句话说,它旨在将图像的重要部分(例如对象或感兴趣区域)与背景或不相关区域分开。 您可以在我们关于该主题的介绍性文章中阅读有关 。
import os
import numpy as np
import cv2
import zipfile
import requests
import glob as glob

import tensorflow as tf
import tensorflow_hub as hub

import matplotlib.pyplot as plt
from matplotlib.patches import Rectangle

import warnings
import logging
import absl

# Filter absl warnings
warnings.filterwarnings("ignore", module="absl")

# Capture all warnings in the logging system
logging.captureWarnings(True)

# Set the absl logger level to 'error' to suppress warnings
absl_logger = logging.getLogger("absl")
absl_logger.setLevel(logging.ERROR)

os.environ['TF_CPP_MIN_LOG_LEVEL'] = '2'
下载示例 (CamVid) 图像
def download_file(url, save_name):
    url = url
    file = requests.get(url)

    open(save_name, 'wb').write(file.content)

def unzip(zip_file=None):
    try:
        with zipfile.ZipFile(zip_file) as z:
            z.extractall("./")
            print("Extracted all")
    except:
        print("Invalid file")

download_file(
    'https://www.dropbox.com/s/5jhbvmqgzbzl9fd/camvid_images.zip?dl=1',
    'camvid_images.zip'
)

unzip(zip_file='camvid_images.zip')
显示样本图像
image_paths = sorted(glob.glob('camvid_images' + '/*.png'))

for idx in range(len(image_paths)):
    print(image_paths[idx])
camvid_images/camvid_sample_1.png
camvid_images/camvid_sample_2.png
camvid_images/camvid_sample_3.png
camvid_images/camvid_sample_4.png
def load_image(path):

    image = cv2.imread(path)

    # Convert image in BGR format to RGB.
    image = cv2.cvtColor(image, cv2.COLOR_BGR2RGB)

    # Add a batch dimension which is required by the model.
    image = np.expand_dims(image, axis=0)/255.0

    return image

images = []
fig, ax = plt.subplots(nrows=2, ncols=2, figsize=(16, 12))

for idx, axis in enumerate(ax.flat):
    image = load_image(image_paths[idx])
    images.append(image)
    axis.imshow(image[0])
    axis.axis('off')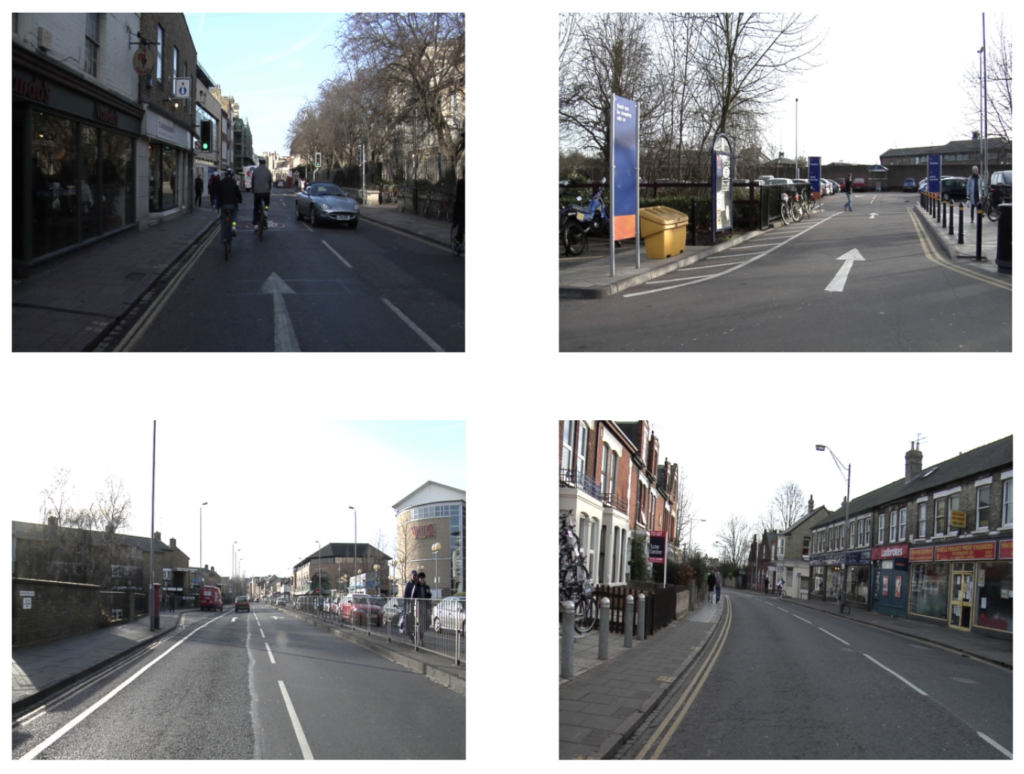
定义将类 ID 映射到类名称和类颜色的字典
class_index 是一个字典,将 CamVid 数据集中的所有 32 个类与其关联的类 ID 和 RGB 颜色标签进行映射。
class_index = \
    {
         0: [(64, 128, 64),  'Animal'],
         1: [(192, 0, 128),  'Archway'],
         2: [(0, 128, 192),  'Bicyclist'],
         3: [(0, 128, 64),   'Bridge'],
         4: [(128, 0, 0),    'Building'],
         5: [(64, 0, 128),   'Car'],
         6: [(64, 0, 192),   'Cart/Luggage/Pram'],
         7: [(192, 128, 64), 'Child'],
         8: [(192, 192, 128),'Column Pole'],
         9: [(64, 64, 128),  'Fence'],
        10: [(128, 0, 192),  'LaneMkgs Driv'],
        11: [(192, 0, 64),   'LaneMkgs NonDriv'],
        12: [(128, 128, 64), 'Misc Text'],
        13: [(192, 0, 192),  'Motorcycle/Scooter'],
        14: [(128, 64, 64),  'Other Moving'],
        15: [(64, 192, 128), 'Parking Block'],
        16: [(64, 64, 0),    'Pedestrian'],
        17: [(128, 64, 128), 'Road'],
        18: [(128, 128, 192),'Road Shoulder'],
        19: [(0, 0, 192),    'Sidewalk'],
        20: [(192, 128, 128),'Sign Symbol'],
        21: [(128, 128, 128),'Sky'],
        22: [(64, 128, 192), 'SUV/Pickup/Truck'],
        23: [(0, 0, 64),     'Traffic Cone'],
        24: [(0, 64, 64),    'Traffic Light'],
        25: [(192, 64, 128), 'Train'],
        26: [(128, 128, 0),  'Tree'],
        27: [(192, 128, 192),'Truck/Bus'],
        28: [(64, 0, 64),    'Tunnel'],
        29: [(192, 192, 0),  'Vegetation Misc'],
        30: [(0, 0, 0),      'Void'],
        31: [(64, 192, 0),   'Wall']
    }
使用 TensorFlow Hub 进行模型推理
TensorFlow Hub 包含许多不同的预训练 分割模型。在这里,我们将使用在 CamVid ( ) 上训练的高分辨率网络 (HRNet) 分割模型camvid-hrnetv2-w48。该模型已经在 Imagenet ILSVRC-2012 分类任务上进行了预训练,并在 CamVid 上进行了微调。
从 TensorFlow Hub 加载模型
我们可以使用模型页面的 URL 将模型加载到内存中。
model_url =  'https://tfhub.dev/google/HRNet/camvid-hrnetv2-w48/1'
print('loading model: ', model_url)

seg_model = hub.load(model_url)
print('\nmodel loaded!')
执行推理
在我们将代码形式化以处理多个图像并对结果进行后处理之前,让我们首先了解如何对单个图像执行推理并研究模型的输出。
调用模型的 precict() 方法
# Make a prediction using the first image in the list of images.
pred_mask = seg_model.predict(images[0])

# The predicted mask has the following shape: [B, H, W, C].
print('Shape of predicted mask: ', pred_mask.shape)
对预测的分割掩码进行后处理
模型返回的预测分割掩码包含每个类的单独通道。每个通道都包含输入图像中给定像素与该通道的类别相关联的概率。因此,此数据需要进行一些后处理才能获得有意义的结果。需要执行几个步骤才能获得最终的视觉表示。
- 删除批次维度和背景类。
- 根据所有通道中的最高概率得分为图像中的每个像素分配一个类别标签。
- 上一步生成一个单通道图像,其中包含每个像素的类标签。因此,我们需要将这些类 ID 映射到 RGB 值,以便我们可以将结果可视化为颜色编码的分割图。
删除批次维度和背景类
# Convert tensor to numpy array.
pred_mask = pred_mask.numpy()

# The 1st label is the background class added by the model, but we can remove it for this dataset.
pred_mask = pred_mask[:,:,:,1:]

# We also need to remove the batch dimension.
pred_mask = np.squeeze(pred_mask)

# Print the shape to confirm: [H, W, C].
print('Shape of predicted mask after removal of batch dimension and background class: ', pred_mask.shape)
可视化中间结果
# Each channel in `pred_mask` contains the probabilities that the pixels
# in the original image are associated with the class for that channel.
plt.figure(figsize=(20,6))

plt.subplot(1,3,1)
plt.title('Input Image', fontsize=14)
plt.imshow(np.squeeze(images[0]))

plt.subplot(1,3,2)
plt.title('Predictions for Class: Road', fontsize=14)
plt.imshow(pred_mask[:,:,17], cmap='gray');  # Class 17 corresponds to the 'road' class
plt.axis('off')

plt.subplot(1,3,3)
plt.title('Predictions for Class: Sky', fontsize=14)
plt.imshow(pred_mask[:,:,21], cmap='gray');  # Class 21 corresponds to the 'sky' class
plt.axis('off');
为每个像素分配一个类别标签
在这里,我们根据概率最高的类为图像中的每个像素分配一个类 ID。我们可以将其可视化为灰度图像。在下面的代码单元中,我们将仅显示图像的顶部以突出显示一些课堂作业。
# Assign each pixel in the image a class ID based on the channel that contains the
# highest probability score. This can be implemented using the `argmax` function.
pred_mask_class = np.argmax(pred_mask, axis=-1)

plt.figure(figsize=(15,5));

plt.subplot(1,2,1)
plt.title('Input Image', fontsize=12)
plt.imshow(np.squeeze(images[0]))

plt.subplot(1,2,2)
plt.title('Segmentation Mask', fontsize=12)
plt.imshow(pred_mask_class, cmap='gray')
plt.gca().add_patch(Rectangle((450,200),200,3, edgecolor='red', facecolor='none', lw=.5));
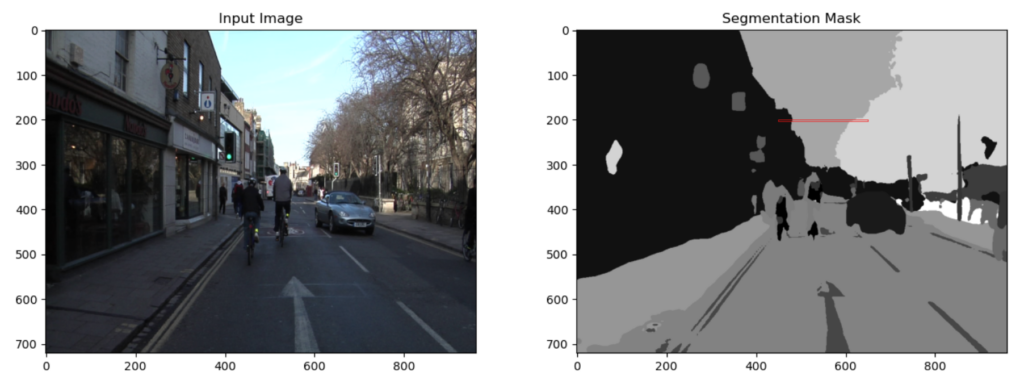
现在让我们检查分割掩码的一小块区域,以更好地了解值如何映射到类 ID。作为参考,分割掩码 ( ) 的顶部(200 行)pred_mask_class已覆盖在输入图像上。请注意,分割蒙版中的区域对应于输入图像中的不同区域(例如,建筑物、天空、树木)。

# Print the class IDs from the last row in the above image.
print(pred_mask_class[200,450:650])
[ 4 4 4 4 4 4 4 4 4 4 4 4 4 4 4 4 4 4 4 4 4 4 4 4
4 4 4 4 4 4 4 4 21 21 21 21 21 21 21 21 21 21 21 21 21 21 21 21
21 21 21 21 21 21 21 21 21 21 21 21 21 21 21 21 21 21 21 21 21 21 21 21
21 21 21 21 21 21 21 21 21 21 21 21 21 21 21 21 21 21 21 21 21 21 21 21
21 21 21 21 21 21 21 21 21 21 21 21 21 21 21 21 21 21 21 21 21 21 21 21
21 21 21 21 21 21 21 21 21 21 21 21 21 21 21 21 21 21 21 21 21 21 21 21
21 21 21 21 21 21 21 21 21 21 21 21 21 21 21 21 21 21 21 21 21 21 21 21
26 26 21 21 26 26 26 26 26 26 26 26 26 26 26 26 26 26 26 26 26 26 26 26
26 26 26 26 26 26 26 26]
pred_mask_class请注意,红色矩形指示的小部分中的值对应于建筑物、天空和树木的类 ID。
将单通道蒙版转换为颜色表示
我们还需要使用下面的函数将单个通道掩码转换为 RGB 表示以用于可视化目的。单通道掩码中的每个类 ID 将根据 class_index 字典映射转换为不同的颜色。
# Function to convert a single channel mask representation to an RGB mask.
def class_to_rgb(mask_class, class_index):

    # Create RGB channels
    r_map = np.zeros_like(mask_class).astype(np.uint8)
    g_map = np.zeros_like(mask_class).astype(np.uint8)
    b_map = np.zeros_like(mask_class).astype(np.uint8)

    # Populate RGB color channels based on the color assigned to each class.
    for class_id in range(len(class_index)):
        index = mask_class == class_id
        r_map[index] = class_index[class_id][0][0]
        g_map[index] = class_index[class_id][0][1]
        b_map[index] = class_index[class_id][0][2]

    seg_map_rgb = np.stack([r_map, g_map, b_map], axis=2)

    return seg_map_rgb
将灰度分割掩码转换为颜色分割掩码并显示结果。
pred_mask_rgb = class_to_rgb(pred_mask_class, class_index)

plt.figure(figsize=(20,8))

plt.subplot(1,3,1)
plt.title('Input Image', fontsize=14)
plt.imshow(np.squeeze(images[0]))
plt.axis('off')

plt.subplot(1,3,2)
plt.title('Grayscale Segmentation', fontsize=14)
plt.imshow(pred_mask_class, cmap='gray')
plt.axis('off')

plt.subplot(1,3,3)
plt.title('Color Segmentation', fontsize=14)
plt.imshow(pred_mask_rgb, cmap='gray')
plt.axis('off');
正式实施
在本节中,我们将正式实现并需要定义一些额外的便利函数。
image_overlay()
image_overlay() 是一个辅助函数,用于在原始图像之上叠加 RGB 掩码,以更好地理解预测与原始图像的对齐方式。
# Function to overlay a segmentation map on top of an RGB image.
def image_overlay(image, seg_map_rgb):

    alpha = 1.0 # Transparency for the original image.
    beta  = 0.6 # Transparency for the segmentation map.
    gamma = 0.0 # Scalar added to each sum.

    image = (image*255.0).astype(np.uint8)
    seg_map_rgb = cv2.cvtColor(seg_map_rgb, cv2.COLOR_RGB2BGR)

    image = cv2.addWeighted(image, alpha, seg_map_rgb, beta, gamma)
    image = cv2.cvtColor(image, cv2.COLOR_BGR2RGB)

    return image
run_inference()
为了对多张图像进行推理,我们定义了下面的函数,它接受图像列表和预训练模型。此函数还处理计算最终分割掩码和叠加层所需的所有后处理。
def run_inference(images, model):

    for img in images:

        # Forward pass through the model (convert the tensor output to a numpy array).
        pred_mask = model.predict(img).numpy()

        # Remove the background class added by the model.
        pred_mask = pred_mask[:,:,:,1:]

        # Remove the batch dimension.
        pred_mask = np.squeeze(pred_mask)

        # `pred_mask` is a numpy array of shape [H, W, 32] where each channel contains the probability
        # scores associated with a given class. We still need to assign a single class to each pixel
        # which is accomplished using the argmax function across the last dimension to obtain the class labels.
        pred_mask_class = np.argmax(pred_mask, axis=-1)

        # Convert the predicted (class) segmentation map to a color segmentation map.
        pred_mask_rgb = class_to_rgb(pred_mask_class, class_index)

        fig = plt.figure(figsize=(20, 15))

        # Display the original image.
        ax1 = fig.add_subplot(1,3,1)
        ax1.imshow(img[0])
        ax1.title.set_text('Input Image')
        plt.axis('off')

        # Display the predicted color segmentation mask.
        ax2 = fig.add_subplot(1,3,2)
        ax2.set_title('Predicted Mask')
        ax2.imshow(pred_mask_rgb)
        plt.axis('off')

        # Display the predicted color segmentation mask overlayed on the original image.
        overlayed_image = image_overlay(img[0], pred_mask_rgb)
        ax4 = fig.add_subplot(1,3,3)
        ax4.set_title('Overlayed Image')
        ax4.imshow(overlayed_image)
        plt.axis('off')

        plt.show()
plot_color_legend()
该函数 plot_color_legend() 为 CamVid 数据集创建一个颜色图例,这有助于确认模型的类分配。
def plot_color_legend(class_index):

    # Extract colors and labels from class_index dictionary.
    color_array = np.array([[v[0][0], v[0][1], v[0][2]] for v in class_index.values()]).astype(np.uint8)
    class_labels = [val[1] for val in class_index.values()]

    fig, ax = plt.subplots(nrows=2, ncols=16, figsize=(20, 3))
    plt.subplots_adjust(wspace = 0.5, hspace=0.01)

    # Display color legend.
    for i, axis in enumerate(ax.flat):

        axis.imshow(color_array[i][None, None, :])
        axis.set_title(class_labels[i], fontsize = 8)
        axis.axis('off')

plot_color_legend(class_index)
对样本图像进行预测
现在,让我们使用此函数使用上面选择的三个模型对示例图像进行推理。
run_inference(images, seg_model)

结论
在本文中,我们介绍了如何使用 TensorFlow Hub 中提供的预训练图像分割模型。TensorFlow Hub 通过提供用于共享、发现和重用预训练机器学习模型的中央存储库,简化了重用现有模型的过程。使用这些模型的一个重要方面涉及理解解释其输出的过程。图像分割模型生成多通道分割掩码,其中包含需要进一步处理以生成最终分割图的概率分数。
![[比赛简介]ICR - Identifying Age-Related Conditions](https://img-blog.csdnimg.cn/5b2e3e4152e646979669babb6095055e.png)

