背景介绍
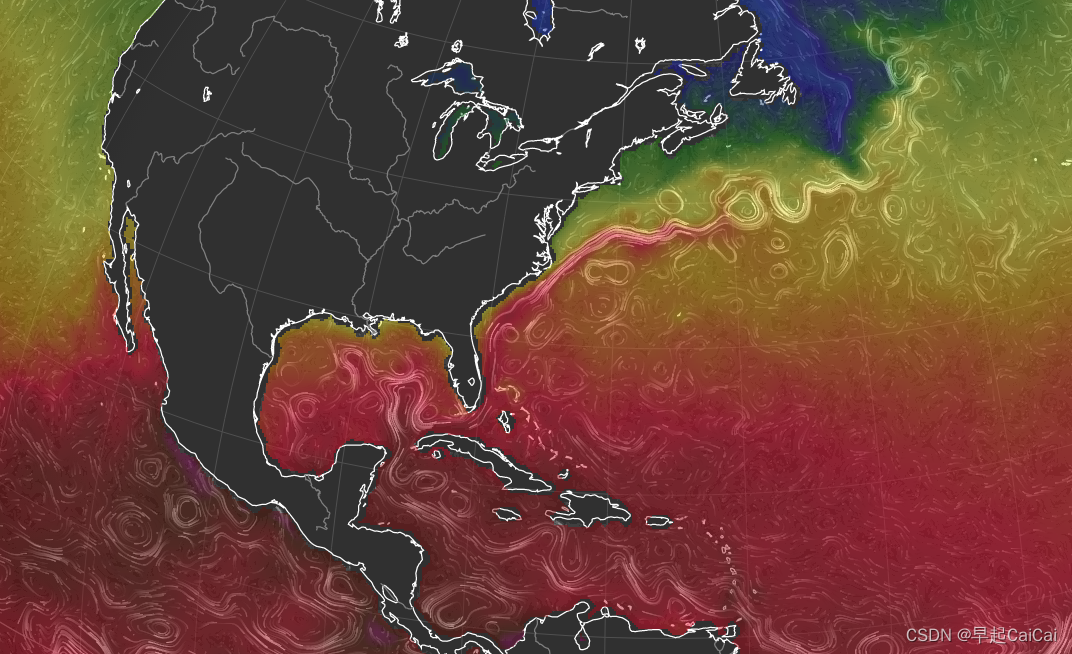
墨西哥湾流和黑潮分别是北半球两支强大的西边界流,墨西哥湾流的流速还要强于黑潮,也是温盐环流的重要组成部分。
引入涡度的概念,将涡度分为两个部分:
- 1、行星涡度,记为 f f f,与地球自转有关,纬度越高行星涡度越大,
- 2、相对涡度,记为 ζ \zeta ζ,逆时针旋转为正涡度,顺时针旋转为负涡度。
位涡守恒:正压理想流体满足
d
d
t
(
f
+
ζ
H
)
=
0
\frac{d}{d t}\left(\frac{f+\zeta}{H}\right)=0
dtd(Hf+ζ)=0,其中
H
H
H表示流体柱高度。
在流体柱高度即水深不变的情况下,简化为
d
f
d
t
+
d
ζ
d
t
=
0
\frac{d f}{d t}+\frac{d \zeta}{d t}=0
dtdf+dtdζ=0
赤道盛行东风,中纬盛行西风,风生环流顺时针旋转,相对涡度为负。
在东边界,洋流向低纬,行星涡度 f f f减小,则风生环流涡度 ζ \zeta ζ必须增加,产生一个逆时针的环流抵消原本顺时针的环流,故东边界洋流速度减小。
在西边界,洋流向高纬,行星涡度 f f f增大,则风生环流涡度 ζ \zeta ζ必须减小,产生一个顺时针的环流增强原本顺时针的环流,故西边界洋流速度增大。

旋转效应下独有的西边界流强化的现象,又由于连续方程被约束在狭窄的通道内,于是就有了这么一条流速可高达2 m/s,相当于全世界河流总流量x十倍的物质流。
海表面温度的快照
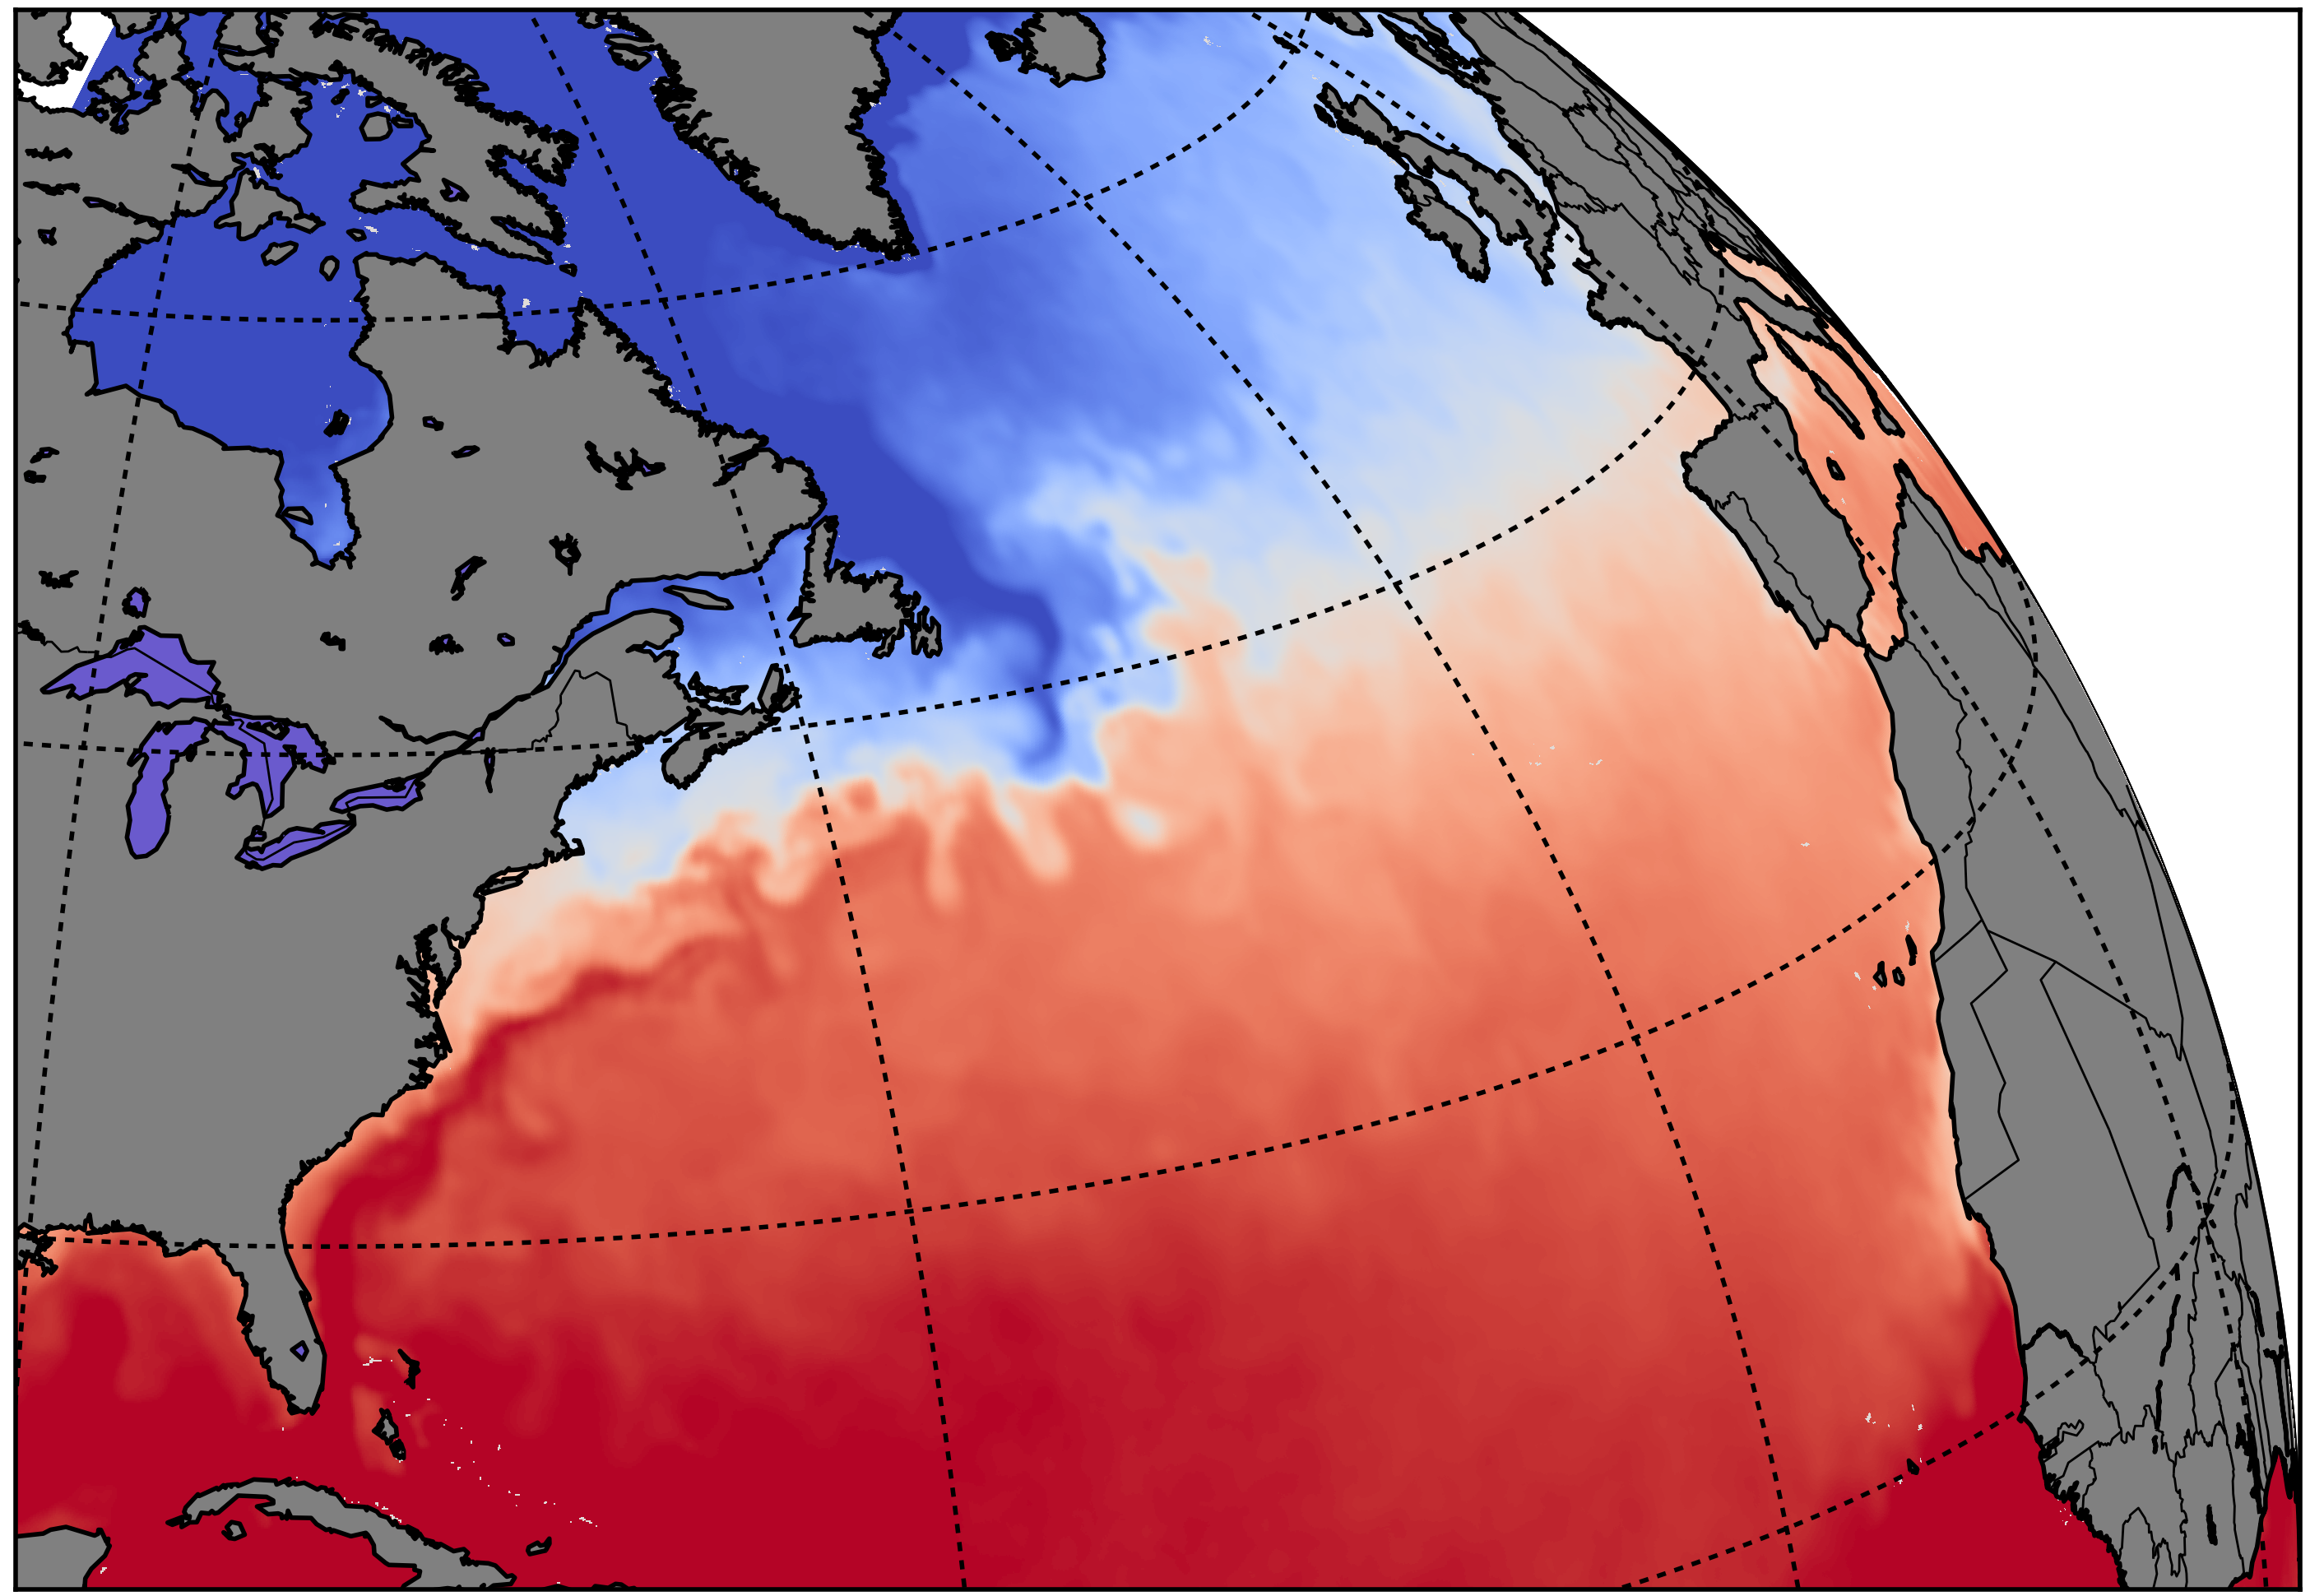
上图为墨西哥湾海表面温度的快照
# This script takes sea-surface temperature data from Oct 27th 2017 and makes a nice plot. The data is high-resolution satellite data.
# 9点的快照

from netCDF4 import Dataset
import numpy as np
import matplotlib.pyplot as plt

from mpl_toolkits.basemap import Basemap

########## 导入数据 ##########
# 注意在这里使用的是ECMWF的海表面温度
# 经度是0-360,0度开始于英国本初子午线
data = Dataset('data/20171027_9.nc')

# get SST data into a numpy array
sst = np.squeeze( np.asarray( data.variables['sst'] ) )

# get lon and lat vectors
lon = np.asarray( data.variables['longitude'] )
lat = np.asarray( data.variables['latitude'] )

# extract the North Atlantic region
# 显示范围
lonMap, latMap = 270, 20    # lower left corner of region
w, h = 120, 80          # width and height of region in degrees

lon0, lat0 = lonMap-10, latMap-20  # coordinates to extract SST values
# 由于倾斜所以这个范围要显示更大

sst = sst[ (lat>lat0) & (lat<lat0+h), : ]
sst = sst[ :, (lon>lon0) & (lon<lon0+w) ]

lon = lon[ (lon>lon0) & (lon<lon0+w) ]
lat = lat[ (lat>lat0) & (lat<lat0+h) ]

# land values are represented by a large negative number; modify these to NaNs
sst[ sst < 0 ] = 290

########## Construct a basemap instance ##########

fig = plt.figure( figsize=(12,6) )
# ax = fig.add_axes( [0.1,0.1,0.8,0.8], axisbg='white' )
ax = fig.add_axes( [0.1,0.1,0.8,0.8])

# make an initial map  # 显示中心的位置
m0 = Basemap(projection='ortho',lon_0=lonMap+30,lat_0=latMap,resolution=None)

# make a map viewing the edge of the earth
myMap = Basemap( projection='ortho', lon_0=lonMap+10, lat_0=latMap, resolution='l',
            llcrnrx=-1e6,llcrnry=0.,urcrnrx=m0.urcrnrx/(2.),urcrnry=m0.urcrnry/(2.5))

# add details
myMap.drawcoastlines()
myMap.drawmapboundary(fill_color='aqua')
myMap.fillcontinents(color='grey',lake_color='slateblue')
myMap.drawcountries()
myMap.drawparallels( np.arange(-90.,120.,15.), labels=[1,0,0,0] )
myMap.drawmeridians( np.arange(0.,360.,30.), labels=[0,0,0,1] )
myMap.drawmapboundary()


########## Plotting ##########

# get projection coordinates from lat and lon
lon, lat = np.meshgrid( lon, lat )
x, y = myMap( lon, lat )

# plot SST contours
myMap.pcolor( x, y, sst - 273.15, cmap='coolwarm', vmin=5, vmax=28 )

plt.title("Sea-Surface Temperature on 9:00 27/10/2017")

# add a colorbar
cBar = plt.colorbar()
cBar.set_label('Temperature ($^\circ$C)')
cBar.set_ticks( [5,10,15,20,25,28] )
cBar.set_ticklabels( ['<5.0','10.0','15.0','20.0','25.0','>28.0'] )

#plt.savefig( 'test.png', format='png', dpi=400 )
plt.show()
这段代码是一个从2017年10月27日获取高分辨率卫星海表温度数据,并生成一个漂亮的图形的脚本。代码中使用了NetCDF4库来导入海表温度数据,使用了NumPy库进行数据处理和数组操作,以及使用了Matplotlib库和Basemap模块来进行绘图和地图投影。
代码的主要步骤如下:
-
导入所需的库:从NetCDF4库中导入Dataset类,从NumPy库中导入numpy模块,从Matplotlib库中导入pyplot模块,从Basemap模块中导入Basemap类。
-
导入数据:使用Dataset类打开一个NetCDF文件,并将海表温度数据(‘sst’)以numpy数组的形式读取出来。同时获取经度(‘longitude’)和纬度(‘latitude’)的向量数据。
-
提取感兴趣的区域:根据指定的经纬度范围,从整个数据集中提取出所需的区域和相应的经纬度数据。同时将陆地上的数值修改为NaN。
-
构建Basemap实例:创建一个图形,并在图形上添加一个Axes对象。使用Basemap类创建两个地图实例,一个是初始的地图(projection=‘ortho’),另一个是显示特定区域的地图。
-
添加地图细节:在显示特定区域的地图上添加海岸线、地图边界、陆地填充、国家边界以及纬度和经度线。
-
绘图:根据经纬度数据,将其转换为投影坐标,并使用pcolor方法绘制海表温度数据的等值线图。
-
添加标题和颜色条:为图形添加标题,并使用colorbar方法添加颜色条,以显示温度的范围和相应的标签。
-
显示图形:使用show方法显示生成的图形。
这段代码的目标是生成一个展示2017年10月27日9点海表温度数据的图形,并使用颜色条表示温度范围。图形展示了北大西洋地区的海表温度,以及周围的地理特征和地图投影效果。
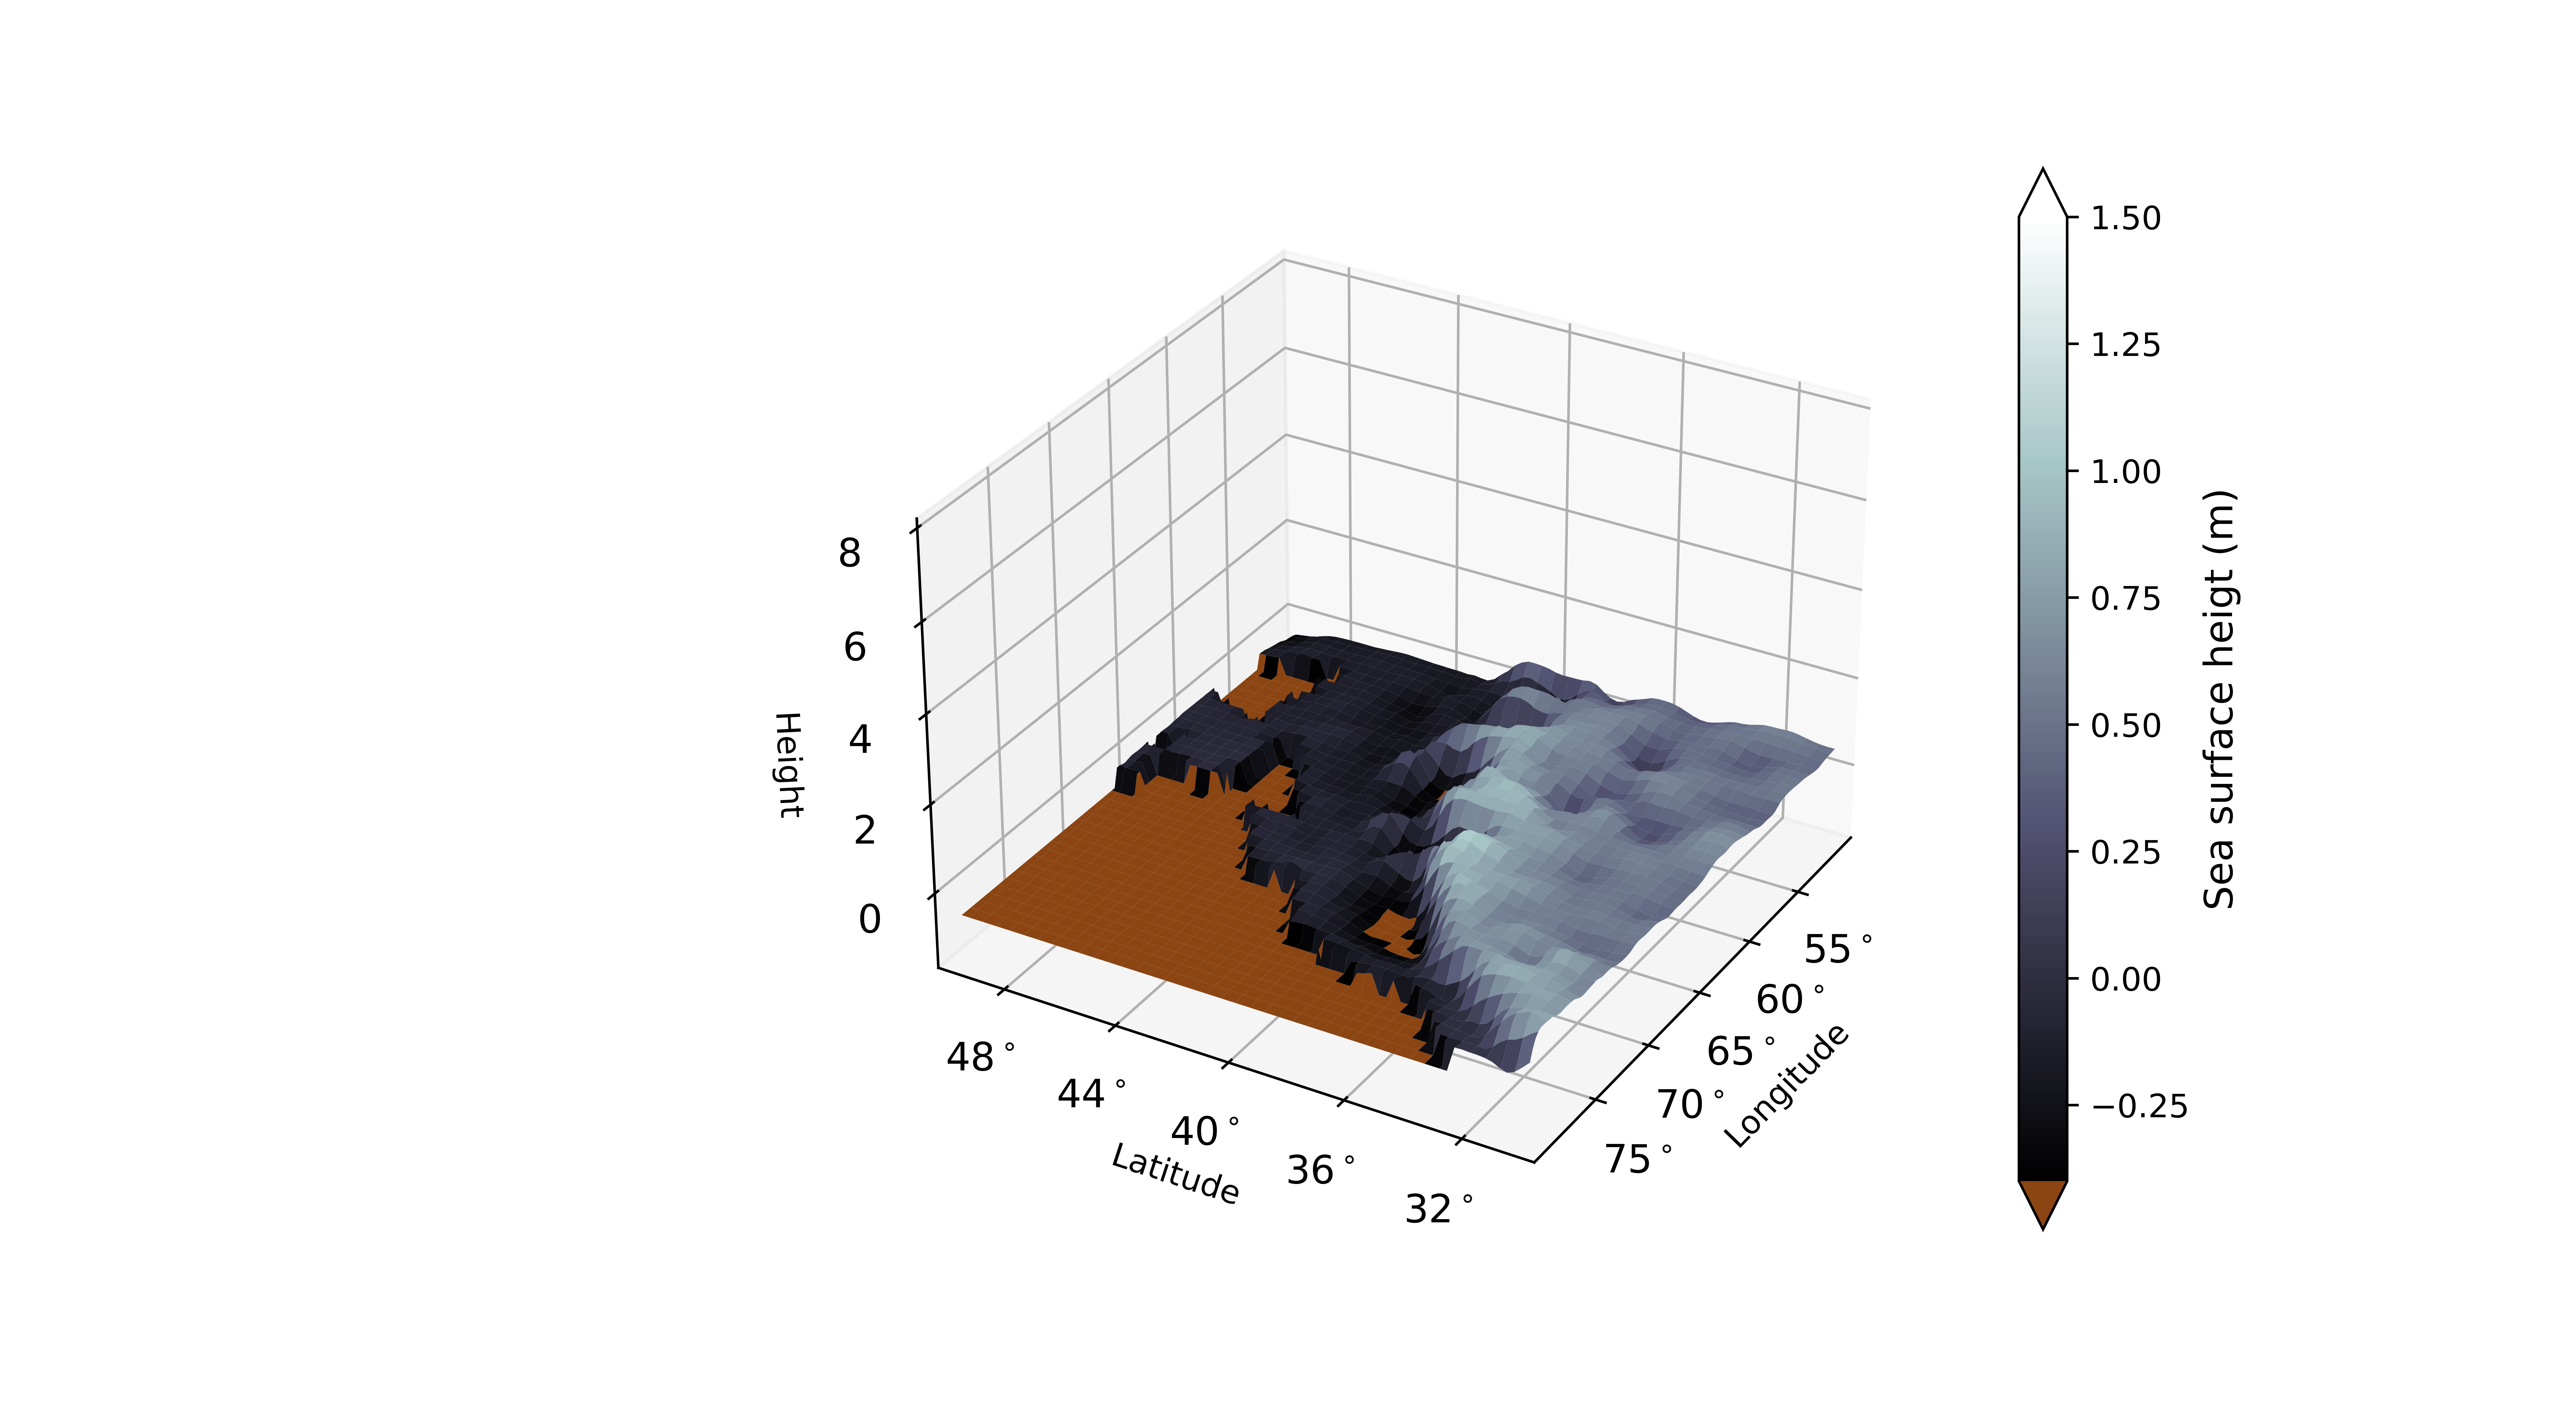
地形3D图
# This script takes a snapshot of sea-surface height and makes a
# 3D visualisation of the data.
import matplotlib

import numpy as np
import matplotlib.pyplot as plt
import scipy.io as sio
import pandas as pd

from mpl_toolkits.mplot3d import Axes3D
from matplotlib import cm

########## Prepare data ##########

# load data
adt = np.transpose( sio.loadmat('data/adt.mat')['adt_all'], (1,0,2) )

# choose day to visualise
t0 = 100
snapshot = np.squeeze( adt[:,:,t0] )

# change land values
adt[ np.isnan( adt ) ] = -0.5

# define lon and lat
lon, lat = np.linspace(-80,-50,121), np.linspace(30,50,81)
lon, lat = np.meshgrid( lon, lat )

########## Plotting #########

fig = plt.figure( figsize=(11,6) )
ax3D = fig.add_subplot( 111, projection='3d' )

# make custom palette
cMap = cm.bone
cMap.set_under( 'saddlebrown' )

# draw surface
surf3D = ax3D.plot_surface( lon[:-1,:-1], lat[:-1,:-1], snapshot, cmap=cMap, vmin=-0.4, vmax=1.5 )

# tidy up
ax3D.set_zlim( (-1.5,8) )
ax3D.set_xlim( (-80,-50) )
ax3D.set_ylim( (30,50) )

ax3D.set_xticks( [-75,-70,-65,-60,-55] )
ax3D.set_xticklabels( ['75$^\circ$','70$^\circ$','65$^\circ$','60$^\circ$','55$^\circ$'] )
ax3D.set_yticks( [32,36,40,44,48] )
ax3D.set_yticklabels( ['32$^\circ$','36$^\circ$','40$^\circ$','44$^\circ$','48$^\circ$'])

ax3D.xaxis.set_tick_params( labelsize=12 )
ax3D.yaxis.set_tick_params( labelsize=12 )
ax3D.zaxis.set_tick_params( labelsize=12 )

ax3D.set_ylabel('Latitude')
ax3D.set_xlabel('Longitude')
ax3D.set_zlabel('Height')

# add colorbar
cBar = fig.colorbar( surf3D, extend='both' )
cBar.set_label('Sea surface heigt (m)', fontsize=12 )

# change 'camera' position
ax3D.view_init( elev=30, azim=-150 )

plt.savefig( 'gulfStreamSSH3D_snapshot.png', format='png', dpi=800 )

plt.show()
这个 Python 脚本创建了一个海表面高度数据的 3D 可视化。以下是代码的具体步骤:
- 导入所需的模块:
matplotlib、numpy、scipy.io、pandas和mpl_toolkits.mplot3d中的Axes3D。 - 使用
scipy.io模块的loadmat()函数从 .mat 文件中加载海表面高度数据。transpose()函数用于交换数据数组的维度顺序。 - 选择要可视化的数据快照。
- 将数据数组中的任何
NaN值替换为-0.5。 - 使用
numpy的linspace()和meshgrid()函数定义数据网格的经度和纬度值。 - 创建一个具有 3D 坐标轴的新图形,使用
fig.add_subplot()函数并设置projection='3d'参数。 - 使用
cm.bone设置自定义颜色映射,并使用set_under()和vmin、vmax参数设置颜色映射的最小和最大值。 - 使用
plot_surface()函数绘制数据的表面,将lon、lat和snapshot数据数组作为参数。 - 使用
set_xlim()、set_ylim()、set_zlim()、set_xticks()、set_yticks()、set_xticklabels()和set_yticklabels()设置 x、y 和 z 轴的限制和标签。 - 使用
colorbar()为图形添加颜色条。 - 使用
set_label()设置颜色条和 z 轴的标签。 - 使用
view_init()更改 3D 绘图的视角。 - 使用
savefig()将图形保存为 PNG 图像。 - 使用
show()显示图形。
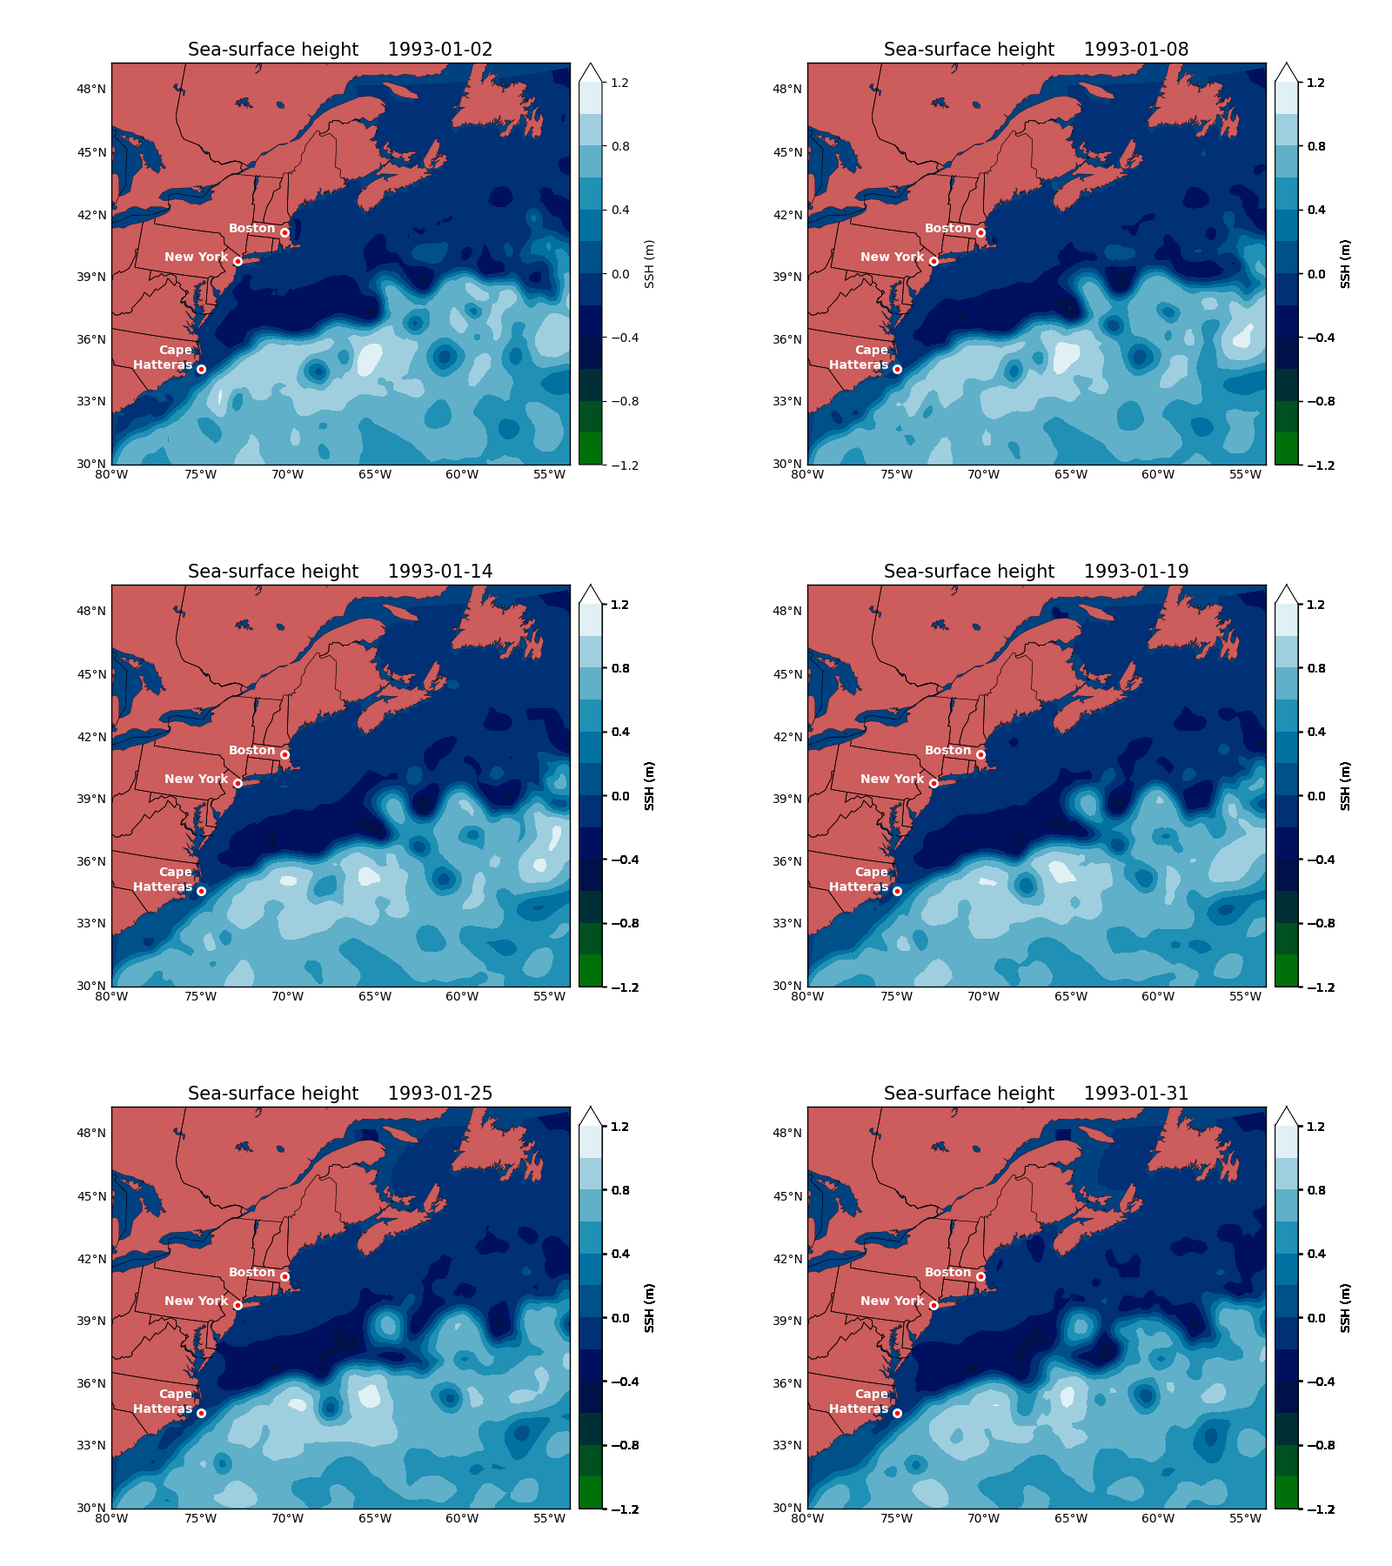
海表面高度的GIF图
# This script takes absolute dynamic topography (ADT) satellite altimetry data from
# the Gulf Stream region, and produces an animation from the daily 2D snapshots.

import matplotlib
import matplotlib as mpl
matplotlib.use('TkAgg')
# matplotlib.use("Agg")

import numpy as np
import matplotlib.pyplot as plt
import scipy.io as sio
import pandas as pd

from mpl_toolkits.basemap import Basemap
from matplotlib.cm import get_cmap
import matplotlib.animation as manimation

# uncomment this line if you want to see the plots as they are saved
#plt.ion()

# load data
adt = np.transpose( sio.loadmat('data/adt.mat')['adt_all'], (1,0,2) )
# 转换 经度 纬度

########## Make a basemap instance ##########

cMap = get_cmap('ocean')
lakeColor = cMap(0.5)

fig = plt.figure( figsize=(8,6) )

# set up orthographic map projection with perspective of satellite looking down at 40N, 65W.
map = Basemap( projection='stere', lat_0=40, lon_0=-65, resolution='l', llcrnrlon=-80, llcrnrlat=30., urcrnrlon=-50, urcrnrlat=50, suppress_ticks=True )

# get projections of lon and lat in axis coordinates
lon, lat = np.linspace( -80, -50, num=121 ), np.linspace( 30, 50, num=81 )
lonGrid, latGrid = np.meshgrid( lon, lat )
x, y = map( lonGrid, latGrid )

# get projections for various places  单独的几个城市
xNY, yNY = map( -74.00, 40.71 )     # New York
xCH, yCH = map( -75.54, 35.25 )     # Cape Hatteras
xB, yB = map( -71.06, 42.36 )       # Boston

# define ADT spacings for contourf function and the datelist for title
adtSpacings = np.linspace( -1.2, 1.2, num=13 )
dateList = pd.date_range( '1993-01-01', periods=adt.shape[2], freq='D' ).tolist()


########## Make video ##########

FFMpegWriter = manimation.writers['ffmpeg']
metadata = dict( title='Gulf Stream SSH', artist='Tom Bolton', comment='Gulf Stream Visualization of AVISO ADT data.' )
writer = FFMpegWriter( fps=24, metadata=metadata, bitrate=30000, codec='libx264' )

with writer.saving( fig, "gulfStreamSSH_b.gif", 100 ) :

    for t in range(1, 31, 1):  # t 时间维度

        print(t)

        # draw coastlines, country boundaries, fill continents.
        map.drawcoastlines(linewidth=0.25)
        map.fillcontinents(color='indianred', lake_color=lakeColor)

        # add lon and lat axis labels
        map.drawparallels(np.arange(30, 50, 3), labels=[1, 0, 0, 0], linewidth=0.0)
        map.drawmeridians(np.arange(-80, -50, 5), labels=[0, 0, 0, 1], linewidth=0.0)

        # draw the edge of the map projection region (the projection limb)
        map.drawmapboundary(fill_color=lakeColor)
        map.drawstates()
        map.drawcountries()

        # make a string for the date
        titleString = str(dateList[t])
        titleString = titleString[0:10]

        # plot the sea-surface height contours
        cf = map.contourf(x[:-1, :-1], y[:-1, :-1], adt[:, :, t], levels=adtSpacings, extend='max',
                          cmap='ocean', vmin=adtSpacings[0], vmax=adtSpacings[-1] )

        # if SSH value goes over the max level, make this appear as white
        # cmap = mpl.cm.get_cmap("ocean").copy()
        # cf.cmap.set_over('white')

        # add colorbar
        cbar = map.colorbar( cf, location='right' )
        cbar.set_label('SSH (m)')

        # plot title
        plt.title( "Sea-surface height     " + titleString, fontsize=15 )

        # annotate New York
        plt.text( xNY-50000, yNY, 'New York', ha='right', color='white', fontweight='bold' )
        plt.plot( xNY, yNY, 'o', mfc='red', mec='white', mew=2 )

        # annotate Cape Hatteras
        plt.text(xCH - 50000, yCH, 'Cape\n Hatteras', ha='right', color='white', fontweight='bold')
        plt.plot(xCH, yCH, 'o', mfc='red', mec='white', mew=2)

        # annotate Boston
        plt.text(xB - 50000, yB, 'Boston', ha='right', color='white', fontweight='bold')
        plt.plot(xB, yB, 'o', mfc='red', mec='white', mew=2)

        # save this figure as a frame
        plt.pause(0.1)
        writer.grab_frame()

        # clear the axis data so it doesn't accumulate
        plt.cla()
这个 Python 脚本从海洋中心的绝对动态地形(Absolute Dynamic Topography,ADT)卫星高度计数据中,生成每日 2D 快照的动画。
以下是代码的具体步骤:
- 导入所需的模块:
matplotlib、numpy、scipy.io、pandas、Basemap和animation中的FFMpegWriter。 - 加载数据。使用
scipy.io模块的loadmat()函数从 .mat 文件中加载海表面高度数据。使用transpose()函数将数据数组的维度顺序进行转换。 - 创建一个
Basemap实例,设置地图投影方式、中心点、边界、分辨率等参数,并获取经度和纬度在轴坐标系中的投影。 - 定义 ADT 间距和日期列表以用于标题。
- 创建一个
FFMpegWriter实例,设置输出视频的参数,包括帧率、元数据、比特率和编解码器。 - 在
writer.saving()中使用grab_frame()函数和writer对象来保存视频。 - 在每个时间步骤中,绘制海岸线、国界线和大陆,添加经度和纬度轴标签,绘制地图边界、州界和国界等。
- 将当前时间步骤的日期转换为字符串格式,并将其用作标题的一部分。
- 使用
contourf()函数绘制 ADT 数据的海表面高度轮廓,设置轮廓线的间距和颜色映射。 - 添加颜色条,并设置其标签。
- 标注三个城市(纽约、哈特角和波士顿),并在地图上绘制它们的位置。
- 保存当前帧,并清除坐标轴数据以避免积累。
值得注意的是,此脚本生成的视频需要依赖第三方库 ffmpeg,需要先安装该库才能运行脚本。
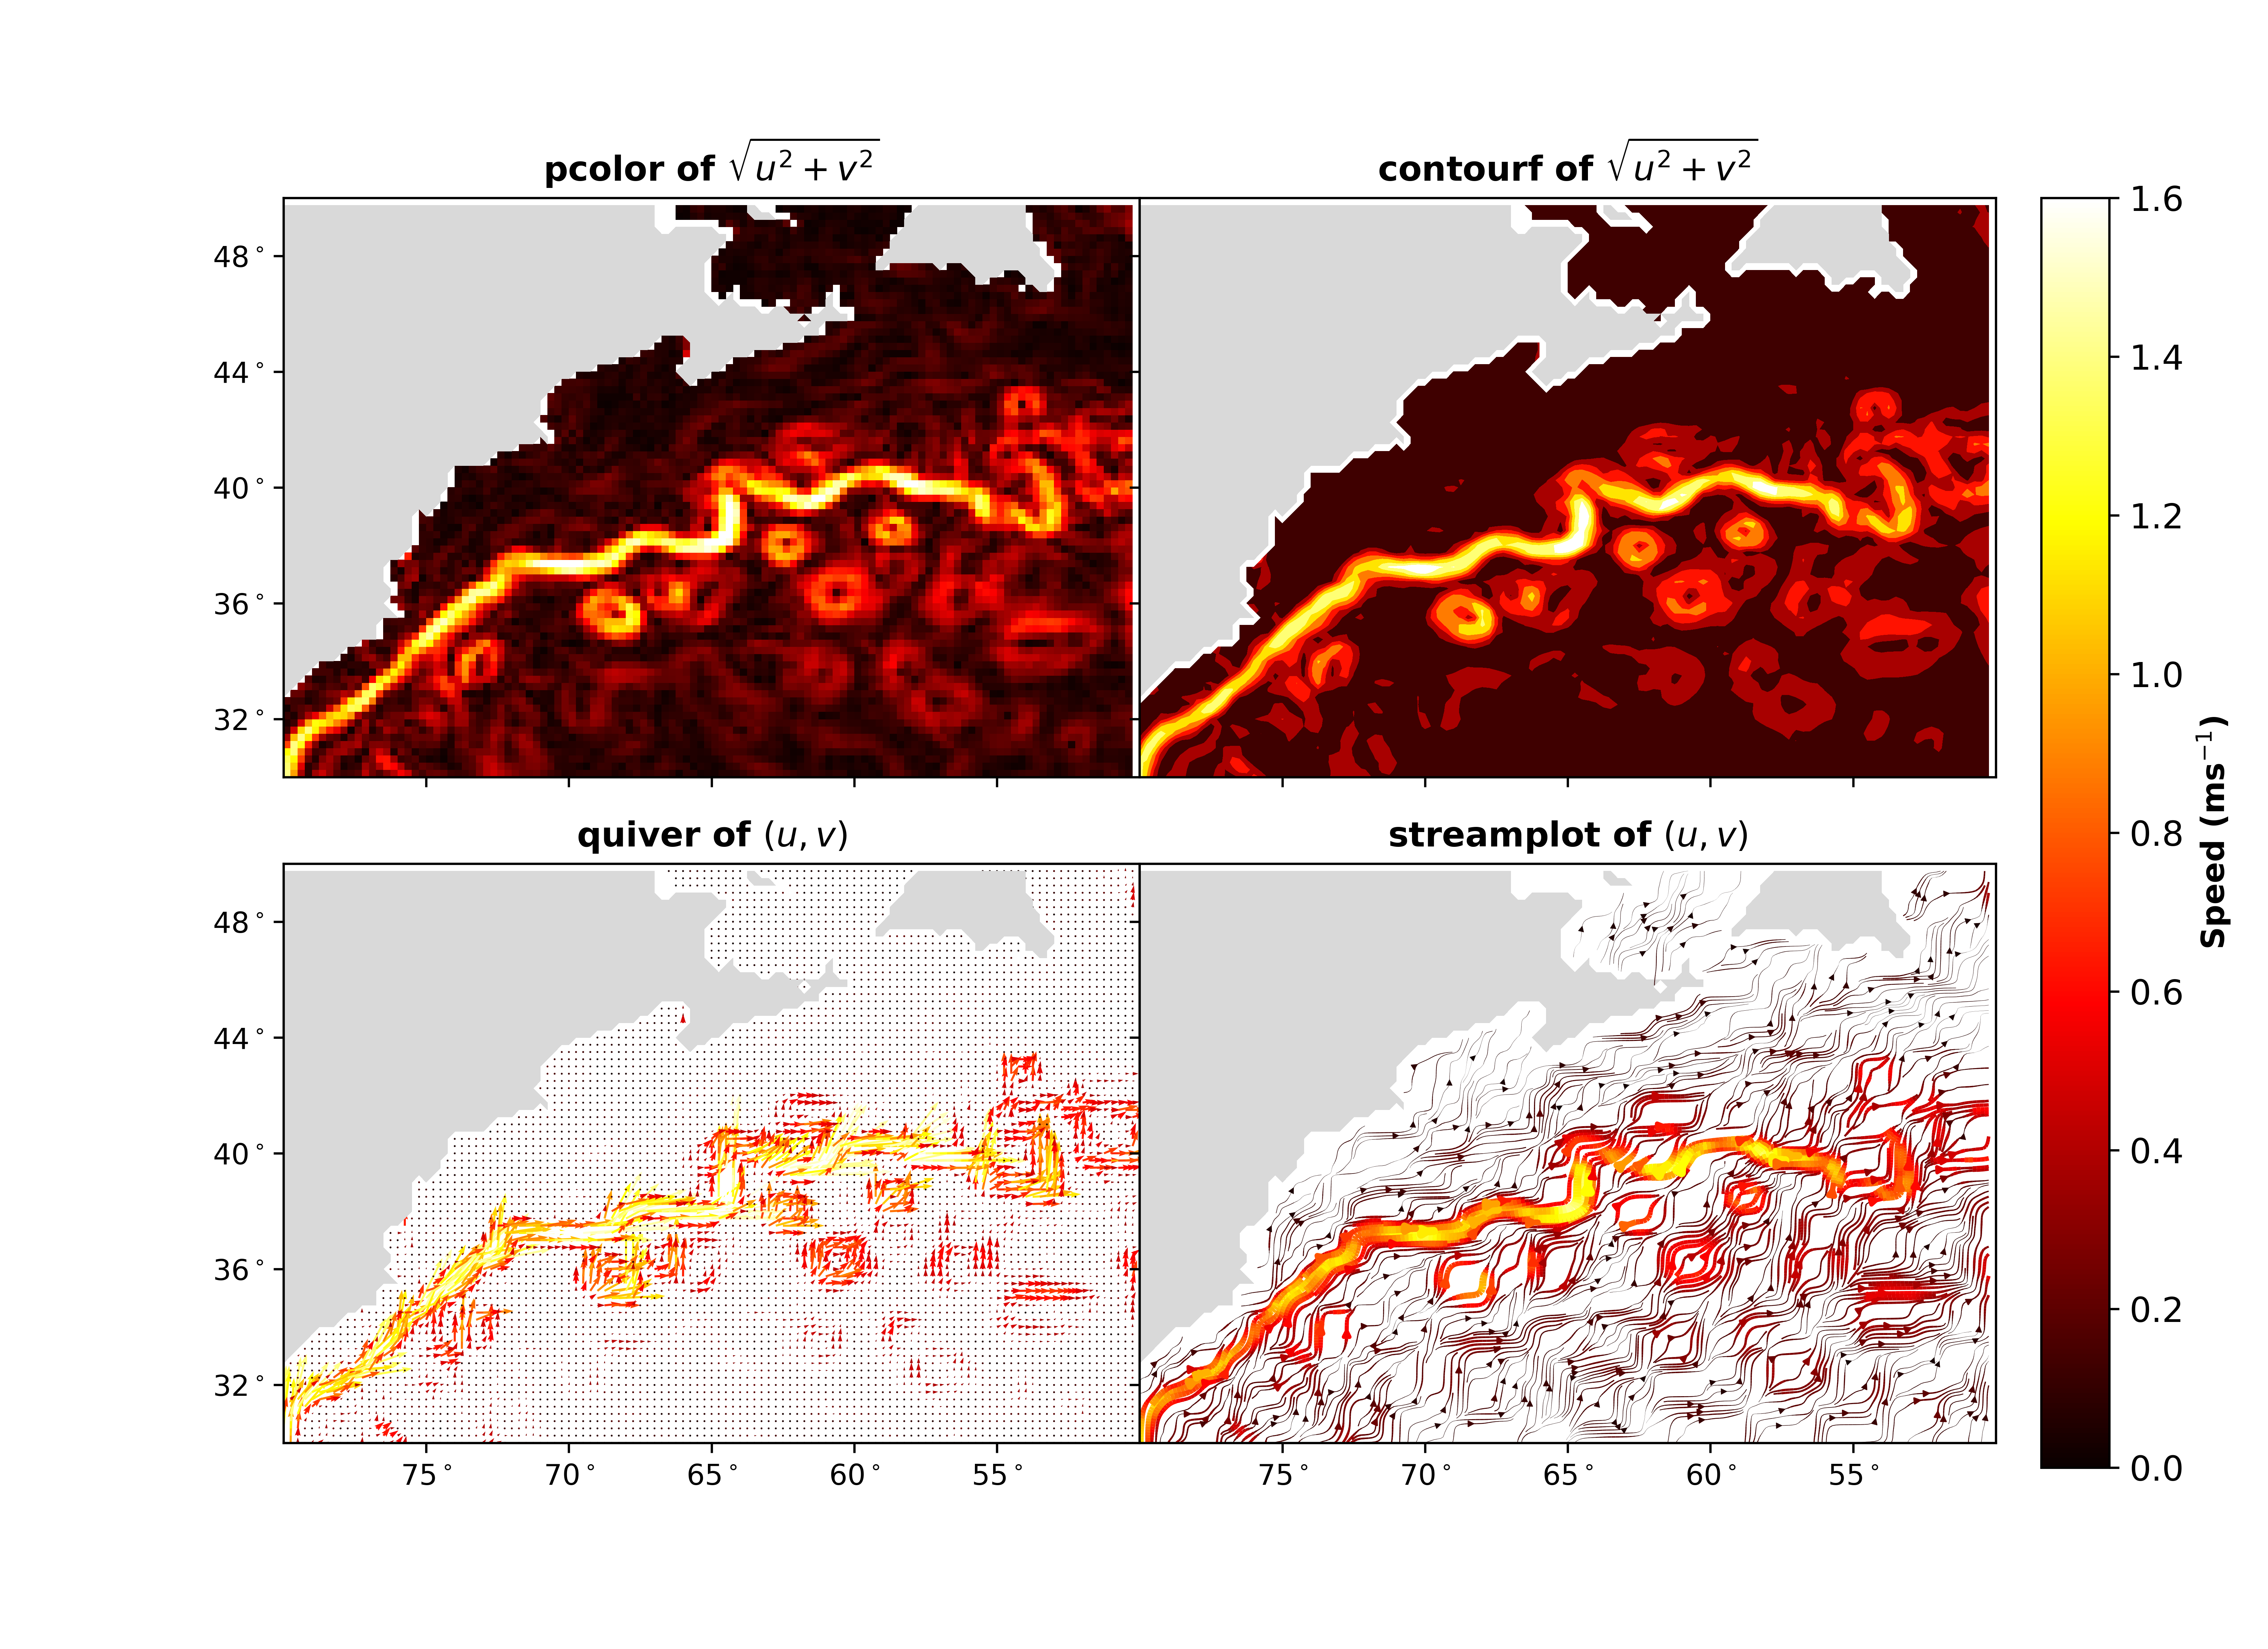
流场的快照
# This script takes velocity data from within the Gulf Stream and makes
# a stream plot.

import numpy as np
import matplotlib.pyplot as plt
import scipy.io as sio


########## Prepare data ##########

data = sio.loadmat('data/uv.mat')

u = np.transpose( data['u_all'], (1,0,2) )
v = np.transpose( data['v_all'], (1,0,2) )

lon, lat = np.linspace( -80, -50, 121 ), np.linspace( 30, 50, 81 )

lon1 = lon[:-1]
lat1 = lat[:-1]

speed = np.sqrt( np.square( u, u ) + np.square( v, v ) )

# make a land mask (from nan values)
landMask = np.squeeze( speed[:,:,100] )
landMask[ ~np.isnan( landMask ) ] = 0
landMask[ np.isnan( landMask ) ] = 1
landMask[ landMask == 0 ] = np.nan

lonGrid, latGrid = np.meshgrid( lon1, lat1 )

#lonLand, latLand = lonGrid[ np.isnan( landMask ) ], latGrid[ np.isnan( landMask ) ]
#land = landMask[ np.isnan( landMask ) ]
#land = 1

########## Plotting ##########

# prepare subplots
fig, axArr = plt.subplots(2,2, sharex=True, sharey=True )
fig.set_size_inches( (11,8) )

# sub-sampling rate for quiver
n=1

# choose which day to plot
t0 = 1

# use each method
im0 = axArr[0,0].pcolor( lon[:-1], lat[:-1], speed[:,:,t0], cmap='hot', vmin=0, vmax=1.6 )
im1 = axArr[0,1].contourf( lon[:-1], lat[:-1], speed[:,:,t0], cmap='hot', vmin=0, vmax=1.6 )
im2 = axArr[1,0].quiver( lon1[::n], lat1[::n], u[::n,::n,t0], v[::n,::n,t0], speed[::n,::n,t0], cmap='hot', clim=(0,1.6) )
im3 = axArr[1,1].streamplot( lon[:-1], lat[:-1], u[:,:,t0], v[:,:,t0], color=speed[:,:,t0],
                             density=[7,7], cmap='hot', linewidth=2*speed[:,:,t0], arrowsize=0.5 )

# add land to each plot
axArr[0,0].contourf( lonGrid, latGrid, landMask, cmap='Greys' )
axArr[0,1].contourf( lonGrid, latGrid, landMask, cmap='Greys' )
axArr[1,0].contourf( lonGrid, latGrid, landMask, cmap='Greys' )
axArr[1,1].contourf( lonGrid, latGrid, landMask, cmap='Greys' )

# polish each plot
axArr[0,0].set_ylim( (30,50) )
axArr[0,1].set_ylim( (30,50) )
axArr[1,0].set_ylim( (30,50) )
axArr[1,1].set_ylim( (30,50) )

axArr[0,0].set_xlim( (-80,-50) )
axArr[0,1].set_xlim( (-80,-50) )
axArr[1,0].set_xlim( (-80,-50) )
axArr[1,1].set_xlim( (-80,-50) )

axArr[0,0].set_title( 'pcolor of $\sqrt{u^2+v^2}$', weight='bold' )
axArr[0,1].set_title( 'contourf of $\sqrt{u^2+v^2}$', weight='bold' )
axArr[1,0].set_title( 'quiver of $(u,v)$', weight='bold' )
axArr[1,1].set_title( 'streamplot of $(u,v)$', weight='bold' )

axArr[0,0].set_yticks( [32,36,40,44,48] )
axArr[1,0].set_yticks( [32,36,40,44,48] )

axArr[0,0].set_yticklabels( ['32$^\circ$','36$^\circ$','40$^\circ$','44$^\circ$','48$^\circ$'])
axArr[1,0].set_yticklabels( ['32$^\circ$','36$^\circ$','40$^\circ$','44$^\circ$','48$^\circ$'])

axArr[1,0].set_xticks( [-75,-70,-65,-60,-55] )
axArr[1,1].set_xticks( [-75,-70,-65,-60,-55] )

axArr[1,0].set_xticklabels( ['75$^\circ$','70$^\circ$','65$^\circ$','60$^\circ$','55$^\circ$'])
axArr[1,1].set_xticklabels( ['75$^\circ$','70$^\circ$','65$^\circ$','60$^\circ$','55$^\circ$'])

# adjust spacing and add colorbar
plt.subplots_adjust( wspace=0, hspace=0.15 )
plt.subplots_adjust( right=0.88 )

cbarAx = fig.add_axes( [0.9,0.11,0.03,0.77] )
cbar = fig.colorbar( im0, cax=cbarAx )
cbar.set_label('Speed (ms$^{-1}$)', weight='bold', fontsize=11 )
cbar.ax.tick_params( labelsize=12 )

# save the figure
plt.savefig( 'gulfStreamUV_snapshots.png', format='png', dpi=600 )

plt.show()
这是一个Python脚本,它从文件中加载速度数据,创建并保存数据的图形,并显示该图形。
脚本首先导入必要的模块:numpy(用于数值操作)、matplotlib.pyplot(用于绘图)和scipy.io(用于从MATLAB格式的文件中加载数据)。
接下来,脚本使用scipy.io中的loadmat函数从一个名为uv.mat的文件中加载数据。从data中提取了u和v数组,并对它们的维度进行了转置。
使用np.linspace创建了数组lon和lat,然后使用u和v计算出了speed。使用speed中的nan值创建了一个landMask。
使用axArr创建了四个子图,形成一个2x2的子图数组。前两个图使用pcolor和contourf绘制speed。第三个图使用quiver绘制u和v的向量,第四个图使用streamplot绘制u和v的流线。
使用contourf添加了一个共同的陆地蒙版到每个子图中,使用各种set_和tick_方法对子图进行了格式化。使用fig.colorbar添加了一个颜色条,并使用plt.savefig将图形保存到文件中。
最后,使用plt.show()显示了图形。
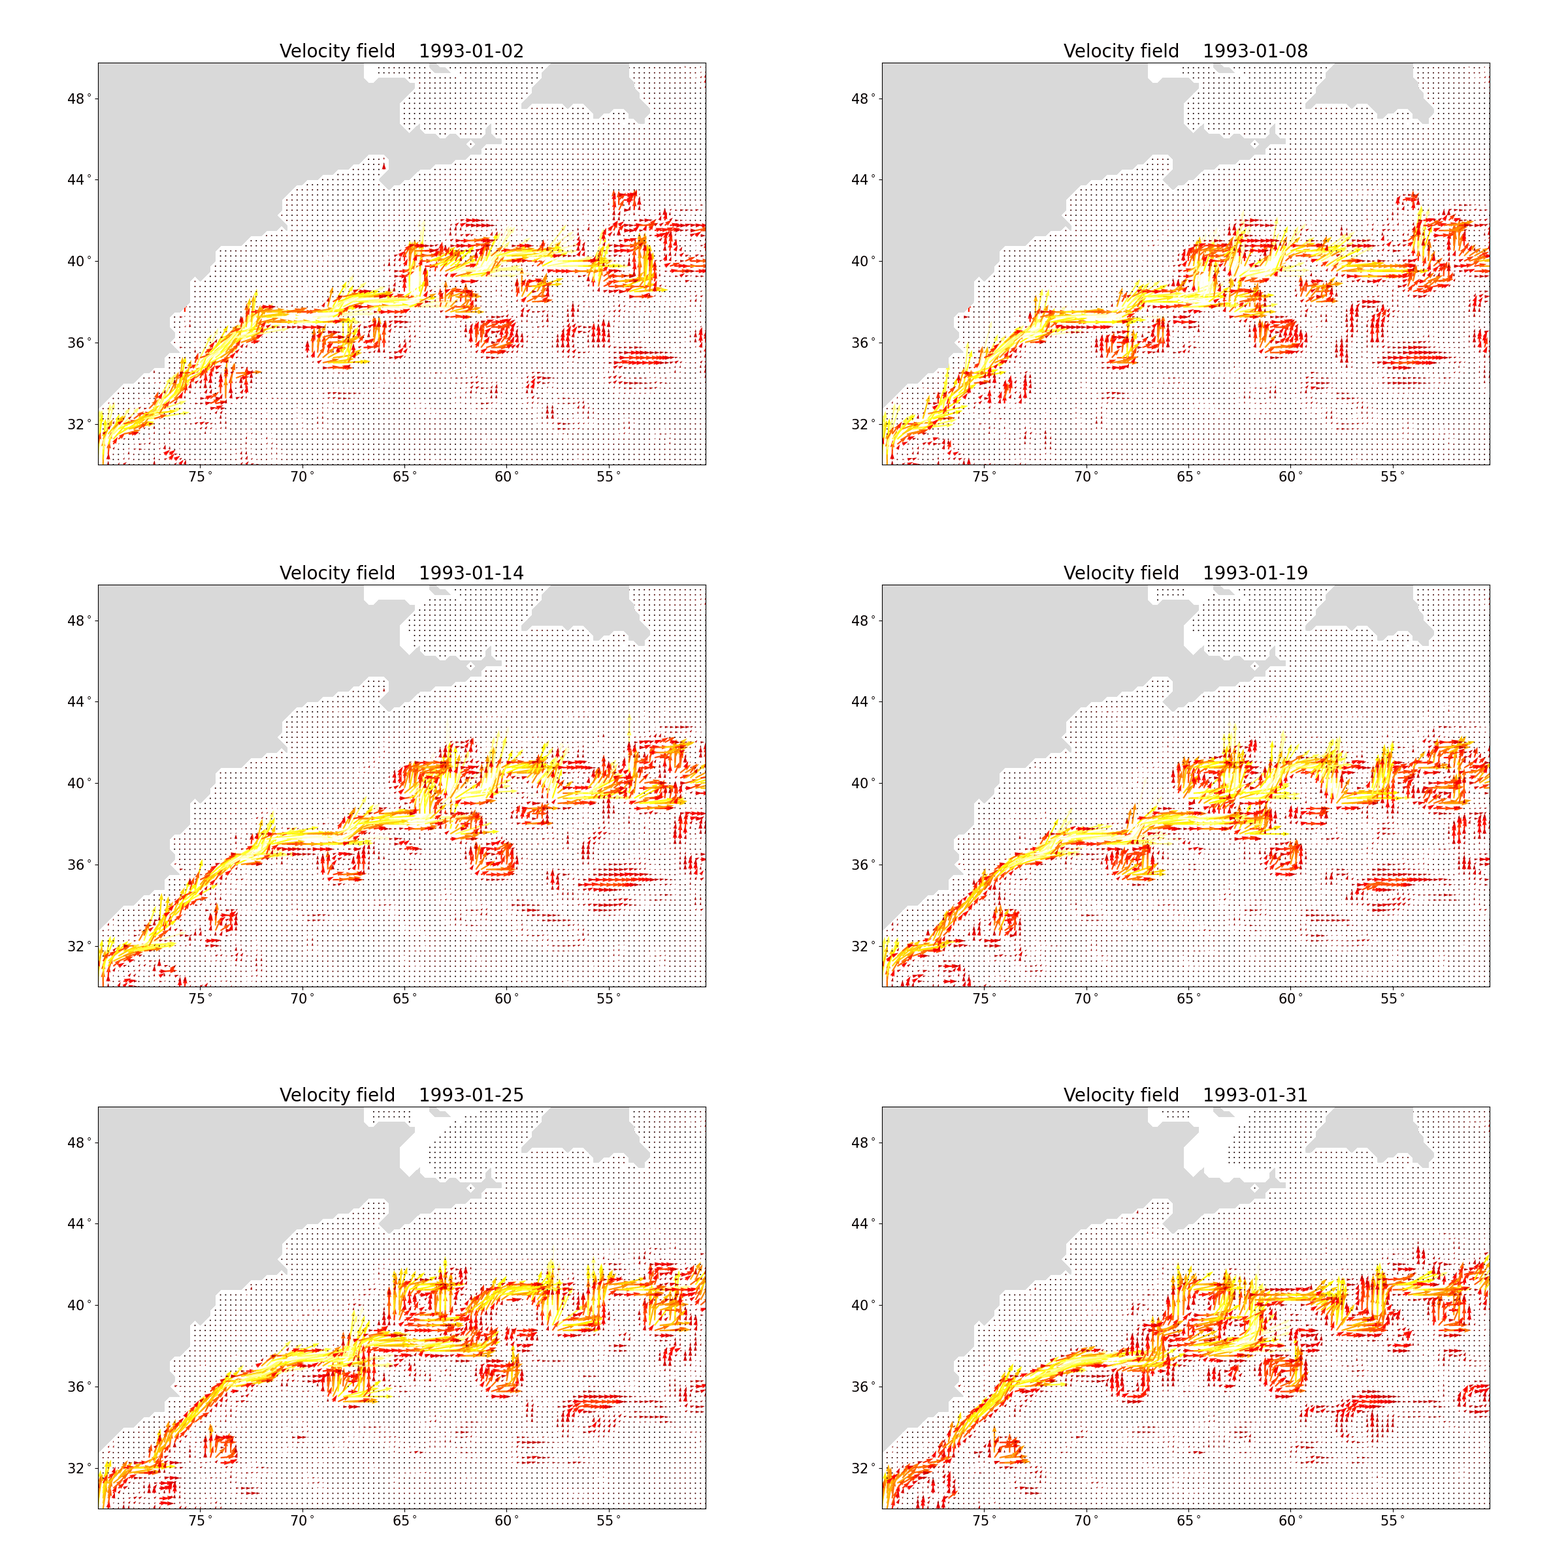
流场的GIF动图
# This script takes velocity data within the Gulf Stream and makes a video of
# of the flow evolving. The data is from AVISO satellite altimetry data.

import matplotlib
matplotlib.use("TkAgg")

import numpy as np
import matplotlib.pyplot as plt
import scipy.io as sio
import pandas as pd

from matplotlib.cm import get_cmap
import matplotlib.animation as manimation

# uncomment this line if you want to see the plots as they are saved
#plt.ion()

########## Prepare data ##########

data = sio.loadmat('data/uv.mat')

u = np.transpose( data['u_all'], (1,0,2) )
v = np.transpose( data['v_all'], (1,0,2) )

lon, lat = np.linspace( -80, -50, 121 ), np.linspace( 30, 50, 81 )

speed = np.sqrt( np.square( u, u ) + np.square( v, v ) )

# make a land mask (from nan values)
landMask = np.squeeze( speed[:,:,100] )
landMask[ ~np.isnan( landMask ) ] = 0
landMask[ np.isnan( landMask ) ] = 1
landMask[ landMask == 0 ] = np.nan

lon1 = lon[:-1]
lat1 = lat[:-1]
lonGrid, latGrid = np.meshgrid( lon1, lat1 )

# define ADT spacings for contourf function and the datelist for title
adtSpacings = np.linspace( -1.2, 1.2, num=13 )
dateList = pd.date_range( '1993-01-01', periods=u.shape[2], freq='D' ).tolist()

########## Make video ##########

fig = plt.figure( figsize=(12,8) )

# quiver sub-sampling
n = 1

FFMpegWriter = manimation.writers['ffmpeg']
metadata = dict( title='Gulf Stream UV', artist='Tom Bolton', comment='Gulf Stream Visualization of AVISO UV data.' )
writer = FFMpegWriter( fps=24, metadata=metadata, bitrate=30000, codec='libx264' )

with writer.saving( fig, "gulfStreamUV.gif", 100 ) :

    for t in range(1, 31, 1):
        print (t)

        # make quiver plt
        plt.quiver( lon1[::n], lat1[::n], u[::n,::n,t], v[::n,::n,t], speed[::n,::n,t], cmap='hot', clim=(0,1.6) )

        # add land
        plt.contourf(lonGrid, latGrid, landMask, cmap='Greys')

        # plot title
        titleString = str(dateList[t])
        titleString = titleString[0:10]
        plt.title( "Velocity field    " + titleString, fontsize=20 )

        # tidy up the axis
        ax = plt.gca()

        ax.set_xticks( [-75,-70,-65,-60,-55] )
        ax.set_xticklabels( ['75$^\circ$', '70$^\circ$', '65$^\circ$', '60$^\circ$', '55$^\circ$' ] )
        plt.xticks( fontsize=15 )

        ax.set_yticks( [32,36,40,44,48] )
        ax.set_yticklabels( ['32$^\circ$','36$^\circ$','40$^\circ$','44$^\circ$','48$^\circ$' ] )
        plt.yticks( fontsize=15 )

        # save this figure as a frame
        plt.pause(0.1)
        writer.grab_frame()

        # clear the axis data so it doesn't accumulate
        plt.cla()
这是一个Python脚本,它从Gulf Stream中获取速度数据并创建一个流动视频。数据来自AVISO卫星高度计数据。
脚本首先导入必要的模块:numpy(用于数值操作)、matplotlib.pyplot(用于绘图)、scipy.io(用于从MATLAB格式的文件中加载数据)、pandas(用于处理日期)和matplotlib.animation(用于创建动画)。
接下来,脚本使用scipy.io中的loadmat函数从一个名为uv.mat的文件中加载数据。从data中提取了u和v数组,并对它们的维度进行了转置。
使用np.linspace创建了数组lon和lat,然后使用u和v计算出了speed。使用speed中的nan值创建了一个landMask。
使用pd.date_range创建了日期列表dateList,并使用np.linspace创建了ADT空间,用于contourf函数。
使用manimation创建了动画,并使用writer.saving将动画保存为gif文件。
在循环中,对于每个时间步长t,创建了一个quiver图,该图显示了速度向量的方向和大小。使用clim参数设置了颜色映射的范围,使其只显示速度小于1.6的值。
使用contourf函数向图中添加了一个共同的陆地蒙版,并使用title函数添加了标题。使用set_xticks和set_yticks函数设置了x和y轴上的刻度值,并使用set_xticklabels和set_yticklabels函数设置了刻度标签。使用fontsize参数设置了标签和标题的字体大小。
使用pause函数暂停了图形的显示,并使用grab_frame函数将当前帧添加到视频中。使用cla函数清除了当前轴中的数据,以便下一帧可以开始。
最后,使用plt.show()显示了图形。
后记
该程序包含了将湾流的卫星数据可视化的python脚本;
包含产生速度场mp4的py程序,海表面高度的py;
下图为程序中对应产生的图

pass: 需要在python 2 的环境下运行

Reference
墨西哥湾流的形成机制是什么?
GitHub - Visualising the Gulf Stream
