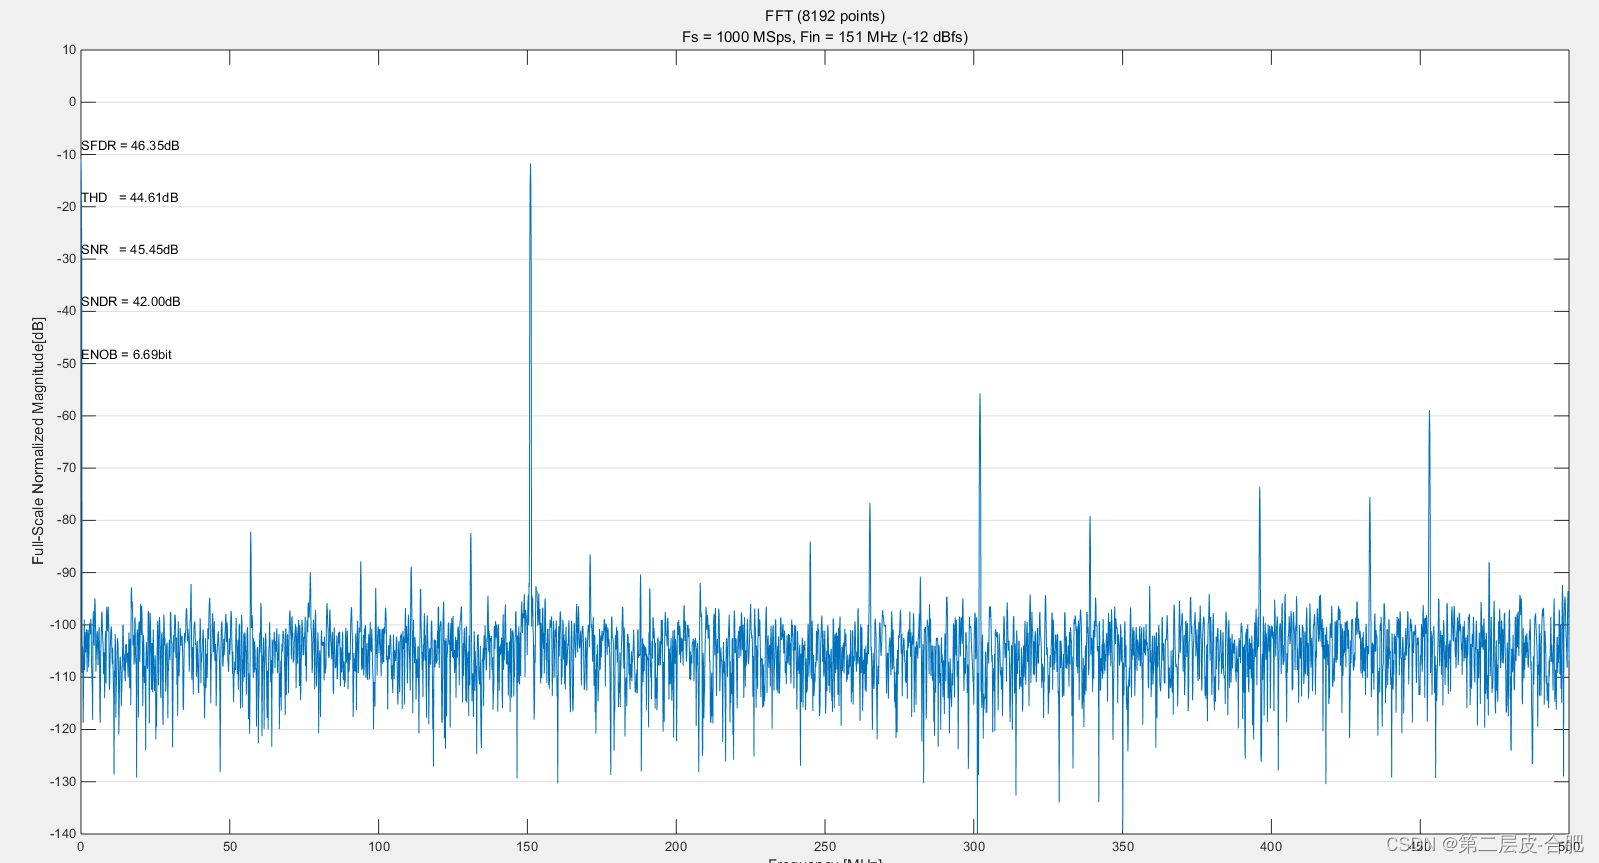
如图,本文主要分享基于matlab的ADC输入数据有效位分析的代码。
fid=fopen('C:\Users\Administrator\Desktop\Test.txt','r');
% numpt=input('Data Record Size (Number of Points)? ');+% fclk=input('Sampling Frequency (MHz)? ');
numpt=16384;
fclk=50;
numbit=14;
[v1]=fscanf(fid,'%f',[1,numpt]);
fclose(fid);
code=v1';
%Display a warning, when the input generates a code greater than full-scale
if (max(code)==2^numbit-1) || (min(code)==0)
disp('Warning: ADC may be clipping!!!');
end
%Plot results in the time domain
figure;
plot([1:numpt],code);
title('TIME DOMAIN')
xlabel('SAMPLES');
ylabel('DIGITAL OUTPUT CODE');
%Recenter the digital sine wave
Dout=code-(2^numbit-1)/2;
%Dout=detrend(Dout);
%If no window function is used, the input tone must be chosen to be unique and with
%regard to the sampling frequency. To achieve this prime numbers are introduced and the
%input tone is determined by fIN = fSAMPLE * (Prime Number / Data Record Size).
%To relax this requirement, window functions such as HANNING and HAMING (see below) can
%be introduced, however the fundamental in the resulting FFT spectrum appears 'sharper'
%without the use of window functions.
%Doutw=Dout;
%Doutw=Dout.*blackmanharris(numpt);
Doutw=Dout.*hanning(numpt);
%Doutw=Dout.*hamming(numpt);
%Performing the Fast Fourier Transform
Dout_spect=fft(Doutw);
%Recalculate to dB
Dout_dB=20*log10(abs(Dout_spect));
%Display the results in the frequency domain with an FFT plot
figure;
maxdB=max(Dout_dB(1:numpt/2));
%For TTIMD, use the following short routine, normalized to ??.5dB full-scale.
%plot([0:numpt/2-1].*fclk/numpt,Dout_dB(1:numpt/2)-maxdB-6.5);
plot([0:numpt/2-1].*fclk/numpt,Dout_dB(1:numpt/2)-maxdB);
grid on;
title('FFT PLOT');
xlabel('ANALOG INPUT FREQUENCY (MHz)');
ylabel('AMPLITUDE (dB)');
a1=axis; axis([a1(1) a1(2) -120 a1(4)]);
%Calculate SNR, SINAD, THD and SFDR values
%Find the signal bin number, DC = bin 1
fin=find(Dout_dB(1:numpt/2)==maxdB);
%Span of the input frequency on each side
%span=max(round(numpt/80),5);
span=100;
%Approximate search span for harmonics on each side
spanh=2;
%Span of DC leakage bins
spanDC=50;
%Determine power spectrum
spectP=(abs(Dout_spect)).*(abs(Dout_spect));
%Find DC offset power
Pdc=sum(spectP(1:spanDC));
%Extract overall signal power
Ps=sum(spectP(fin-span:fin+span));
%Vector/matrix to store both frequency and power of signal and harmonics
Fh=[];
%The 1st element in the vector/matrix represents the signal, the next element represents
%the 2nd harmonic, etc.
Ph=[];
%Find harmonic frequencies and power components in the FFT spectrum
for har_num=1:10
%Input tones greater than fSAMPLE are aliased back into the spectrum
tone=rem((har_num*(fin-1)+1)/numpt,1);
if tone>0.5
%Input tones greater than 0.5*fSAMPLE (after aliasing) are reflected
tone=1-tone;
end
Fh=[Fh tone];
%For this procedure to work, ensure the folded back high order harmonics do not overlap
%with DC or signal or lower order harmonics
har_peak=max(spectP(round(tone*numpt)-spanh:round(tone*numpt)+spanh));
har_bin=find(spectP(round(tone*numpt)-spanh:round(tone*numpt)+spanh)==har_peak);
har_bin=har_bin+round(tone*numpt)-spanh-1;
Ph=[Ph sum(spectP(har_bin-1:har_bin+1))];
end
%Determine the total distortion power
Pd=sum(Ph(2:5));
%Determine the noise power
Pn=sum(spectP(1:numpt/2))-Pdc-Ps-Pd;
format;
A=(max(code)-min(code))/2^numbit
AdB=20*log10(A)
SINAD=10*log10(Ps/(Pn+Pd))
ENOB=(SINAD-1.76)/6.02
SNR=10*log10(Ps/Pn)
disp('THD is calculated from 2nd through 5th order harmonics');
THD=10*log10(Pd/Ph(1))
SFDR=10*log10(Ph(1)/max(Ph(2:10)))
disp('Signal & Harmonic Power Components:');
HD=10*log10(Ph(1:10)/Ph(1))
%Distinguish all harmonics locations within the FFT plot
hold on;
plot(Fh(2)*fclk,0,'mo',Fh(3)*fclk,0,'cx',Fh(4)*fclk,0,'r+',Fh(5)*fclk,0,'g*',...
Fh(6)*fclk,0,'bs',Fh(7)*fclk,0,'bd',Fh(8)*fclk,0,'kv',Fh(9)*fclk,0,'y^');
legend('1st','2nd','3rd','4th','5th','6th','7th','8th','9th');
hold off;


