吉布斯采样方法
对于多元分布, P ( X ) , X = [ x 1 x 2 ] P(X), X=\left[\begin{array}{l} x_1 \\ x_2 \end{array}\right] P(X),X=[x1x2]吉布斯抽样执行如下。假设很难从联合分布中抽样 P ( x 1 , x 2 ) P\left(x_1, x_2\right) P(x1,x2)但是从条件分布 P ( x 1 ∣ x 2 ) P(x_1|x_2) P(x1∣x2)和 P ( x 2 ∣ x 1 ) P(x_2|x_1) P(x2∣x1)中抽样是可能的。
- 从 X t = [ x 1 0 x 2 0 ] X^t=\left[\begin{array}{l} x_1^0 \\ x_2^0 \end{array}\right] Xt=[x10x20]开始
- 采样 x 1 t + 1 ∼ P ( x 1 ∣ x 2 t ) x_1^{t+1} \sim P\left(x_1 \mid x_2^t\right) x1t+1∼P(x1∣x2t)
- 采样 x 2 t + 1 ∼ P ( x 2 ∣ x 1 t + 1 ) x_2^{t+1} \sim P\left(x_2 \mid x_1^{t+1}\right) x2t+1∼P(x2∣x1t+1)
- X t + 1 = [ x 1 t + 1 x 2 t + 1 ] X^{t+1}=\left[\begin{array}{l} x_1^{t+1} \\ x_2^{t+1} \end{array}\right] Xt+1=[x1t+1x2t+1]
删除前几个样本作为老化值。
让
P
(
X
)
=
P
(
x
1
,
x
2
)
=
1
∣
2
π
Σ
∣
e
−
1
2
(
X
−
μ
)
T
Σ
−
1
(
X
−
μ
)
P(X)=P\left(x_1, x_2\right)=\frac{1}{\sqrt{|2 \pi \Sigma|}} e^{-\frac{1}{2}(X-\mu)^T \Sigma^{-1}(X-\mu)}
P(X)=P(x1,x2)=∣2πΣ∣1e−21(X−μ)TΣ−1(X−μ)
其中,
μ
=
[
0
0
]
\mu=\left[\begin{array}{l} 0 \\ 0 \end{array}\right]
μ=[00] 和
Σ
=
[
1
b
b
1
]
\Sigma=\left[\begin{array}{ll} 1 & b \\ b & 1 \end{array}\right]
Σ=[1bb1]和
X
=
[
x
1
x
2
]
X=\left[\begin{array}{l} x_1 \\ x_2 \end{array}\right]
X=[x1x2]和
b
=
0.8
b=0.8
b=0.8
条件概率由
P
(
x
1
∣
x
2
)
=
N
(
b
x
2
,
1
−
b
2
)
P
(
x
2
∣
x
1
)
=
N
(
b
x
1
,
1
−
b
2
)
\begin{aligned} & P\left(x_1 \mid x_2\right)=\mathcal{N}\left(b x_2, 1-b^2\right) \\ & P\left(x_2 \mid x_1\right)=\mathcal{N}\left(b x_1, 1-b^2\right) \end{aligned}
P(x1∣x2)=N(bx2,1−b2)P(x2∣x1)=N(bx1,1−b2)
代码
import numpy.linalg as LA
import numpy as np
import matplotlib.pyplot as plt

def multivariate_normal(X, mu=np.array([[0, 0]]), sig=np.array([[1, 0.8], [0.8, 1]])):
    sqrt_det_2pi_sig = np.sqrt(2 * np.pi * LA.det(sig))
    sig_inv = LA.inv(sig)
    X = X[:, None, :] - mu[None, :, :]
    return np.exp(-np.matmul(np.matmul(X, np.expand_dims(sig_inv, 0)), (X.transpose(0, 2, 1)))/2)/sqrt_det_2pi_sig

x = np.linspace(-3, 3, 1000)
X = np.array(np.meshgrid(x, x)).transpose(1, 2, 0)
X = np.reshape(X, [X.shape[0] * X.shape[1], -1])
z = multivariate_normal(X)

plt.imshow(z.squeeze().reshape([x.shape[0], -1]), extent=[-10, 10, -10, 10], cmap='hot', origin='lower')
plt.contour(x, x, z.squeeze().reshape([x.shape[0], -1]), cmap='cool')
plt.title('True Bivariate Distribution')
plt.xlabel('$x_1$')
plt.ylabel('$x_2$')
plt.show()

x0 = [0, 0]
xt = x0
b = 0.8
samples = []
for i in range(100000):
    x1_t = np.random.normal(b*xt[1], 1-b*b)
    x2_t = np.random.normal(b*x1_t, 1-b*b)
    xt = [x1_t, x2_t]
    samples.append(xt)
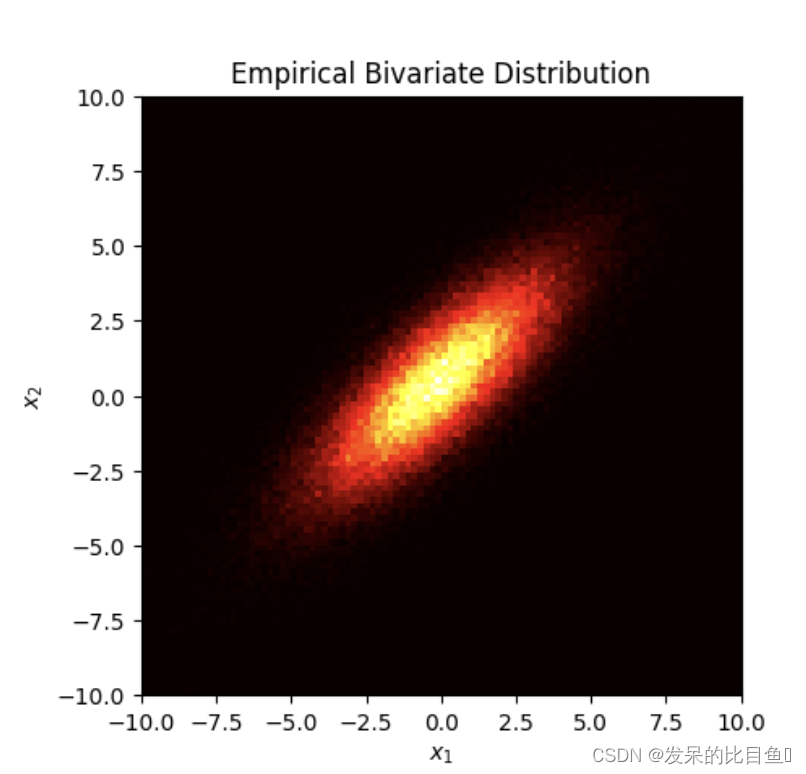
burn_in = 1000
samples = np.array(samples[burn_in:])

im, x_, y_ = np.histogram2d(samples[:, 0], samples[:, 1], bins=100, normed=True)
plt.imshow(im, extent=[-10, 10, -10, 10], cmap='hot', origin='lower', interpolation='nearest')
plt.title('Empirical Bivariate Distribution')
plt.xlabel('$x_1$')
plt.ylabel('$x_2$')
plt.show()
