常用ML代码片段
变换一列
new_df['brand'] = new_df['prod_name'].apply(lambda x: x.split()[0])
变换2列
new_df['chip_total_sales'] = new_df.apply(lambda x: x['total_sales'] * x['is_chip'], axis = 1)
# 重要的是axis=1
groupby 计数,求和,取第一个值,取得rank
df_per_card = new_df.groupby('loyalty_card_no')[['total_sales', 'chip_total_sales']].sum() # sum
df_per_card_pri = new_df.groupby('loyalty_card_no')['premium_customer'].min() # 取值
df_per_card_pri = new_df.groupby('loyalty_card_no')['premium_customer'].count() # 总数
# 可以分别不同的列用不同的方法,最后再把他们整合到一个dataframe
转换类别类型的列
def trans_one_col(df_data, col):
    if col in df_data.columns:
        enums = df_data[col].value_counts().index.tolist()
        for new_col in enums:
            df_data[col + new_col] = df_data[col].apply(lambda x: 1 if x==new_col else 0)
        del df_data[col]

trans_one_col(df_per_card, "premium_customer")
trans_one_col(df_per_card, "lifestage")
一个使用逻辑回归,并且split的模板
from sklearn import linear_model
from sklearn.model_selection import train_test_split
from sklearn.pipeline import Pipeline
from sklearn.preprocessing import StandardScaler
from sklearn.preprocessing import LabelBinarizer
from sklearn.metrics import accuracy_score
from sklearn.metrics import precision_score
from sklearn.metrics import recall_score
from sklearn.metrics import f1_score
from sklearn.metrics import roc_auc_score
from sklearn.metrics import confusion_matrix

train_set, test_set = train_test_split(df_per_card, test_size=0.2, random_state=42)
X_train = train_set.iloc[:, :-1]
y_train = train_set.iloc[:, -1]
X_test = test_set.iloc[:, :-1]
y_test = test_set.iloc[:, -1]

# X_train
logit = linear_model.LogisticRegression()
logit.fit(X_train, y_train)
pred = logit.predict(X_test)
prop_pred = logit.decision_function(X_test)

acc = accuracy_score(y_test, pred)
prec = precision_score(y_test, pred)
rec = recall_score(y_test, pred)
f1 = f1_score(y_test, pred)
auc_s = roc_auc_score(y_test, pred)
cmat = confusion_matrix(y_test, pred)
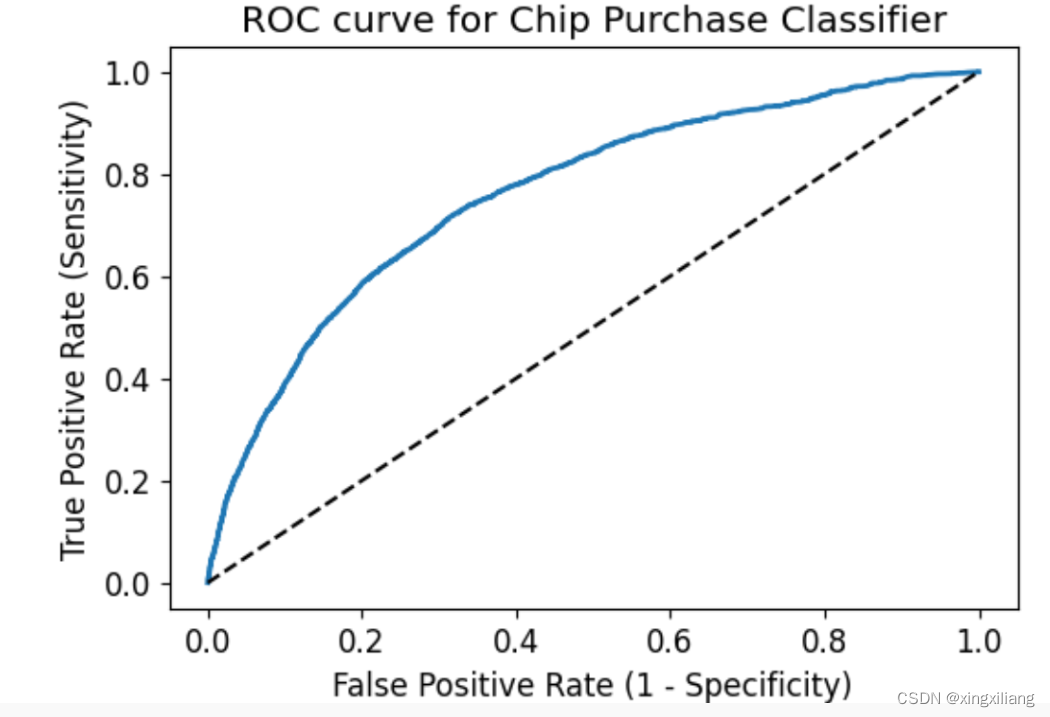
绘制ROC 曲线的模板
from sklearn.metrics import roc_curve
import matplotlib.pyplot as plt
fpr, tpr, thresholds = roc_curve(y_test, prop_pred, pos_label=1)
plt.figure(figsize = (6,4))
plt.plot(fpr, tpr, linewidth = 2)
plt.plot([0,1], [0,1], 'k--')
plt.rcParams['font.size'] = 12
plt.title('ROC curve for Chip Purchase Classifier')
plt.xlabel('False Positive Rate (1 - Specificity)')
plt.ylabel('True Positive Rate (Sensitivity)')
plt.show()
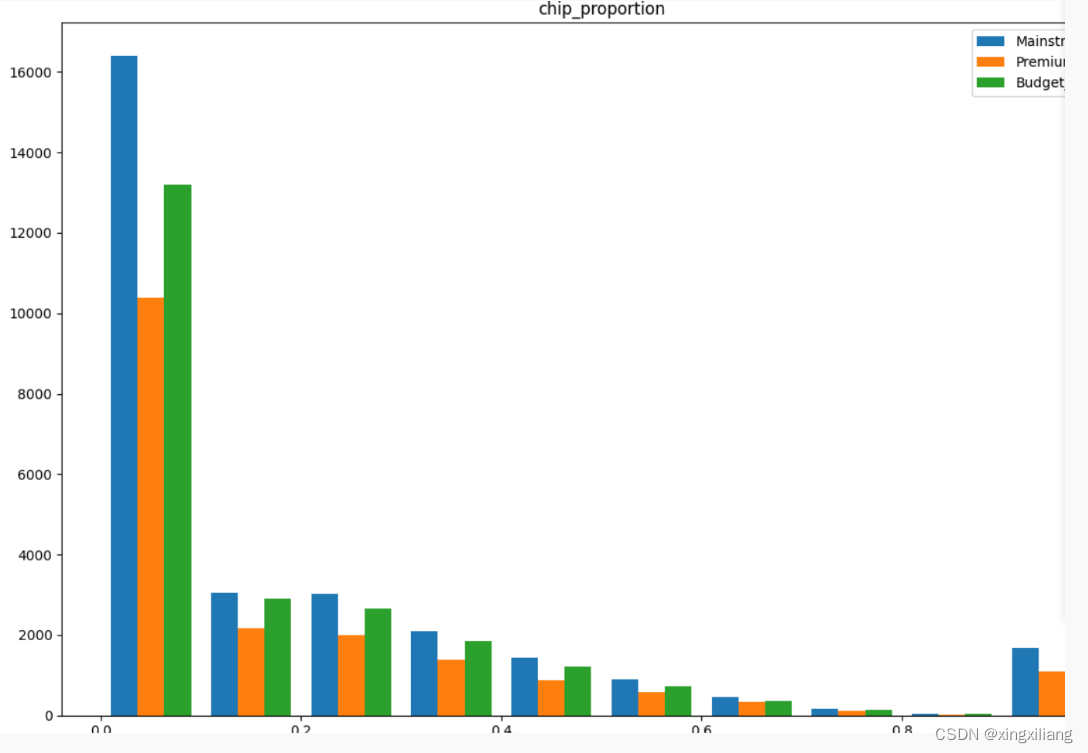
对于绘制不同类别的分布图,单变量,hist
import matplotlib.pyplot as plt

class_labels = ["Mainstream_Tier", 'Premium_Tier', "Budget_Tier" ]
fig = plt.figure(figsize=(12, 8))

for i, feature in enumerate(['chip_proportion']):
#     plt.subplot(3, 4, i+1)
    plt.hist([df_per_card[feature][df_per_card['premium_customer'] == 'Mainstream_Tier'],
              df_per_card[feature][df_per_card['premium_customer'] == 'Premium_Tier'],
              df_per_card[feature][df_per_card['premium_customer'] == 'Budget_Tier']
             ], label=class_labels)
    plt.xlabel("Chip proportion")
    plt.ylabel("vvv")
    plt.legend()
    plt.title(feature)

plt.tight_layout()
plt.show()
sns pairplot 带上hue和reg 可以代替这个
直接绘制每个列的分布情况
data.hist(figsize=(12, 10))
判断是不是工作日
import datetime
def date_is_weekday(datestring):
    ### return 0 if weekend, 1 if weekday
    dsplit = datestring.split('/')
    wday = datetime.datetime(int(dsplit[2]),int(dsplit[1]),int(dsplit[0])).weekday()
    return int(wday<=4)

###  01/12/2017
data["Weekday"] = data.Date.apply(lambda x: date_is_weekday(x))
转为数值的类型
data["Rainfall(mm)"] = pd.to_numeric(data["Rainfall(mm)"], errors="coerce")
绘制箱图
ax = data.boxplot(column="Temperature (C)")  # 列名
ax.set_ylabel('Temperature  before removing problem data')
plt.show()
删除偏差太大的点
data["Humidity (%)"][data["Humidity (%)"] < 0] = np.nan
删除NA
df.dropna(how='any', axis=1, inplace=True)
使用pipeline的模子
from sklearn.pipeline import make_pipeline


pipeline_step9 = Pipeline([ ('imputer', SimpleImputer(strategy="median")),
                           ('std_scaler', StandardScaler()),
                            ('linreg', LinearRegression())
                          ])


train_set, test_set = train_test_split(data, test_size=0.2, random_state=42)

print(type(train_set))

y_train = train_set["Rented Bike Count"]
X_train = train_set[selected_columms]

y_test = test_set["Rented Bike Count"]
X_test = test_set[selected_columms]

pipeline_step9.fit(X_train, y_train)
# Predict labels for training features
predictions = pipeline_step9.predict(X_train)
# Measure prediction error, for example:
mse = mean_squared_error(y_train, predictions)


import math
# calculate the RMSE of the fit to the training data
rmse_train = math.sqrt(mse)
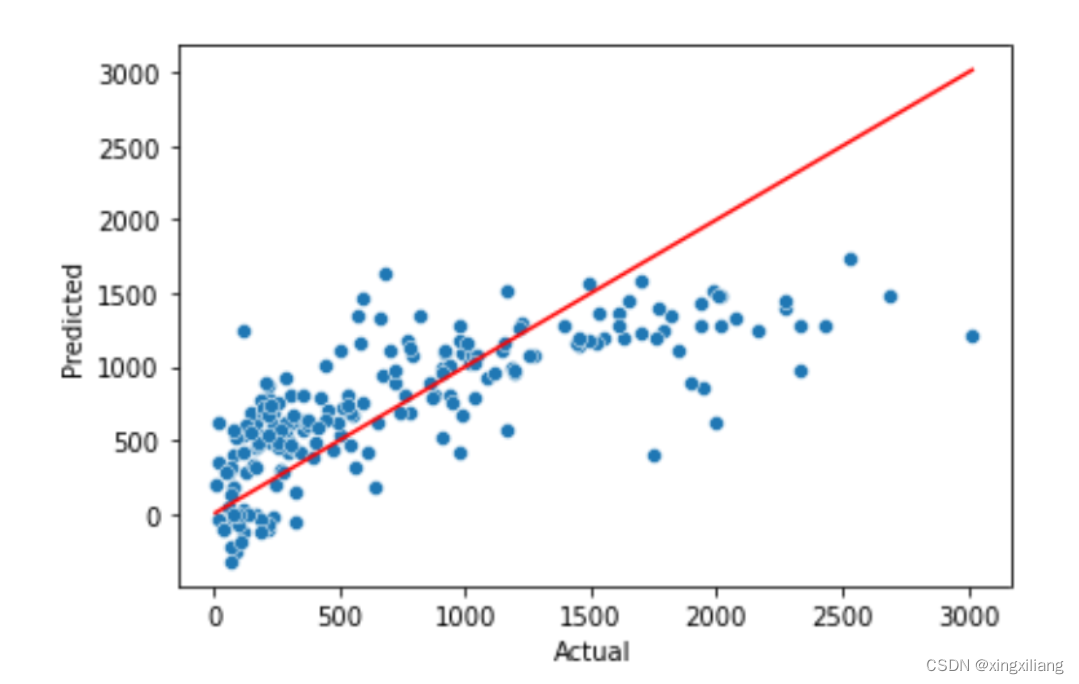
绘制真实的y和预测的y的散点图----拟合的直线在一起作比较
subset_size = 200
y_train_pred = pipeline_step9.predict(X_train[:subset_size])

# Then I create a scatterplot of predicted vs actual values using your variables from the cell above
ax = sns.scatterplot(x=y_train[:subset_size], y=y_train_pred)
# A perfect solution would look like the red line
sns.lineplot(x=y_train[:subset_size], y=y_train[:subset_size], color='red')
ax.set_xlabel('Actual')
ax.set_ylabel('Predicted')
cross validation 探索模型的稳定性
from sklearn.model_selection import KFold
from sklearn.model_selection import cross_validate
from sklearn.model_selection import cross_val_score

# preprocessed_data
preprocessed_data_train_X = pipeline_step7.fit_transform(X_train)


#Linear Regression CV mean and std RMSE from the 10 folds:
lr_model = LinearRegression()
scores = cross_val_score(lr_model, preprocessed_data_train_X, y_train,
                           scoring="neg_mean_squared_error", cv=10)
rmse_scores = np.sqrt(-scores)
rmse_LR_mean = rmse_scores.mean()
rmse_LR_std  = rmse_scores.std()
print('Linear Regression CV Scores:')
print(f'Mean: {rmse_LR_mean:.2f}, Std: {rmse_LR_std:.2f}\n')
GridSearch 搜参数
from sklearn.svm import SVC
# Put the pipeline with the appropriate model
svc_pl = Pipeline(steps=[
            ('preprocessor', preproc_pl),
            ('svc', SVC(random_state=42))
        ])

param_grid = {
    'svc__C': [0.1, 1, 10, 100],
    'svc__kernel': ['linear', 'poly', 'rbf', 'sigmoid'],
    'svc__gamma': ['scale', 'auto']
}

# Use GridSearchCV with cv=5
svc_model =  GridSearchCV(svc_pl, param_grid, cv=5, return_train_score=True)

svc_model.fit(X_train, y_train)

# Return best parameters in a dictionary
svc_best_parameters = svc_model.best_params_


knn_best_cv_scoring = knn_model.best_score_
我们可以看搜参过程中 误差是怎么变的
# Function to check the performance of each parameter.
def pooled_var(stds):
    # https://en.wikipedia.org/wiki/Pooled_variance#Pooled_standard_deviation
    n = 5 # size of each group
    return np.sqrt(sum((n-1)*(stds**2))/ len(stds)*(n-1))

# Function to create loss curves
def plot_gridSearchCV_loss_curve(cv_results, grid_params, title):

    df = pd.DataFrame(cv_results)
    results = ['mean_test_score',
               'mean_train_score',
               'std_test_score',
               'std_train_score']


    fig, axes = plt.subplots(1, len(grid_params),
                             figsize = (5*len(grid_params), 7),
                             sharey='row')
    axes[0].set_ylabel("Score", fontsize=25)


    for idx, (param_name, param_range) in enumerate(grid_params.items()):
#         print(df.columns)
#         print(df.head())
#         print(f'param_{param_name}')
        grouped_df = df.groupby(f'param_{param_name}')[results]\
            .agg({'mean_train_score': 'mean',
                  'mean_test_score': 'mean',
                  'std_train_score': pooled_var,
                  'std_test_score': pooled_var})

        previous_group = df.groupby(f'param_{param_name}')[results]
        shorted_param_name = param_name
        shorted_param_name = shorted_param_name.replace("classifier__", "")
        axes[idx].set_xlabel(param_name, fontsize=30)
        axes[idx].set_ylim(0.0, 1.1)
        lw = 2
        axes[idx].plot(param_range, grouped_df['mean_train_score'], label="Training score",
                    color="darkorange", lw=lw)
        axes[idx].fill_between(param_range,grouped_df['mean_train_score'] - grouped_df['std_train_score'],
                        grouped_df['mean_train_score'] + grouped_df['std_train_score'], alpha=0.2,
                        color="darkorange", lw=lw)
        axes[idx].plot(param_range, grouped_df['mean_test_score'], label="Cross-validation score",
                    color="navy", lw=lw)
        axes[idx].fill_between(param_range, grouped_df['mean_test_score'] - grouped_df['std_test_score'],
                        grouped_df['mean_test_score'] + grouped_df['std_test_score'], alpha=0.2,
                        color="navy", lw=lw)

    handles, labels = axes[0].get_legend_handles_labels()
    fig.suptitle(f'{title} Validation curves', fontsize=30)
    fig.legend(handles, labels, loc=8, ncol=2, fontsize=20)

    fig.subplots_adjust(bottom=0.25, top=0.85)
    plt.show()

# Check the performance for each model (knn, dt, svc and sgd). Use plot_gridSearchCV_loss_curve() function.
plot_gridSearchCV_loss_curve(knn_model.cv_results_,knn_model.param_grid, "KNN classifier")
plot_gridSearchCV_loss_curve(dt_model.cv_results_, dt_model.param_grid, "Decision Tree classifier")
plot_gridSearchCV_loss_curve(svc_model.cv_results_,svc_model.param_grid, "SVC classifier")
plot_gridSearchCV_loss_curve(sgd_model.cv_results_,sgd_model.param_grid, "SGD classifier")

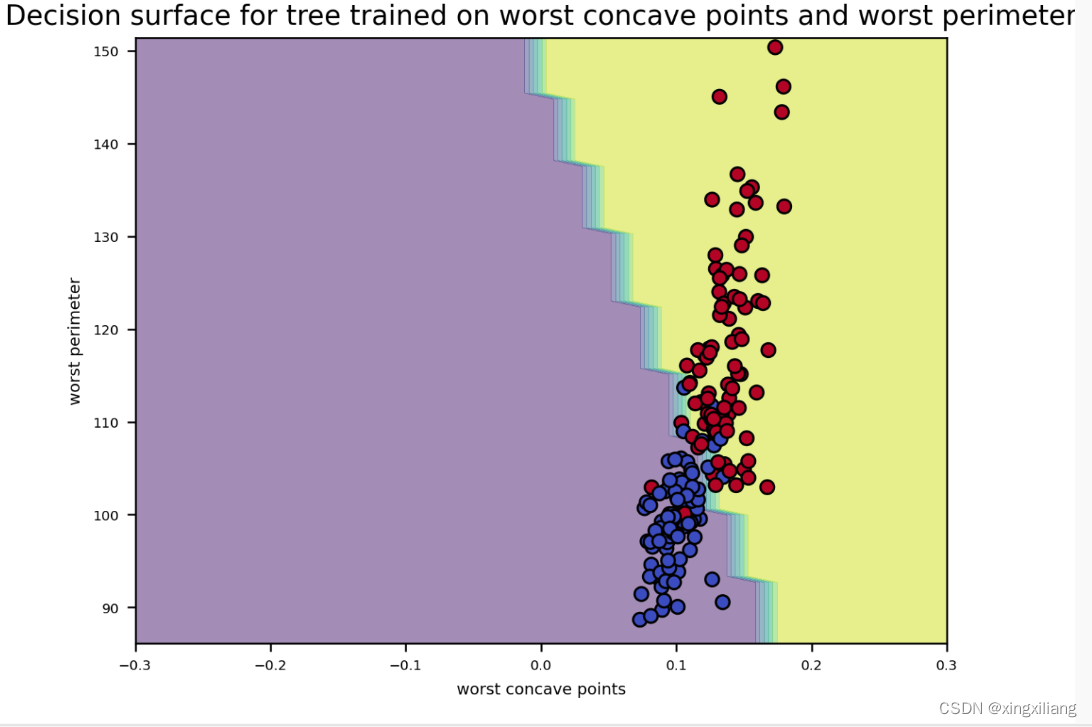
绘制分裂决定的曲线
from sklearn.inspection import DecisionBoundaryDisplay

# Assign the name of the best feature obtained in step18 to the variable below. (string)
feature_one = best_four_features[0]

# Assign the name of the second best feature obtained in step18 to the variable below. (string)
feature_two = best_four_features[1]

# Assign the training dataset that you would want to use for this step to the variable below
data2d = data[[feature_one, feature_two]]

'''
Check the decumentation of DecisionBoundaryDisplay in sklearn from
https://scikit-learn.org/stable/modules/generated/sklearn.inspection.DecisionBoundaryDisplay.html.

Use DecisionBoundaryDisplay.from_estimator(...) and assign the instance to the variable
below.

comment out the call to DecisionBoundaryDisplay.from_estimator(...) and all the ploting lines before uploading to gradescope.
'''

final_model2 =  Pipeline(steps=[
            ('preprocessor', preproc_pl),
            ('classifier', SGDClassifier(random_state=42, alpha=0.01, eta0=10, learning_rate='adaptive', loss='hinge', penalty="l2"))
        ])

final_model2.fit(data2d, data.label)
disp_step19 = DecisionBoundaryDisplay.from_estimator(final_model2, data2d,
                                                     response_method="predict",
                                                     xlabel=feature_one,
                                                    ylabel=feature_two, alpha = 0.5)

# Plotting the data points. Use this to create the scatter plot
disp_step19.ax_.scatter(X_train[feature_one], X_train[feature_two],
                        c=y_train, edgecolor="k",
                        cmap=plt.cm.coolwarm)
plt.xlim(-0.3, 0.3)
plt.title(f"Decision surface for tree trained on {feature_one} and {feature_two}")
plt.show()
