一、前言
前端开发需要经常使用ECharts图表渲染数据信息,在一个项目中我们经常需要使用多个图表,选择封装ECharts组件复用的方式可以减少代码量,增加开发效率。
ECharts图表大家应该用的都比较多,基础的用法就不细说了,具体用法参考ECharts官网。
二、封装ECharts组件
为什么要封装组件
- 避免重复的工作量,提升复用性
- 使代码逻辑更加清晰,方便项目的后期维护
- 封装组件可以让使用者不去关心组件的内部实现以及原理,能够使一个团队更好的有层次的去运行
封装的ECharts组件实现了以下的功能:
- 使用组件传递ECharts中的
option属性 - 手动/自动设置chart尺寸
- chart自适应宽高
- 动态展示获取到的后端数据
本文使用的是vue3 + typescript的写法。
代码实现:
ECharts组件:
<template>
  <div :id="id" :class="className" :style="{ height, width }" />
</template>
<script setup lang="ts">
//按需导入需要用到的 vue函数 和 echarts
import { onMounted, onBeforeUnmount, defineProps, watch } from "vue";
import * as echarts from 'echarts';
//获取 dom 和 父组件数据 并定义"myChart"用于初始化图表
let myChart: echarts.ECharts;
const props = defineProps({
  id: {
    type: String,
    default: 'chart',
    required: true
  },
  className: {
    type: String,
    default: ''
  },
  width: {
    type: String,
    default: '100%',
  },
  height: {
    type: String,
    default: '300px',
  },
  loading: {
    type: Boolean,
    default: true,
  },
  fullOptions: {
    type: Object,
    default: () => ({}),
    required: true
  },
})
//重绘图表函数
const resizeHandler = () => {
  myChart.resize();
}
//设置防抖,保证无论拖动窗口大小,只执行一次获取浏览器宽高的方法
const debounce = (fun: { (): void; (): void; }, delay: number | undefined) => {
  let timer: number | undefined;
  return function () {
    if (timer) {
      clearTimeout(timer);
    }
    timer = setTimeout(() => {
      fun();
    }, delay);
  }
};
const cancalDebounce = debounce(resizeHandler, 50);
//页面成功渲染,开始绘制图表
onMounted(() => {
  //配置为 svg 形式,预防页面缩放而出现模糊问题;图表过于复杂时建议使用 Canvas
  myChart = echarts.init(document.getElementById(props.id) as HTMLDivElement, { renderer: 'svg' })
  myChart.showLoading({
    text: '',
    color: '#409eff',
    textColor: '#000',
    maskColor: 'rgba(255, 255, 255, .95)',
    zlevel: 0,
    lineWidth: 2,
  });
  if (!props.loading) {
    myChart.hideLoading();
    myChart.setOption(props.fullOptions.options, true);
  }
  //自适应不同屏幕时改变图表尺寸
  window.addEventListener('resize', cancalDebounce);
})
//页面销毁前,销毁事件和实例
onBeforeUnmount(() => {
  window.removeEventListener('resize', cancalDebounce)
  myChart.dispose()
})
//监听图表数据时候变化,重新渲染图表
watch(() => [props.fullOptions.options, props.loading], () => {
  if (!props.loading) {
    myChart.hideLoading();
    myChart.setOption(props.fullOptions.options, true);
  }
}, { deep: true })
</script>
ECharts组件的用法:
<template>
  <Echarts
    id="echarts"
    height="300px"
    :full-options="echartsOptions"
    :loading="loading"
  >
  </Echarts>
</template>

<script setup lang="ts">
// 引进Echarts 组件
import Echarts from '@/components/Echarts/Echarts.vue';
// 引进Echarts 的options配置文件,可根据项目模块来创建该配置文件
import chartOption from '@/components/Echarts/options';

const echartsOptions = reactive({
  options: { },
  init: false
});
// 此处可请求接口来获取数据
// 我的options配置使用的是dataset的形式,传进options中的两个参数data(图表的数据)和dimension(图表的维度),
onMounted(() => {
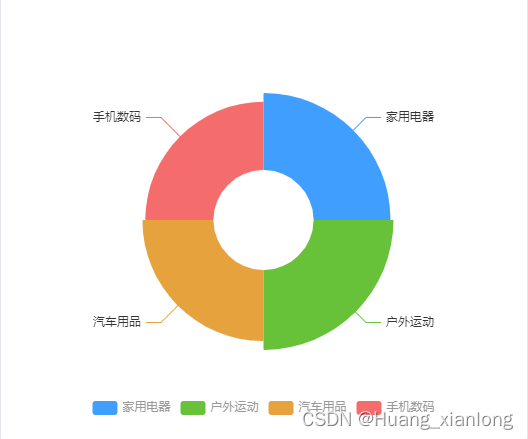
  const testData = [26,27,24,23];
  const testDimensions = ['家用电器','户外运动','汽车用品','手机数码'];
  echartsOptions.options = chartOption.testOption(testData, testDimensions);
});
</script>
options.ts文件
// 所有用到的 echarts option 都在这里进行配置
const chartOption = {
  // 温湿度折线图
  testOption(data: any, dimensions: any) {
    const option = {
      grid: {
        left: '2%',
        right: '2%',
        bottom: '10%',
        containLabel: true
      },
      legend: {
        top: 'bottom',
        textStyle: {
          color: '#999'
        }
      },

      dataset: {
        dimensions: dimensions,
        source: data
      },
      series: [
        {
          name: 'Nightingale Chart',
          type: 'pie',
          radius: [50, 130],
          center: ['50%', '50%'],
          roseType: 'area',
          itemStyle: {
            borderRadius: 1,
            color: function (params: any) {
              //自定义颜色
              const colorList = ['#409EFF', '#67C23A', '#E6A23C', '#F56C6C'];
              return colorList[params.dataIndex];
            }
          }
        }
      ]
    };
    return option;
  }
}
效果:
