1 实验内容简介
1.1 实验目的
(1)熟练掌握tensor相关各种操作;
(2)掌握广义线性回归模型(logistic模型、sofmax模型)、前馈神经网络模型的原理;
(3)熟练掌握基于mindspore和pytorch的广义线性模型与前馈神经网络模型的实现。
1.2 实验内容及要求
请基于mindspore和pytorch平台实现对MNIST数据集的分类分析,并以分类的准确度和混淆矩阵为衡量指标,分析二个模型(softmax、前馈神经网络)的精度。
要求:pytorch可与tensorflow替换,但mindspore为必选平台,建议安装1.5版本。(mindspore可以在华为云ModelArts上实现)。
1.3 实验数据集介绍
1.3.1 数据集简介
MNIST数据集(Mixed National Institute of Standards and Technology Database)是一个用来训练各种图像处理系统的二进制图像数据集,广泛应用于机器学习中的训练和测试。MNIST数据集共有70000张图像,其中训练集60000张,测试集10000张。所有图像都是28×28的灰度图像,每张图像包含一个手写数字。
1.3.2 数据集详细信息
(1)数据量
训练集60000张图像,其中30000张来自NIST的Special Database 3,30000张来自NIST的Special Database 1。测试集10000张图像,其中5000张来自NIST的Special Database 3,5000张来自NIST的Special Database 1。
(2)标注情况
每张图像都有标注。
(3)标注类别
共10个类别,每个类别代表0~9之间的一个数字,每张图像只有一个类别。
1.3.3 数据集文件结构
(1)目录结构
·解压前
dataset_compressed/
├── t10k-images-idx3-ubyte.gz #测试集图像压缩包(1648877 bytes)
├── t10k-labels-idx1-ubyte.gz #测试集标签压缩包(4542 bytes)
├── train-images-idx3-ubyte.gz #训练集图像压缩包(9912422 bytes)
└── train-labels-idx1-ubyte.gz #训练集标签压缩包(28881 bytes)
·解压后
dataset_uncompressed/
├── t10k-images-idx3-ubyte #测试集图像数据
├── t10k-labels-idx1-ubyte #测试集标签数据
├── train-images-idx3-ubyte #训练集图像数据
└── train-labels-idx1-ubyte #训练集标签数据
(2)文件结构
MNIST数据集将图像和标签都以矩阵的形式存储于一种称为idx格式的二进制文件中。该数据集的4个二进制文件的存储格式分别如下:
·训练集标签数据 (train-labels-idx1-ubyte)

·训练集图像数据(train-images-idx3-ubyte)

·测试集标签数据(t10k-labels-idx1-ubyte)

·测试集图像数据 (t10k-images-idx3-ubyte)

2 算法原理阐述
2.1 Softmax回归
Softmax 回归模型主要用于解决离散值预测的多分类问题,是Logistic回归在多分类问题上的推广。Softmax回归和Logistic回归一样,也是将输入特征与权重做线性叠加,但是Softmax回归的输出值个数等于标签中的类别数,对每个输入计算输出。譬如我们考察一个如下图所示的隐层有四个结点、输出层有三个结点的单隐层神经网络,每个输出的计算依赖于所有的输入。

softmax函数又称归一化指数函数,它是二分类函数sigmoid在多分类上的推广,目的是将多分类的结果以概率的形式展现出来。下图展示了softmax的计算方法:

softmax第一步就是将模型的预测结果转化到指数函数上,这样保证了概率的非负性。为了确保各个预测结果的概率之和等于1,我们需要将转换后的结果进行归一化处理,方法就是将转化后的结果除以所有转化后结果之和,这样就得到近似的概率。
2.2 前馈神经网络
前馈神经网络中,把每个神经元按接收信息的先后分为不同的组,每一组可以看做是一个神经层。每一层中的神经元接收前一层神经元的输出,并输出到下一层神经元。整个网络中的信息是朝着一个方向传播的,没有反向的信息传播(和误差逆传播算法不是一回事),可以用一个有向无环图来表示。前馈神经网络包括全连接前馈神经网络和卷积神经网络。前馈神经网络可以看做是一个函数,通过简单非线性函数的多次复合,实现输入空间到输出空间的复杂映射。多层前馈神经网络的图示如下:

使用随机梯度下降的误差反向传播算法的具体训练过程伪代码描述如下:

3 实验流程及代码实现
3.1 实验平台简介
3.1.1 MindSpore
MindSpore是华为公司自研的最佳匹配昇腾AI处理器算力的全场景深度学习框架,为数据科学家和算法工程师提供设计友好、运行高效的开发体验,推动人工智能软硬件应用生态繁荣发展,目前MindSpore支持在EulerOS、Ubuntu、Windows系统上安装。
3.1.2 pytorch
PyTorch是一个开源的Python机器学习库,基于Torch,用于自然语言处理等应用程序。2017年1月,由Facebook人工智能研究院(FAIR)基于Torch推出了PyTorch。它是一个基于Python的可续计算包,提供两个高级功能:1、具有强大的GPU加速的张量计算(如NumPy)。2、包含自动求导系统的深度神经网络。
3.2 评价指标
3.2.1 混淆矩阵
混淆矩阵(Confusion Matrix)又被称为错误矩阵,通过它可以直观地观察到算法的效果。它的每一列是样本的预测分类,每一行是样本的真实分类(反过来也可以),顾名思义,它反映了分类结果的混淆程度。

·P(Positive):代表1,表示预测为正样本;
·N(Negative):代表0,表示预测为负样本;
·T(True):代表预测正确;
·F(False):代表预测错误。
下列Positive和Negative表示模型对样本预测的结果是正样本(正例)还是负样本(负例)。True和False表示预测的结果和真实结果是否相同。
·True positives(TP)
预测为1,预测正确,即实际为1;
·False positives(FP)
预测为1,预测错误,即实际为0;
·False negatives(FN)
预测为0,预测错误,即实际为1;
·True negatives(TN)
预测为0,预测正确,即实际为0。
3.2.2 准确率
准确率(Accuracy)衡量的是分类正确的比例。
3.3 实验流程
3.3.1 基于MindSpore的Softmax回归
3.3.1.1 读取数据集
分别读取MNIST的标签数据和图像数据。由前面的数据集介绍可知,标签数据的前8个字节是magic number和样本个数字段,所以标签数据的偏移量为8。我们使用struct.unpack方法读取前两个数据,lbpath.read(8)表示一次从文件中读取8个字节,这样读到的前两个数据分别是magic number(2049)和样本个数(60000),之后再读取标签数据。同样地,图像数据的前16个字节分别是magic number、图像数量、图像的高rows和图像的宽columns。我们使用struct.unpack方法读取前四个数据,lbpath.read(16)表示一次从文件中读取16个字节,这样读到的前四个数据分别是magic number(2051)、图像数量(60000)、图像的高rows(28)和图像的宽columns(28)。
# 导入已下载的数据集
def load_mnist(path, kind='train'):
    # os.path.join()函数用于路径拼接文件路径
    labels_path = os.path.join(path, '%s-labels.idx1-ubyte' % kind)
    images_path = os.path.join(path, '%s-images.idx3-ubyte' % kind)

    # 读取训练集标签数据集
    with open(labels_path, 'rb') as lbpath:
        magic, n = struct.unpack('>II',lbpath.read(8))
        # 使用struct.unpack方法读取前两个数据。lbpath.read(8)表示一次从文件中读取8个字节
        # 这样读到的前两个数据分别是magic number(2049)和样本个数(60000)
        labels = np.fromfile(lbpath,dtype=np.uint8)
        # 读取标签,标签的数值在0~9之间

    # 读取训练集图片数据集
    with open(images_path, 'rb') as imgpath:
        magic, num, rows, cols = struct.unpack('>IIII',imgpath.read(16))
        # 使用struct.unpack方法读取前四个数据。lbpath.read(16)表示一次从文件中读取16个字节
        # 这样读到的前四个数据分别是magic number(2051)、图像数量(60000)、图像的高rows(28)、图像的宽columns(28)
        images = np.fromfile(imgpath,dtype=np.uint8).reshape(len(labels), 28, 28, 1)  # 设置图像形状,高度宽度均为28,通道数为1
    return images, labels
    # labels形状为(60000,)
    # images形状为(60000, 28, 28, 1)
3.3.1.2 自定义迭代器
mindspore.dataset提供了部分常用数据集和标准格式数据集的加载接口。对于MindSpore暂不支持直接加载的数据集,可以通过构造自定义数据集类或自定义数据集生成函数的方式来生成数据集,然后通过mindspore.dataset.GenaratorDataset接口实现自定义方式的数据集加载。通过自定义数据集类和自定义数据集生成函数两种方式生成的数据集,都可以完成加载、迭代等操作。由于在自定义数据集类中定义了随机访问函数和获取数据集大小函数,因此当需要随机访问数据集中某条数据或获取数据集大小时,使用自定义数据集类生成的数据集可以快速完成这些操作,而通过自定义数据集生成函数的方式生成的数据集需要对数据逐条遍历方可完成这些操作。一般情况下,当数据量较小时使用两种生成自定义数据集的方式中的任一种都可以,而当数据量过大时,优先使用自定义数据集类的方式生成数据集。
在用户自定义数据集类中须要自定义的类函数如下:
·__init__:定义数据初始化等操作,在实例化数据集对象时被调用。
·__getitem__:定义该函数后可使其支持随机访问,能够根据给定的索引值index,获取数据集中的数据并返回。数据返回值类型是由NumPy数组组成的Tuple。
·__len__:返回数据集的样本数量。
在完成自定义数据集类之后,可以通过GeneratorDataset接口按照用户定义的方式加载并访问数据集样本。下面我们通过两段示例代码来说明使用自定义数据集类的方式生成单标签数据集和多标签数据集的方法。
class FashionMnist():
    def __init__(self, path, kind):  # 定义数据初始化等操作,在实例化数据集对象时被调用
        self.data, self.label = load_mnist(path, kind)

    def __getitem__(self, index):  # 定义该函数后可使其支持随机访问,能够根据给定的索引值index,获取数据集中的数据并返回
        return self.data[index], self.label[index]

    def __len__(self):  # 返回数据集的样本数量
        return len(self.data)
3.3.1.3 数据归一化
# 数据变换
trans = [cv.Rescale(1.0 / 255.0, 0), cv.HWC2CHW()] # 数据做标准化处理,所得到的数值分布满足正态分布
# 调整图像的像素大小。Rescale变换用于调整图像像素值的大小,包括两个参数:
# rescale:缩放因子。shift:平移因子。图像的每个像素将根据这两个参数
# 进行调整,输出的像素值为 outputi = inputi ∗ rescale+shift
# HWC2CWH变换用于转换图像格式,(height, width, channel)转为(channel, height, width)
type_cast_op = C.TypeCast(mindspore.int32)  # 将输入的Tensor转换为指定的数据类型
if resize:
    trans.insert(0, cv.Resize(resize))  # 调整为给定的尺寸大小
mnist_train = mnist_train.map(trans, input_columns=["image"])
mnist_test = mnist_test.map(trans, input_columns=["image"])
mnist_train = mnist_train.map(type_cast_op, input_columns=['label'])
mnist_test = mnist_test.map(type_cast_op, input_columns=['label'])

mnist_train = mnist_train.batch(batch_size, num_parallel_workers=works)
mnist_test = mnist_test.batch(batch_size, num_parallel_workers=works)
3.3.1.4 构建网络
nn.SequentialCell是一个有序的Cell容器,输入Tensor将按照定义的顺序通过所有Cell。我们可以使用SequentialCell来快速组合构造一个神经网络模型。nn.Flatten()将输入的X维度从[256,1,28,28]变成[256,784],则一个样本数据一行。损失函数使用SoftmaxCrossEntropyWithLogits交叉熵损失函数,同时计算softmax及其损失。优化器采用随机梯度下降SGD,学习率指定为0.1。
net = nn.SequentialCell([nn.Flatten(), nn.Dense(784, 10, weight_init=Normal(0.01, 0), bias_init='zero')])
loss = nn.SoftmaxCrossEntropyWithLogits(sparse=True, reduction='mean')
optim = nn.SGD(net.trainable_params(), learning_rate=0.1)
3.3.1.5 训练网络
# 训练模型一个迭代周期
def train_epoch(net, train_iter, loss, optim):
    net_with_loss = nn.WithLossCell(net, loss)                # 将net与loss连接
    net_train = nn.TrainOneStepCell(net_with_loss, optim)     # 将net,loss,optim连接,生成训练模型
    metric = Accumulator(3)
    for X, y in train_iter:
        l = net_train(X, y)
        y_hat = net(X)
        metric.add(float(l.sum().asnumpy()),accuracy(y_hat, y), y.size)
    return  metric[0] / metric[2], metric[1] / metric[2]
3.3.1.6 准确率及混淆矩阵
# 计算在指定数据集上模型的精度;得到混淆矩阵
def evaluate_accuracy(net, data_iter):
    metric = Accumulator(2)         # 累加器,metric[0]记录正确预测数,metric[1]记录预测总数
    hunxiao=np.zeros((10,10))
    for X, y in data_iter:
        metric.add(accuracy(net(X), y), y.size)
        y_hat = net(X).argmax(axis=1)
        hunxiao+=confusion_matrix(y.asnumpy(),y_hat.asnumpy())
    plot_confusion_matrix(hunxiao,  title='Confusion Matrix')
    return metric[0] / metric[1]    # 正确预测数 / 预测总数
3.3.1.7 绘制混淆矩阵
classes = ['0', '1', '2', '3', '4', '5','6','7','8','9']
def plot_confusion_matrix(cm, title='Confusion Matrix'):
    plt.figure(figsize=(12, 8), dpi=100)
    np.set_printoptions(precision=2)
    # 混淆矩阵中每格的值
    ind_array = np.arange(len(classes))
    x, y = np.meshgrid(ind_array, ind_array)
    for x_val, y_val in zip(x.flatten(), y.flatten()):
        c = cm[y_val][x_val]
        if c > 0.001:
            plt.text(x_val, y_val, "%0.2f" % (c,), color='#EE3B3B', fontsize=10, va='center', ha='center')
    plt.imshow(cm, interpolation='nearest', cmap=plt.cm.binary)
    plt.title(title)
    plt.colorbar()
    xlocations = np.array(range(len(classes)))
    plt.xticks(xlocations, classes, rotation=90)
    plt.yticks(xlocations, classes)
    plt.ylabel('Actual Label')
    plt.xlabel('Predict Label')
    tick_marks = np.array(range(len(classes))) + 0.5
    plt.gca().set_xticks(tick_marks, minor=True)
    plt.gca().set_yticks(tick_marks, minor=True)
    plt.gca().xaxis.set_ticks_position('none')
    plt.gca().yaxis.set_ticks_position('none')
    plt.grid(True, which='minor', linestyle='-')
    plt.gcf().subplots_adjust(bottom=0.15)
    plt.show()
3.3.2 基于pytorch的Softmax回归
3.3.2.1 定义网络结构
网络结构采用784个输入结点和10个输出结点,激活函数采用softmax。
class Net(nn.Module):
    def __init__(self):
        super(Net, self).__init__()  # 初始化
        self.fc1 = nn.Linear(784, 10)  # 784个输入10个输出
        self.softmax = nn.Softmax(dim=1)  # 激活函数 dim=1表示对第一个维度进行概率计算

    def forward(self, x):
        # torch.Size([64, 1, 28, 28]) -> (64,784)
        x = x.view(x.size()[0], -1)  # 4维变2维 (在全连接层做计算只能2维)
        x = self.fc1(x)  # 传给全连接层继续计算
        x = self.softmax(x)  # 使用softmax激活函数进行计算
        return x
3.3.2.2 训练模型
def train():
    for i, data in enumerate(train_loader):
        # 获得一个批次的数据和标签
        inputs, labels = data
        # 获得模型预测结果(64,10)
        out = model(inputs)
        # to onehot 把数据标签变成独热编码
        labels = labels.reshape(-1, 1)  # 先把1维变成2维(64)-(64,1)
        # tensor.scatter(dim,index,src)
        # dim:对那个维度进行独热编码
        # index:要将src中对应的值放到tensor那个位置
        # src:插入index的数值
        one_hot = torch.zeros(inputs.shape[0], 10).scatter(1, labels, 1)
        # 计算loss   mse_loss的两个数据的shape要一致
        loss = mse_loss(out, one_hot)
        # 梯度清零
        optimizer.zero_grad()
        # 计算梯度
        loss.backward()
        # 修改权值
        optimizer.step()
3.3.3 基于MindSpore的前馈神经网络
3.3.3.1 加载并查看数据集
MNIST是一个手写数字数据集,训练集包含60000张手写数字,测试集包含10000张手写数字,共10类。可在MNIST数据集的官网下载数据集,解压到当前代码目录下。MindSpore的dataset模块有专门用于读取和解析Mnist数据集的源数据集,可直接读取并生成训练集和测试集。
ds_train = ds.MnistDataset(os.path.join(r'D:\Dataset\MNIST', "train"))
ds_test = ds.MnistDataset(os.path.join(r'D:\Dataset\MNIST', "test"))

print('训练数据集数量:', ds_train.get_dataset_size())
print('测试数据集数量:', ds_test.get_dataset_size())
# 该数据集可以通过create_dict_iterator()转换为迭代器形式,然后通过get_next()一个个输出样本
image = ds_train.create_dict_iterator().get_next()

print('图像长/宽/通道数:', image['image'].shape)
# 一共10类,用0-9的数字表达类别。
print('一张图像的标签样式:', image['label'])
3.3.3.2 生成测试集和训练集
创建数据集,为训练集设定Batch Size,这是因为我们通常会采用小批量梯度下降法(MBGD)来训练网络,所以batch size作为一个非常重要的超参数需要提前设定好。在本代码中,batch size为128,意味着每一次更新参数,我们都用128个样本的平均损失值来进行更新。
def create_dataset(training=True, batch_size=128, resize=(28, 28), rescale=1 / 255, shift=-0.5, buffer_size=64):
    ds = ms.dataset.MnistDataset(DATA_DIR_TRAIN if training else DATA_DIR_TEST)

    # 定义改变形状、归一化和更改图片维度的操作。
    # 改为(28,28)的形状
    resize_op = CV.Resize(resize)
    # rescale方法可以对数据集进行归一化和标准化操作,这里就是将像素值归一到0和1之间,shift参数可以让值域偏移至-0.5和0.5之间
    rescale_op = CV.Rescale(rescale, shift)
    # 由高度、宽度、深度改为深度、高度、宽度
    hwc2chw_op = CV.HWC2CHW()

    # 利用map操作对原数据集进行调整
    ds = ds.map(input_columns="image", operations=[resize_op, rescale_op, hwc2chw_op])
    ds = ds.map(input_columns="label", operations=C.TypeCast(ms.int32))
    # 设定洗牌缓冲区的大小,从一定程度上控制打乱操作的混乱程度
    ds = ds.shuffle(buffer_size=buffer_size)
    # 设定数据集的batch_size大小,并丢弃剩余的样本
    ds = ds.batch(batch_size, drop_remainder=True)
    return ds
3.3.3.3 模型搭建与训练
本实验采用的是全连接神经网络算法,所以我们首先需要建立初始化的神经网络。nn.cell能够用来组成网络模型;模型包括5个卷积层和RELU激活函数,一个全连接输出层并使用softmax进行多分类,共分成(0-9)10类。利用定义类的方式生成网络,Mindspore中定义网络需要继承nn.cell。在init方法中定义该网络需要的神经网络层,在construct方法中梳理神经网络层与层之间的关系。
class ForwardNN(nn.Cell):
    def __init__(self):
        super(ForwardNN, self).__init__()
        self.flatten = nn.Flatten()
        self.relu = nn.ReLU()
        self.fc1 = nn.Dense(784, 512, activation='relu')
        self.fc2 = nn.Dense(512, 256, activation='relu')
        self.fc3 = nn.Dense(256, 128, activation='relu')
        self.fc4 = nn.Dense(128, 64, activation='relu')
        self.fc5 = nn.Dense(64, 32, activation='relu')
        self.fc6 = nn.Dense(32, 10, activation='softmax')

    def construct(self, input_x):
        output = self.flatten(input_x)
        output = self.fc1(output)
        output = self.fc2(output)
        output = self.fc3(output)
        output = self.fc4(output)
        output = self.fc5(output)
        output = self.fc6(output)
        return output
指定模型所需的损失函数、评估指标、优化器等参数,然后将创建好的网络、损失函数、评估指标、优化器等参数装入模型中对模型进行训练。
lr = 0.001
num_epoch = 8
momentum = 0.9

net = ForwardNN()
# 定义loss函数,改函数不需要求导,可以给离散的标签值,且loss值为均值
loss = nn.loss.SoftmaxCrossEntropyWithLogits(sparse=True, reduction='mean')
# 定义准确率为评价指标,用于评价模型
metrics = {"Accuracy": Accuracy(), "Confusion_matrix": nn.ConfusionMatrix(num_classes= 10)}
# 定义优化器为Adam优化器,并设定学习率
opt = nn.Adam(net.trainable_params(), lr)
# 生成验证集,验证机不需要训练,所以不需要repeat
ds_eval = create_dataset(False, batch_size=32)
# 模型编译过程,将定义好的网络、loss函数、评价指标、优化器编译
model = Model(net, loss, opt, metrics)
# 生成训练集
ds_train = create_dataset(True, batch_size=32)
print("============== 开始训练 ==============")
# 训练模型,用loss作为监控指标,并利用昇腾芯片的数据下沉特性进行训练
model.train(num_epoch, ds_train, callbacks=[LossMonitor()], dataset_sink_mode=True)
# 使用测试集评估模型,打印总体准确率
metrics_result = model.eval(ds_eval)
res = metrics_result["Confusion_matrix"]
3.3.4 基于pytorch的前馈神经网络
搭建的网络结构的输入层有784个节点;三个隐藏层,每层20个节点;输出层有10个节点。
class BP:
    def __init__(self):
        self.input = np.zeros((100, 784))   # 100 samples per round
        self.hidden_layer_1 = np.zeros((100, 20))
        self.hidden_layer_2 = np.zeros((100, 20))
        self.hidden_layer_3 = np.zeros((100, 20))
        self.output_layer = np.zeros((100, 10))
        self.w1 = 2 * np.random.random((784, 20)) - 1   # limit to (-1, 1)
        self.w2 = 2 * np.random.random((20, 20)) - 1
        self.w3 = 2 * np.random.random((20, 20)) - 1
        self.w4 = 2 * np.random.random((20, 10)) - 1
        self.error = np.zeros(10)
        self.learning_rate = 0.1

    def sigmoid(self, x):
        return 1 / (1 + np.exp(-x))

    def sigmoid_deri(self, x):
        return x * (1 - x)

    def forward_prop(self, data, label):   # label:100 X 10,data: 100 X 784
        self.input = data
        self.hidden_layer_1 = self.sigmoid(np.dot(self.input, self.w1))
        self.hidden_layer_2 = self.sigmoid(np.dot(self.hidden_layer_1, self.w2))
        self.hidden_layer_3 = self.sigmoid(np.dot(self.hidden_layer_2, self.w3))
        self.output_layer = self.sigmoid(np.dot(self.hidden_layer_3, self.w4))
        self.error = label - self.output_layer
        return self.output_layer

    def backward_prop(self):
        output_diff = self.error * self.sigmoid_deri(self.output_layer)
        hidden_diff_3 = np.dot(output_diff, self.w4.T) * self.sigmoid_deri(self.hidden_layer_3)
        hidden_diff_2 = np.dot(hidden_diff_3, self.w3.T) * self.sigmoid_deri(self.hidden_layer_2)
        hidden_diff_1 = np.dot(hidden_diff_2, self.w2.T) * self.sigmoid_deri(self.hidden_layer_1)
        # update
        self.w4 += self.learning_rate * np.dot(self.hidden_layer_3.T, output_diff)
        self.w3 += self.learning_rate * np.dot(self.hidden_layer_2.T, hidden_diff_3)
        self.w2 += self.learning_rate * np.dot(self.hidden_layer_1.T, hidden_diff_2)
        self.w1 += self.learning_rate * np.dot(self.input.T, hidden_diff_1)
4 实验结果及分析
4.1 实验结果
4.1.1 基于MindSpore的Softmax回归
4.1.1.1 准确率

可见经过20轮的训练,测试集准确率收敛于0.92左右。训练集和测试集准确率随训练轮数的变化曲线如下:

4.1.1.2 混淆矩阵

4.1.2 基于pytorch的Softmax回归
4.1.2.1 准确率


可见经过20轮的训练,测试集准确率收敛于0.92左右,这与MindSpore的性能较为相似。
4.1.2.2 混淆矩阵


4.1.3 基于MindSpore的前馈神经网络
4.1.3.1 准确率

基于MindSpore的前馈神经网络经过较少的轮数即可收敛,正确率为0.88左右。
4.1.3.2 混淆矩阵

4.1.4 基于pytorch的前馈神经网络
4.1.4.1 准确率

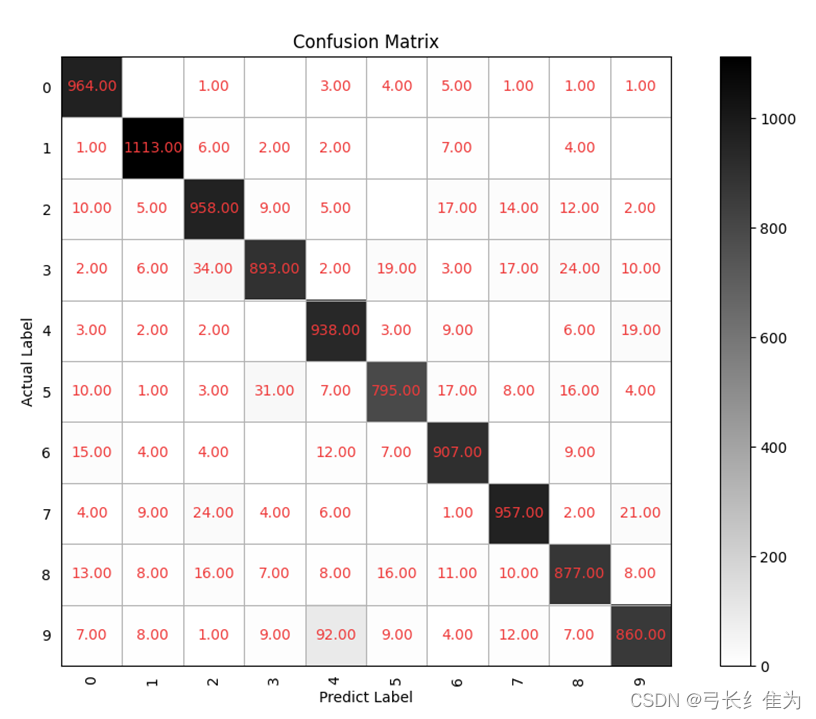
基于pytorch的前馈神经网络同样经过较少轮数即可收敛,准确率为92.6%左右,高于基于MindSpore的前馈神经网络。
4.1.4.2 混淆矩阵
4.2 结果分析与对比
下表列出了各模型的准确率对比情况:
| 模型 | 准确率 |
| 基于MindSpore的Softmax回归 | 92% |
| 基于pytorch的Softmax回归 | 92% |
| 基于MindSpore的前馈神经网络 | 88% |
| 基于pytorch的前馈神经网络 | 92.6% |
可见除了基于MindSpore的前馈神经网络,其余模型的准确率都在92%左右。通过实验发现,Softmax回归需要经过20轮左右才能收敛,而前馈神经网络在10轮之内即可收敛,所以前馈神经网络在运行时间上性能更优。此外若仔细观察各模型的混淆矩阵可以发现,将正确标签为9的误判为4、将正确标签为5的误判为3、正确标签为2的误判为8这几种误分类情况较为普遍,这是这些数字的手写体较为相近,容易混淆的缘故。
MSbp网络手写识别.py
# 导入相关依赖库
import os
import numpy as np
from matplotlib import pyplot as plt
import mindspore as ms
# context模块用于设置实验环境和实验设备
import mindspore.context as context
# dataset模块用于处理数据形成数据集
import mindspore.dataset as ds
# c_transforms模块用于转换数据类型
import mindspore.dataset.transforms as C
# vision.c_transforms模块用于转换图像,这是一个基于opencv的高级API
import mindspore.dataset.vision as CV
# 导入Accuracy作为评价指标
from mindspore.nn.metrics import Accuracy
# nn中有各种神经网络层如:Dense,ReLu
from mindspore import nn
# Model用于创建模型对象,完成网络搭建和编译,并用于训练和评估
from mindspore.train import Model
# LossMonitor可以在训练过程中返回LOSS值作为监控指标
from mindspore.train.callback import LossMonitor

# 设定运行模式为动态图模式,并且运行设备为昇腾芯片
context.set_context(mode=context.GRAPH_MODE, device_target='CPU')
# MindSpore内置方法读取MNIST数据集
ds_train = ds.MnistDataset(os.path.join(r'D:\Dataset\MNIST', "train"))
ds_test = ds.MnistDataset(os.path.join(r'D:\Dataset\MNIST', "test"))

print('训练数据集数量:', ds_train.get_dataset_size())
print('测试数据集数量:', ds_test.get_dataset_size())
# 该数据集可以通过create_dict_iterator()转换为迭代器形式,然后通过get_next()一个个输出样本
image = ds_train.create_dict_iterator().get_next()

print('图像长/宽/通道数:', image['image'].shape)
# 一共10类,用0-9的数字表达类别。
print('一张图像的标签样式:', image['label'])
DATA_DIR_TRAIN = "D:/Dataset/MNIST/train"  # 训练集信息
DATA_DIR_TEST = "D:/Dataset/MNIST/test"  # 测试集信息


def create_dataset(training=True, batch_size=128, resize=(28, 28), rescale=1 / 255, shift=-0.5, buffer_size=64):
    ds = ms.dataset.MnistDataset(DATA_DIR_TRAIN if training else DATA_DIR_TEST)

    # 定义改变形状、归一化和更改图片维度的操作。
    # 改为(28,28)的形状
    resize_op = CV.Resize(resize)
    # rescale方法可以对数据集进行归一化和标准化操作,这里就是将像素值归一到0和1之间,shift参数可以让值域偏移至-0.5和0.5之间
    rescale_op = CV.Rescale(rescale, shift)
    # 由高度、宽度、深度改为深度、高度、宽度
    hwc2chw_op = CV.HWC2CHW()

    # 利用map操作对原数据集进行调整
    ds = ds.map(input_columns="image", operations=[resize_op, rescale_op, hwc2chw_op])
    ds = ds.map(input_columns="label", operations=C.TypeCast(ms.int32))
    # 设定洗牌缓冲区的大小,从一定程度上控制打乱操作的混乱程度
    ds = ds.shuffle(buffer_size=buffer_size)
    # 设定数据集的batch_size大小,并丢弃剩余的样本
    ds = ds.batch(batch_size, drop_remainder=True)
    return ds

# 显示前10张图片以及对应标签,检查图片是否是正确的数据集
dataset_show = create_dataset(training=False)
data = dataset_show.create_dict_iterator().get_next()
images = data['image'].asnumpy()
labels = data['label'].asnumpy()

for i in range(1, 11):
    plt.subplot(2, 5, i)
    # 利用squeeze方法去掉多余的一个维度
    plt.imshow(np.squeeze(images[i]))
    plt.title('Number: %s' % labels[i])
    plt.xticks([])
plt.show()

# 利用定义类的方式生成网络,Mindspore中定义网络需要继承nn.cell。在init方法中定义该网络需要的神经网络层
# 在construct方法中梳理神经网络层与层之间的关系。
class ForwardNN(nn.Cell):
    def __init__(self):
        super(ForwardNN, self).__init__()
        self.flatten = nn.Flatten()
        self.relu = nn.ReLU()
        self.fc1 = nn.Dense(784, 512, activation='relu')
        self.fc2 = nn.Dense(512, 256, activation='relu')
        self.fc3 = nn.Dense(256, 128, activation='relu')
        self.fc4 = nn.Dense(128, 64, activation='relu')
        self.fc5 = nn.Dense(64, 32, activation='relu')
        self.fc6 = nn.Dense(32, 10, activation='softmax')

    def construct(self, input_x):
        output = self.flatten(input_x)
        output = self.fc1(output)
        output = self.fc2(output)
        output = self.fc3(output)
        output = self.fc4(output)
        output = self.fc5(output)
        output = self.fc6(output)
        return output

lr = 0.001
num_epoch = 8
momentum = 0.9

net = ForwardNN()
# 定义loss函数,改函数不需要求导,可以给离散的标签值,且loss值为均值
loss = nn.loss.SoftmaxCrossEntropyWithLogits(sparse=True, reduction='mean')
# 定义准确率为评价指标,用于评价模型
metrics = {"Accuracy": Accuracy(), "Confusion_matrix": nn.ConfusionMatrix(num_classes= 10)}
# 定义优化器为Adam优化器,并设定学习率
opt = nn.Adam(net.trainable_params(), lr)
# 生成验证集,验证机不需要训练,所以不需要repeat
ds_eval = create_dataset(False, batch_size=32)
# 模型编译过程,将定义好的网络、loss函数、评价指标、优化器编译
model = Model(net, loss, opt, metrics)
# 生成训练集
ds_train = create_dataset(True, batch_size=32)
#print("============== 开始训练 ==============")
# 训练模型,用loss作为监控指标,并利用昇腾芯片的数据下沉特性进行训练
model.train(num_epoch, ds_train, callbacks=[LossMonitor()], dataset_sink_mode=True)
# 使用测试集评估模型,打印总体准确率
metrics_result = model.eval(ds_eval)
res = metrics_result["Confusion_matrix"]

# 绘制混淆矩阵
classes = ['0', '1', '2', '3', '4', '5','6','7','8','9']
def plot_confusion_matrix(cm, title='Confusion Matrix'):
    plt.figure(figsize=(12, 8), dpi=100)
    np.set_printoptions(precision=2)
    # 混淆矩阵中每格的值
    ind_array = np.arange(len(classes))
    x, y = np.meshgrid(ind_array, ind_array)
    for x_val, y_val in zip(x.flatten(), y.flatten()):
        c = cm[y_val][x_val]
        if c > 0.001:
            plt.text(x_val, y_val, "%0.2f" % (c,), color='#EE3B3B', fontsize=10, va='center', ha='center')
    plt.imshow(cm, interpolation='nearest', cmap=plt.cm.binary)
    plt.title(title)
    plt.colorbar()
    xlocations = np.array(range(len(classes)))
    plt.xticks(xlocations, classes, rotation=90)
    plt.yticks(xlocations, classes)
    plt.ylabel('Actual Label')
    plt.xlabel('Predict Label')
    tick_marks = np.array(range(len(classes))) + 0.5
    plt.gca().set_xticks(tick_marks, minor=True)
    plt.gca().set_yticks(tick_marks, minor=True)
    plt.gca().xaxis.set_ticks_position('none')
    plt.gca().yaxis.set_ticks_position('none')
    plt.grid(True, which='minor', linestyle='-')
    plt.gcf().subplots_adjust(bottom=0.15)
    plt.show()

plot_confusion_matrix(res, title='Confusion Matrix')
print(metrics_result)
MSsoftmax手写识别.py
import mindspore
import struct
from sklearn.metrics import confusion_matrix
from mindspore.common.initializer import Normal
import mindspore.dataset.vision as cv
from IPython import display
import os
import numpy as np
from matplotlib import pyplot as plt
import mindspore.dataset as ds
import mindspore.dataset.transforms as C
from mindspore import nn

# 导入已下载的数据集
def load_mnist(path, kind='train'):
    # os.path.join()函数用于路径拼接文件路径
    labels_path = os.path.join(path, '%s-labels.idx1-ubyte' % kind)
    images_path = os.path.join(path, '%s-images.idx3-ubyte' % kind)

    # 读取训练集标签数据集
    with open(labels_path, 'rb') as lbpath:
        magic, n = struct.unpack('>II',lbpath.read(8))
        # 使用struct.unpack方法读取前两个数据。lbpath.read(8)表示一次从文件中读取8个字节
        # 这样读到的前两个数据分别是magic number(2049)和样本个数(60000)
        labels = np.fromfile(lbpath,dtype=np.uint8)
        # 读取标签,标签的数值在0~9之间

    # 读取训练集图片数据集
    with open(images_path, 'rb') as imgpath:
        magic, num, rows, cols = struct.unpack('>IIII',imgpath.read(16))
        # 使用struct.unpack方法读取前四个数据。lbpath.read(16)表示一次从文件中读取16个字节
        # 这样读到的前四个数据分别是magic number(2051)、图像数量(60000)、图像的高rows(28)、图像的宽columns(28)
        images = np.fromfile(imgpath,dtype=np.uint8).reshape(len(labels), 28, 28, 1)  # 设置图像形状,高度宽度均为28,通道数为1
    return images, labels
    # labels形状为(60000,)
    # images形状为(60000, 28, 28, 1)

# 创建一个迭代器类,作为GeneratorDataset的数据源
class FashionMnist():
    def __init__(self, path, kind):  # 定义数据初始化等操作,在实例化数据集对象时被调用
        self.data, self.label = load_mnist(path, kind)

    def __getitem__(self, index):  # 定义该函数后可使其支持随机访问,能够根据给定的索引值index,获取数据集中的数据并返回
        return self.data[index], self.label[index]

    def __len__(self):  # 返回数据集的样本数量
        return len(self.data)
    # 在完成自定义数据集类之后,可以通过GeneratorDataset接口按照用户定义的方式加载并访问数据集样本

# 将Fashion-MNIST数据集加载到内存中
def load_data_fashion_mnist(data_path, batch_size, resize=None, works=1):

    mnist_train = FashionMnist(data_path, kind='train')  # 读取训练集
    mnist_test = FashionMnist(data_path, kind='t10k')    # 读取测试集
    mnist_train = ds.GeneratorDataset(source=mnist_train, column_names=['image', 'label'],
                                      shuffle=False, python_multiprocessing=False)
    mnist_test = ds.GeneratorDataset(source=mnist_test, column_names=['image', 'label'],
                                     shuffle=False, python_multiprocessing=False)
    # 数据变换
    trans = [cv.Rescale(1.0 / 255.0, 0), cv.HWC2CHW()] # 数据做标准化处理,所得到的数值分布满足正态分布
    # 调整图像的像素大小。Rescale变换用于调整图像像素值的大小,包括两个参数:
    # rescale:缩放因子。shift:平移因子。图像的每个像素将根据这两个参数
    # 进行调整,输出的像素值为 outputi = inputi ∗ rescale+shift
    # HWC2CWH变换用于转换图像格式,(height, width, channel)转为(channel, height, width)
    type_cast_op = C.TypeCast(mindspore.int32)  # 将输入的Tensor转换为指定的数据类型
    if resize:
        trans.insert(0, cv.Resize(resize))  # 调整为给定的尺寸大小
    mnist_train = mnist_train.map(trans, input_columns=["image"])
    mnist_test = mnist_test.map(trans, input_columns=["image"])
    mnist_train = mnist_train.map(type_cast_op, input_columns=['label'])
    mnist_test = mnist_test.map(type_cast_op, input_columns=['label'])

    mnist_train = mnist_train.batch(batch_size, num_parallel_workers=works)
    mnist_test = mnist_test.batch(batch_size, num_parallel_workers=works)

    return mnist_train, mnist_test

batch_size = 256
mnist_train, mnist_test = load_data_fashion_mnist('D:/Dataset/MNIST' ,batch_size)

# nn.SequentialCell是一个有序的Cell容器。输入Tensor将按照定义的顺序通过所有Cell。
# 我们可以使用SequentialCell来快速组合构造一个神经网络模型
net = nn.SequentialCell([nn.Flatten(), nn.Dense(784, 10, weight_init=Normal(0.01, 0), bias_init='zero')])
# nn.Flatten将输入的X维度从[256,1,28,28]变成[256,784],则一个样本数据一行

# 损失函数SoftmaxCrossEntropyWithLogits,交叉熵损失函数中传递未规范化的预测,并同时计算softmax及其损失
loss = nn.SoftmaxCrossEntropyWithLogits(sparse=True, reduction='mean')
# 优化器SGD,学习率为0.1的随机梯度下降
optim = nn.SGD(net.trainable_params(), learning_rate=0.1)

# 累加器
class Accumulator:

    def __init__(self, n):
        self.data = [0.0] * n

    def add(self, *args):
        self.data = [a + float(b) for a, b in zip(self.data, args)]

    def reset(self):
        self.data = [0.0] * len(self.data)

    def __getitem__(self, idx):
        return self.data[idx]

# 计算预测正确的数量
def accuracy(y_hat, y):
    if len(y_hat.shape) > 1 and y_hat.shape[1] > 1:   # 判断y_hat是不是矩阵
        y_hat = y_hat.argmax(axis=1)                  # 得到每样本预测概率最大所属分类的下标
    cmp = y_hat.asnumpy() == y.asnumpy()              # y_hat.asnumpy() == y.asnumpy()返回的是一个布尔数组
    return float(cmp.sum())

# 绘制混淆矩阵
classes = ['0', '1', '2', '3', '4', '5','6','7','8','9']
def plot_confusion_matrix(cm, title='Confusion Matrix'):
    plt.figure(figsize=(12, 8), dpi=100)
    np.set_printoptions(precision=2)
    # 混淆矩阵中每格的值
    ind_array = np.arange(len(classes))
    x, y = np.meshgrid(ind_array, ind_array)
    for x_val, y_val in zip(x.flatten(), y.flatten()):
        c = cm[y_val][x_val]
        if c > 0.001:
            plt.text(x_val, y_val, "%0.2f" % (c,), color='#EE3B3B', fontsize=10, va='center', ha='center')
    plt.imshow(cm, interpolation='nearest', cmap=plt.cm.binary)
    plt.title(title)
    plt.colorbar()
    xlocations = np.array(range(len(classes)))
    plt.xticks(xlocations, classes, rotation=90)
    plt.yticks(xlocations, classes)
    plt.ylabel('Actual Label')
    plt.xlabel('Predict Label')
    tick_marks = np.array(range(len(classes))) + 0.5
    plt.gca().set_xticks(tick_marks, minor=True)
    plt.gca().set_yticks(tick_marks, minor=True)
    plt.gca().xaxis.set_ticks_position('none')
    plt.gca().yaxis.set_ticks_position('none')
    plt.grid(True, which='minor', linestyle='-')
    plt.gcf().subplots_adjust(bottom=0.15)
    plt.show()

# 计算在指定数据集上模型的精度;得到混淆矩阵
def evaluate_accuracy(net, data_iter):
    metric = Accumulator(2)         # 累加器,metric[0]记录正确预测数,metric[1]记录预测总数
    hunxiao=np.zeros((10,10))
    for X, y in data_iter:
        metric.add(accuracy(net(X), y), y.size)
        y_hat = net(X).argmax(axis=1)
        hunxiao+=confusion_matrix(y.asnumpy(),y_hat.asnumpy())
    plot_confusion_matrix(hunxiao,  title='Confusion Matrix')
    return metric[0] / metric[1]    # 正确预测数 / 预测总数

# 训练模型一个迭代周期
def train_epoch(net, train_iter, loss, optim):
    net_with_loss = nn.WithLossCell(net, loss)                # 将net与loss连接
    net_train = nn.TrainOneStepCell(net_with_loss, optim)     # 将net,loss,optim连接,生成训练模型
    metric = Accumulator(3)
    for X, y in train_iter:
        l = net_train(X, y)
        y_hat = net(X)
        metric.add(float(l.sum().asnumpy()),accuracy(y_hat, y), y.size)
    return  metric[0] / metric[2], metric[1] / metric[2]

# 训练模型
def trainer(net, train_iter, test_iter, loss, num_epochs, optim):
    global train_metrics, test_acc
    animator = Animator(xlabel='epoch', xlim=[1, num_epochs], ylim=[0.3, 0.9],
                        legend=['train accuracy', 'test accuracy'])
    for epoch in range(num_epochs):
        train_metrics = train_epoch(net, train_iter, loss, optim)
        aaa,train_accuracy=train_metrics
        train_accuracy=round(train_accuracy,4)
        test_acc = evaluate_accuracy(net, test_iter)
        print("第",epoch+1,"轮训练集正确率为",train_accuracy,";测试集正确率为",test_acc)
        animator.add(epoch + 1, train_metrics + (test_acc,))
    train_acc = train_metrics

def set_axes(axes, xlabel, ylabel, xlim, ylim, xscale, yscale, legend):
    axes.set_xlabel(xlabel)
    axes.set_ylabel(ylabel)
    axes.set_xscale(xscale)
    axes.set_yscale(yscale)
    axes.set_xlim(xlim)
    axes.set_ylim(ylim)
    if legend:
        axes.legend(legend)
    axes.grid()

class Animator:
    def __init__(self, xlabel=None, ylabel=None, legend=None, xlim=None,
                 ylim=None, xscale='linear', yscale='linear',
                 fmts=('-', 'm--', 'g-.', 'r:'), nrows=1, ncols=1,
                 figsize=(3.5, 2.5)):
        if legend is None:
            legend = []
        display.display_svg()
        self.fig, self.axes =plt.subplots(nrows, ncols, figsize=figsize)
        if nrows * ncols == 1:
            self.axes = [self.axes, ]
        self.config_axes = lambda: set_axes(
            self.axes[0], xlabel, ylabel, xlim, ylim, xscale, yscale, legend)
        self.X, self.Y, self.fmts = None, None, fmts

    def add(self, x, y):
        if not hasattr(y, "__len__"):
            y = [y]
        n = len(y)
        if not hasattr(x, "__len__"):
            x = [x] * n
        if not self.X:
            self.X = [[] for _ in range(n)]
        if not self.Y:
            self.Y = [[] for _ in range(n)]
        for i, (a, b) in enumerate(zip(x, y)):
            if a is not None and b is not None:
                self.X[i].append(a)
                self.Y[i].append(b)
        self.axes[0].cla()
        for x, y, fmt in zip(self.X, self.Y, self.fmts):
            self.axes[0].plot(x, y, fmt)
        self.config_axes()
        display.display(self.fig)
        display.clear_output(wait=True)

num_epochs = 20
trainer(net, mnist_train, mnist_test, loss, num_epochs, optim)
plt.show()
pytorchBP网络手写识别.py
# coding=gbk
import numpy as np
import os
from matplotlib import pyplot as plt
from sklearn.metrics import confusion_matrix
os.environ["KMP_DUPLICATE_LIB_OK"]="TRUE"
import torchvision
import torchvision.transforms as transforms
# 输入层:784个节点;隐藏层:三个隐藏层,每层20个节点
# 输出层:10个节点
class BP:
    def __init__(self):
        self.input = np.zeros((100, 784))   # 100 samples per round
        self.hidden_layer_1 = np.zeros((100, 20))
        self.hidden_layer_2 = np.zeros((100, 20))
        self.hidden_layer_3 = np.zeros((100, 20))
        self.output_layer = np.zeros((100, 10))
        self.w1 = 2 * np.random.random((784, 20)) - 1   # limit to (-1, 1)
        self.w2 = 2 * np.random.random((20, 20)) - 1
        self.w3 = 2 * np.random.random((20, 20)) - 1
        self.w4 = 2 * np.random.random((20, 10)) - 1
        self.error = np.zeros(10)
        self.learning_rate = 0.1

    def sigmoid(self, x):
        return 1 / (1 + np.exp(-x))

    def sigmoid_deri(self, x):
        return x * (1 - x)

    def forward_prop(self, data, label):   # label:100 X 10,data: 100 X 784
        self.input = data
        self.hidden_layer_1 = self.sigmoid(np.dot(self.input, self.w1))
        self.hidden_layer_2 = self.sigmoid(np.dot(self.hidden_layer_1, self.w2))
        self.hidden_layer_3 = self.sigmoid(np.dot(self.hidden_layer_2, self.w3))
        self.output_layer = self.sigmoid(np.dot(self.hidden_layer_3, self.w4))
        self.error = label - self.output_layer
        return self.output_layer

    def backward_prop(self):
        output_diff = self.error * self.sigmoid_deri(self.output_layer)
        hidden_diff_3 = np.dot(output_diff, self.w4.T) * self.sigmoid_deri(self.hidden_layer_3)
        hidden_diff_2 = np.dot(hidden_diff_3, self.w3.T) * self.sigmoid_deri(self.hidden_layer_2)
        hidden_diff_1 = np.dot(hidden_diff_2, self.w2.T) * self.sigmoid_deri(self.hidden_layer_1)
        # update
        self.w4 += self.learning_rate * np.dot(self.hidden_layer_3.T, output_diff)
        self.w3 += self.learning_rate * np.dot(self.hidden_layer_2.T, hidden_diff_3)
        self.w2 += self.learning_rate * np.dot(self.hidden_layer_1.T, hidden_diff_2)
        self.w1 += self.learning_rate * np.dot(self.input.T, hidden_diff_1)

def load_data():
    # 第一次运行时download=True
    datasets_train = torchvision.datasets.MNIST(root='D:/Dataset/pytorch/', train=True, transform=transforms.ToTensor(), download=True)
    datasets_test = torchvision.datasets.MNIST(root='D:/Dataset/pytorch/', train=False, transform=transforms.ToTensor(), download=True)
    data_train = datasets_train.data
    X_train = data_train.numpy()
    X_test = datasets_test.data.numpy()
    X_train = np.reshape(X_train, (60000, 784))
    X_test = np.reshape(X_test, (10000, 784))
    Y_train = datasets_train.targets.numpy()
    Y_test = datasets_test.targets.numpy()
    real_train_y = np.zeros((60000, 10))
    real_test_y = np.zeros((10000, 10))
    # each y has ten dimensions
    for i in range(60000):
        real_train_y[i, Y_train[i]] = 1
    for i in range(10000):
        real_test_y[i, Y_test[i]] = 1
    index = np.arange(60000)
    np.random.shuffle(index)

    X_train = X_train[index]
    real_train_y = real_train_y[index]
    X_train = np.int64(X_train > 0)
    X_test = np.int64(X_test > 0)
    return X_train, real_train_y, X_test, real_test_y

def bp_network():
    nn = BP()
    X_train, Y_train, X_test, Y_test = load_data()
    batch_size = 100
    epochs = 6000
    for epoch in range(epochs):
        start = (epoch % 600) * batch_size
        end = start + batch_size
        print(start, end)
        nn.forward_prop(X_train[start: end], Y_train[start: end])
        nn.backward_prop()
    return nn

# 绘制混淆矩阵
classes = ['0', '1', '2', '3', '4', '5','6','7','8','9']
def plot_confusion_matrix(cm, title='Confusion Matrix'):
    plt.figure(figsize=(12, 8), dpi=100)
    np.set_printoptions(precision=2)
    # 混淆矩阵中每格的值
    ind_array = np.arange(len(classes))
    x, y = np.meshgrid(ind_array, ind_array)
    for x_val, y_val in zip(x.flatten(), y.flatten()):
        c = cm[y_val][x_val]
        if c > 0.001:
            plt.text(x_val, y_val, "%0.2f" % (c,), color='#EE3B3B', fontsize=10, va='center', ha='center')
    plt.imshow(cm, interpolation='nearest', cmap=plt.cm.binary)
    plt.title(title)
    plt.colorbar()
    xlocations = np.array(range(len(classes)))
    plt.xticks(xlocations, classes, rotation=90)
    plt.yticks(xlocations, classes)
    plt.ylabel('Actual Label')
    plt.xlabel('Predict Label')
    tick_marks = np.array(range(len(classes))) + 0.5
    plt.gca().set_xticks(tick_marks, minor=True)
    plt.gca().set_yticks(tick_marks, minor=True)
    plt.gca().xaxis.set_ticks_position('none')
    plt.gca().yaxis.set_ticks_position('none')
    plt.grid(True, which='minor', linestyle='-')
    plt.gcf().subplots_adjust(bottom=0.15)
    plt.show()

def bp_test():
    nn = bp_network()
    sum = 0
    X_train, Y_train, X_test, Y_test = load_data()
    y=np.array(Y_test)
    y=np.argmax(y,axis=1)
    y_pre=[]
    for i in range(len(X_test)):
        res = nn.forward_prop(X_test[i], Y_test[i])
        res = res.tolist()
        index = res.index(max(res))
        y_pre.append(index)
        if Y_test[i, index] == 1:
            sum += 1
    print(confusion_matrix(y, y_pre))
    print('预测准确率:', sum / len(Y_test))
    plot_confusion_matrix(confusion_matrix(y, y_pre), title='Confusion Matrix')

if __name__ == '__main__':
    bp_test()
pytorchSoftmax手写识别.py
import numpy as np
import torch
from matplotlib import pyplot as plt
from sklearn.metrics import confusion_matrix
from torch import nn,optim
from torchvision import datasets,transforms
from torch.utils.data import DataLoader

# 训练集
train_data = datasets.MNIST(root="D:/Dataset/pytorch/",train = True, transform=transforms.ToTensor(), download = True )
# 测试集
test_data = datasets.MNIST(root="D:/Dataset/pytorch/",train = False,transform=transforms.ToTensor(),download = True)
# 批次大小
batch_size = 64
# 装载训练集
train_loader = DataLoader(dataset=train_data,batch_size=batch_size,shuffle=True)
# 装载测试集
test_loader = DataLoader(dataset=test_data,batch_size=batch_size,shuffle=True)

# 定义网络结构
class Net(nn.Module):
    def __init__(self):
        super(Net, self).__init__()  # 初始化
        self.fc1 = nn.Linear(784, 10)  # 784个输入10个输出
        self.softmax = nn.Softmax(dim=1)  # 激活函数 dim=1表示对第一个维度进行概率计算

    def forward(self, x):
        # torch.Size([64, 1, 28, 28]) -> (64,784)
        x = x.view(x.size()[0], -1)  # 4维变2维 (在全连接层做计算只能2维)
        x = self.fc1(x)  # 传给全连接层继续计算
        x = self.softmax(x)  # 使用softmax激活函数进行计算
        return x

# 定义模型
model = Net()
# 定义代价函数
mse_loss = nn.MSELoss()
# 定义优化器
optimizer = optim.SGD(model.parameters(),lr=0.5)
# 定义模型训练和测试的方法
def train():
    for i, data in enumerate(train_loader):
        # 获得一个批次的数据和标签
        inputs, labels = data
        # 获得模型预测结果(64,10)
        out = model(inputs)
        # to onehot 把数据标签变成独热编码
        labels = labels.reshape(-1, 1)  # 先把1维变成2维(64)-(64,1)
        # tensor.scatter(dim,index,src)
        # dim:对那个维度进行独热编码
        # index:要将src中对应的值放到tensor那个位置
        # src:插入index的数值
        one_hot = torch.zeros(inputs.shape[0], 10).scatter(1, labels, 1)
        # 计算loss   mse_loss的两个数据的shape要一致
        loss = mse_loss(out, one_hot)
        # 梯度清零
        optimizer.zero_grad()
        # 计算梯度
        loss.backward()
        # 修改权值
        optimizer.step()

# 绘制混淆矩阵
classes = ['0', '1', '2', '3', '4', '5','6','7','8','9']
def plot_confusion_matrix(cm, title='Confusion Matrix'):
    plt.figure(figsize=(12, 8), dpi=100)
    np.set_printoptions(precision=2)
    # 混淆矩阵中每格的值
    ind_array = np.arange(len(classes))
    x, y = np.meshgrid(ind_array, ind_array)
    for x_val, y_val in zip(x.flatten(), y.flatten()):
        c = cm[y_val][x_val]
        if c > 0.001:
            plt.text(x_val, y_val, "%0.2f" % (c,), color='#EE3B3B', fontsize=10, va='center', ha='center')
    plt.imshow(cm, interpolation='nearest', cmap=plt.cm.binary)
    plt.title(title)
    plt.colorbar()
    xlocations = np.array(range(len(classes)))
    plt.xticks(xlocations, classes, rotation=90)
    plt.yticks(xlocations, classes)
    plt.ylabel('Actual Label')
    plt.xlabel('Predict Label')
    tick_marks = np.array(range(len(classes))) + 0.5
    plt.gca().set_xticks(tick_marks, minor=True)
    plt.gca().set_yticks(tick_marks, minor=True)
    plt.gca().xaxis.set_ticks_position('none')
    plt.gca().yaxis.set_ticks_position('none')
    plt.grid(True, which='minor', linestyle='-')
    plt.gcf().subplots_adjust(bottom=0.15)
    plt.show()

def test():
    correct = 0
    y=[]
    y_pre=[]
    for i, data in enumerate(test_loader):
        # 获得一个批次的数据和标签
        inputs, labels = data
        # 获得模型预测结果(64,10)
        out = model(inputs)
        # 获得最大值,以及最大值所在的位置
        _, predicted = torch.max(out, 1)
        # 预测正确的数量
        correct += (predicted == labels).sum()
        y_pre.append(np.array(predicted).flatten().tolist())
        y.append(np.array(labels).flatten().tolist())
    y_pre = [n for a in y_pre for n in a]
    y = [n for a in y for n in a]
    print(confusion_matrix(y, y_pre))
    plot_confusion_matrix(confusion_matrix(y, y_pre), title='Confusion Matrix')
    print("Test acc:{0}".format(correct.item() / len(test_data)))

# 训练
for epoch in range(20):
    print("epoch:",epoch)
    train()
    test()
参考资料
https://www.cnblogs.com/Luv-GEM/p/10694471.html
python实现混淆矩阵

