❤echarts 南丁格尔玫瑰图的使用以及南丁格尔玫瑰图详细配置
1、认识
使用可以参考之前文章,会使用直接跳过1
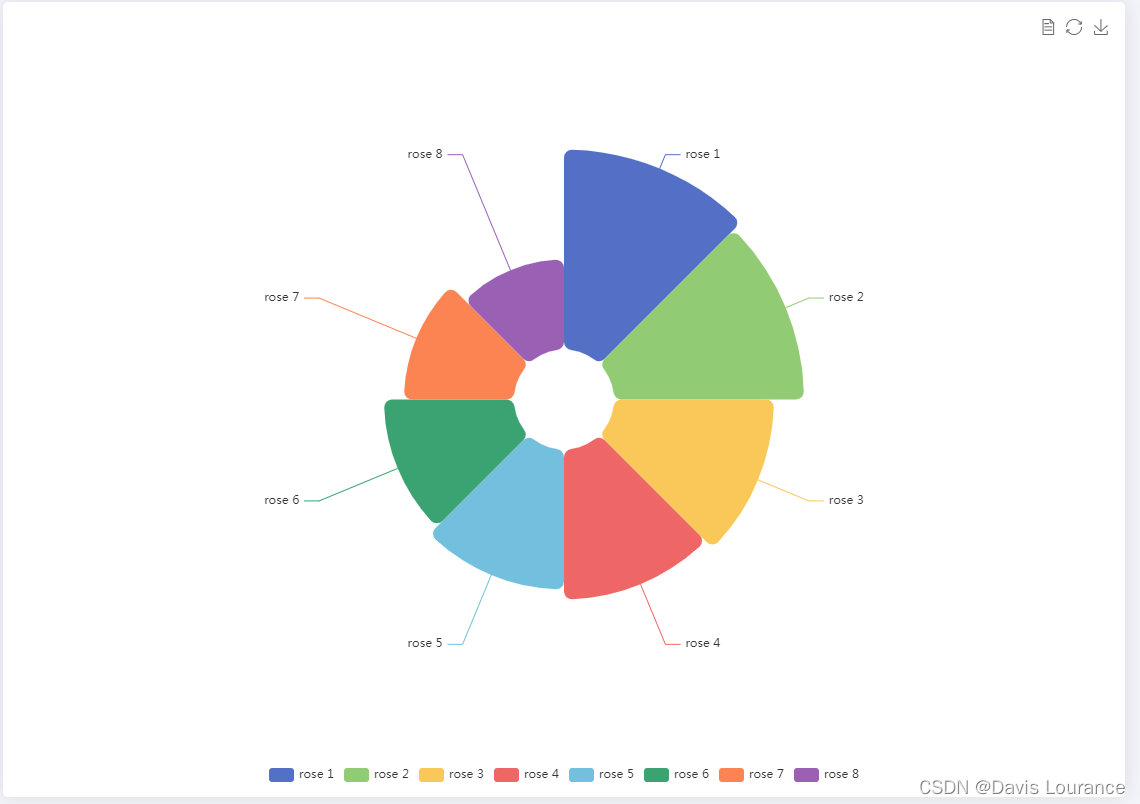
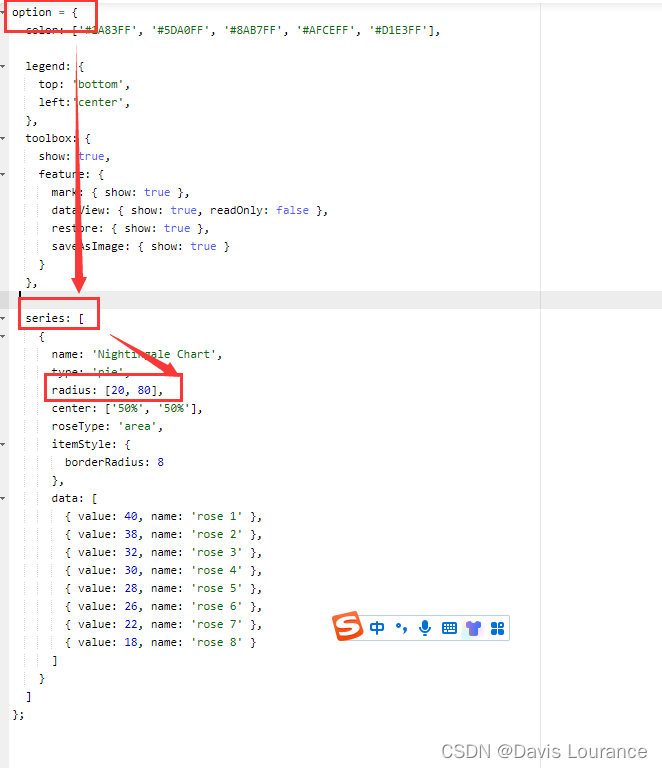
option = {
  legend: {
    top: 'bottom'
  },
  toolbox: {
    show: true,
    feature: {
      mark: { show: true },
      dataView: { show: true, readOnly: false },
      restore: { show: true },
      saveAsImage: { show: true }
    }
  },
  series: [
    {
      name: 'Nightingale Chart',
      type: 'pie',
      radius: [50, 250],
      center: ['50%', '50%'],
      roseType: 'area',
      itemStyle: {
        borderRadius: 8
      },
      data: [
        { value: 40, name: 'rose 1' },
        { value: 38, name: 'rose 2' },
        { value: 32, name: 'rose 3' },
        { value: 30, name: 'rose 4' },
        { value: 28, name: 'rose 5' },
        { value: 26, name: 'rose 6' },
        { value: 22, name: 'rose 7' },
        { value: 18, name: 'rose 8' }
      ]
    }
  ]
};
2、配置
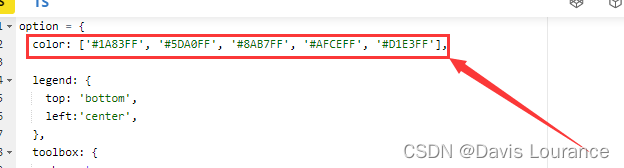
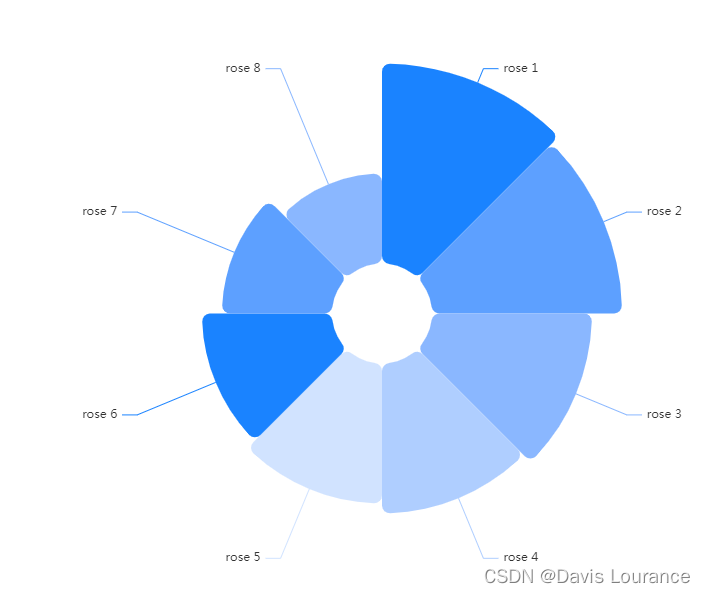
① 给每个圈配置自定义颜色
颜色设置在option 对象里面外层直接写一个数组
color: ['#1A83FF', '#5DA0FF', '#8AB7FF', '#AFCEFF', '#D1E3FF'],
② 更改圈的大小
调整option下series里面的redius【也可以借这个参数实现不同的内圈外圈和负向向里】
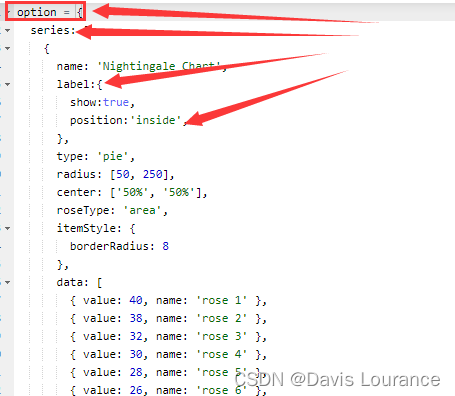
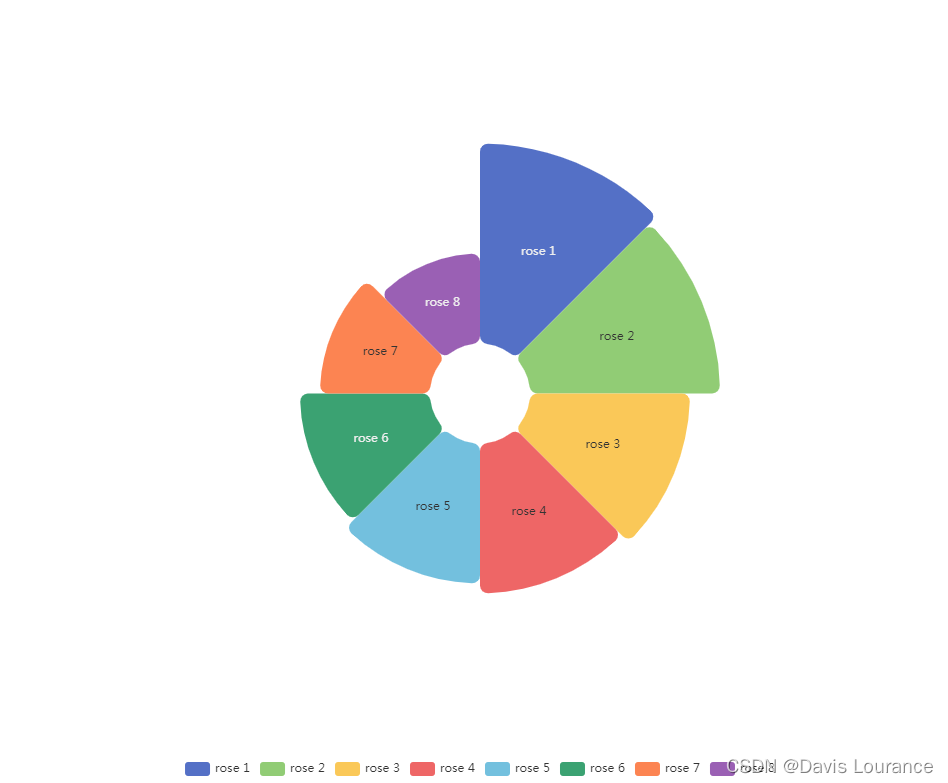
③ 更改提示文字展示的位置
在option下series下label 对位置进行设置
 label:{
   show:true,
   position:'inside', //inside 扇形图上 ,center 扇形图中间 ,  outside  扇形图外面
},
④ 更改文字大小和颜色
在option下series下label 里面添加一些具体参数
  position: 'center', // 数值显示在内部
  fontSize: 18,
  color: '#1890FF',
  fontWeight: 600,
  backgroundColor:'#fff', //
  width:68,

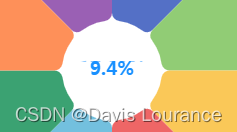
⑤ 修改提示文字的格式
在option下series下label 里面修改参数formatter
formatter: '{d}%', // 格式化数值百分比输出
⑥ ❤ 更改文字大小和颜色 过程出现文字重复并且遮盖不全的问题
在option下series下label 里面添加背景色和宽度 【解决文字重复并且遮盖不全问题】
  backgroundColor:'#fff', //
  width:68,
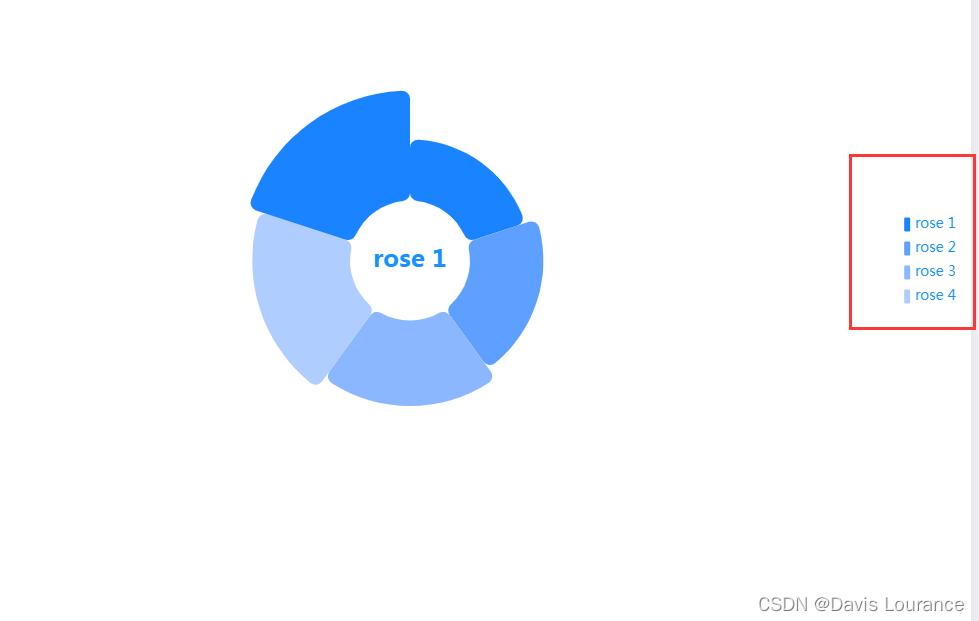
⑦ 更改legend图例想关信息
在option 下的legend 进行修改
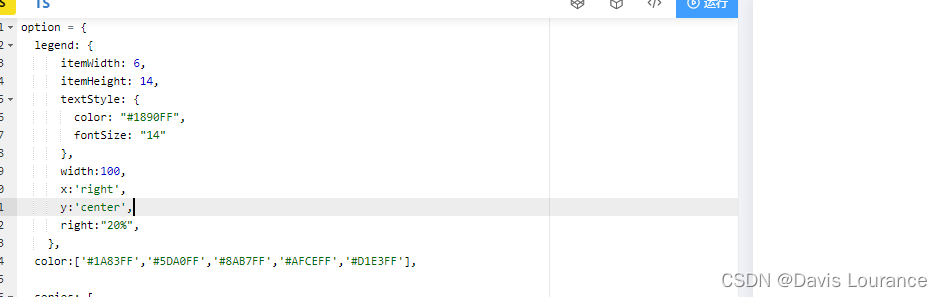
 legend: {
      itemWidth: 6,
      itemHeight: 14,
      textStyle: {
        color: "#1890FF",
        fontSize: "14"
      },
      width:100,
      x:'right',
      y:'center',
      right:"20%",
    },
其中参数如下:


![[POJ - 1080 ]Palindrome(区间DP)](https://img-blog.csdnimg.cn/772408e7a50247568aed3012fcf6d6e2.png)