文章目录
- MySQL 8.0 OCP (1Z0-908) 考点精析-性能优化考点1:sys.statement_analysis视图
- 视图sys.statement_analysis各列定义
- 视图sys.statement_analysis视图的定义
- 视图sys.statement_analysis各列解释
- 例题
- 例题解析
- 参考
MySQL 8.0 OCP (1Z0-908) 考点精析-性能优化考点1:sys.statement_analysis视图
通过系统性能视图sys.statement_analysis可以查看规范化后SQL语句的汇总统计信息。相当于MySQL Enterprise Monitor的“查询分析”视图。默认情况下,输出结果按总等待时间(max_latency)降序排序。
视图sys.statement_analysis各列定义
视图sys.statement_analysis的各列定义如下:
mysql> desc sys.statement_analysis;
+-----------------------+-----------------+------+-----+---------+-------+
| Field                 | Type            | Null | Key | Default | Extra |
+-----------------------+-----------------+------+-----+---------+-------+
| query                 | longtext        | YES  |     | NULL    |       |
| db                    | varchar(64)     | YES  |     | NULL    |       |
| full_scan             | varchar(1)      | NO   |     |         |       |
| exec_count            | bigint unsigned | NO   |     | NULL    |       |
| err_count             | bigint unsigned | NO   |     | NULL    |       |
| warn_count            | bigint unsigned | NO   |     | NULL    |       |
| total_latency         | varchar(11)     | YES  |     | NULL    |       |
| max_latency           | varchar(11)     | YES  |     | NULL    |       |
| avg_latency           | varchar(11)     | YES  |     | NULL    |       |
| lock_latency          | varchar(11)     | YES  |     | NULL    |       |
| cpu_latency           | varchar(11)     | YES  |     | NULL    |       |
| rows_sent             | bigint unsigned | NO   |     | NULL    |       |
| rows_sent_avg         | decimal(21,0)   | NO   |     | 0       |       |
| rows_examined         | bigint unsigned | NO   |     | NULL    |       |
| rows_examined_avg     | decimal(21,0)   | NO   |     | 0       |       |
| rows_affected         | bigint unsigned | NO   |     | NULL    |       |
| rows_affected_avg     | decimal(21,0)   | NO   |     | 0       |       |
| tmp_tables            | bigint unsigned | NO   |     | NULL    |       |
| tmp_disk_tables       | bigint unsigned | NO   |     | NULL    |       |
| rows_sorted           | bigint unsigned | NO   |     | NULL    |       |
| sort_merge_passes     | bigint unsigned | NO   |     | NULL    |       |
| max_controlled_memory | varchar(11)     | YES  |     | NULL    |       |
| max_total_memory      | varchar(11)     | YES  |     | NULL    |       |
| digest                | varchar(64)     | YES  |     | NULL    |       |
| first_seen            | timestamp(6)    | NO   |     | NULL    |       |
| last_seen             | timestamp(6)    | NO   |     | NULL    |       |
+-----------------------+-----------------+------+-----+---------+-------+
26 rows in set (0.00 sec)
视图sys.statement_analysis视图的定义
根据视图sys.statement_analysis的定义,可以看到数据主要是通过performance_schema.events_statements_summary_by_digest表取得的。
视图的定义如下:
mysql> show create view statement_analysis\G
*************************** 1. row ***************************
                View: statement_analysis
         Create View:
CREATE ALGORITHM=MERGE DEFINER=`mysql.sys`@`localhost` SQL SECURITY INVOKER VIEW `statement_analysis` (
    `query`,
    `db`,
    `full_scan`,
    `exec_count`,
    `err_count`,
    `warn_count`,
    `total_latency`,
    `max_latency`,
    `avg_latency`,
    `lock_latency`,
    `cpu_latency`,
    `rows_sent`,
    `rows_sent_avg`,
    `rows_examined`,
    `rows_examined_avg`,
    `rows_affected`,
    `rows_affected_avg`,
    `tmp_tables`,
    `tmp_disk_tables`,
    `rows_sorted`,
    `sort_merge_passes`,
    `max_controlled_memory`,
    `max_total_memory`,
    `digest`,
    `first_seen`,
    `last_seen`
)
    AS
        SELECT
            `sys`.`format_statement`(`performance_schema`.`events_statements_summary_by_digest`.`digest_text`)                                                                                              AS
            `query`,
            `performance_schema`.`events_statements_summary_by_digest`.`schema_name`                                                                                                                        AS
            `db`,
            if(((`performance_schema`.`events_statements_summary_by_digest`.`sum_no_good_index_used` > 0) OR(`performance_schema`.`events_statements_summary_by_digest`.
            `sum_no_index_used` > 0)), '*', '') AS `full_scan`,
            `performance_schema`.`events_statements_summary_by_digest`.`count_star`                                                                                                                         AS
            `exec_count`,
            `performance_schema`.`events_statements_summary_by_digest`.`sum_errors`                                                                                                                         AS
            `err_count`,
            `performance_schema`.`events_statements_summary_by_digest`.`sum_warnings`                                                                                                                       AS
            `warn_count`,
            format_pico_time(`performance_schema`.`events_statements_summary_by_digest`.`sum_timer_wait`)                                                                                                   AS
            `total_latency`,
            format_pico_time(`performance_schema`.`events_statements_summary_by_digest`.`max_timer_wait`)                                                                                                   AS
            `max_latency`,
            format_pico_time(`performance_schema`.`events_statements_summary_by_digest`.`avg_timer_wait`)                                                                                                   AS
            `avg_latency`,
            format_pico_time(`performance_schema`.`events_statements_summary_by_digest`.`sum_lock_time`)                                                                                                    AS
            `lock_latency`,
            format_pico_time(`performance_schema`.`events_statements_summary_by_digest`.`sum_cpu_time`)                                                                                                     AS
            `cpu_latency`,
            `performance_schema`.`events_statements_summary_by_digest`.`sum_rows_sent`                                                                                                                      AS
            `rows_sent`,
            round(ifnull((`performance_schema`.`events_statements_summary_by_digest`.`sum_rows_sent` / nullif(`performance_schema`.`events_statements_summary_by_digest`.
            `count_star`, 0)), 0), 0)          AS `rows_sent_avg`,
            `performance_schema`.`events_statements_summary_by_digest`.`sum_rows_examined`                                                                                                                  AS
            `rows_examined`,
            round(ifnull((`performance_schema`.`events_statements_summary_by_digest`.`sum_rows_examined` / nullif(`performance_schema`.
            `events_statements_summary_by_digest`.`count_star`, 0)), 0), 0)      AS `rows_examined_avg`,
            `performance_schema`.`events_statements_summary_by_digest`.`sum_rows_affected`                                                                                                                  AS
            `rows_affected`,
            round(ifnull((`performance_schema`.`events_statements_summary_by_digest`.`sum_rows_affected` / nullif(`performance_schema`.
            `events_statements_summary_by_digest`.`count_star`, 0)), 0), 0)      AS `rows_affected_avg`,
            `performance_schema`.`events_statements_summary_by_digest`.`sum_created_tmp_tables`                                                                                                             AS
            `tmp_tables`,
            `performance_schema`.`events_statements_summary_by_digest`.`sum_created_tmp_disk_tables`                                                                                                        AS
            `tmp_disk_tables`,
            `performance_schema`.`events_statements_summary_by_digest`.`sum_sort_rows`                                                                                                                      AS
            `rows_sorted`,
            `performance_schema`.`events_statements_summary_by_digest`.`sum_sort_merge_passes`                                                                                                              AS
            `sort_merge_passes`,
            format_bytes(`performance_schema`.`events_statements_summary_by_digest`.`max_controlled_memory`)                                                                                                AS
            `max_controlled_memory`,
            format_bytes(`performance_schema`.`events_statements_summary_by_digest`.`max_total_memory`)                                                                                                     AS
            `max_total_memory`,
            `performance_schema`.`events_statements_summary_by_digest`.`digest`                                                                                                                             AS
            `digest`,
            `performance_schema`.`events_statements_summary_by_digest`.`first_seen`                                                                                                                         AS
            `first_seen`,
            `performance_schema`.`events_statements_summary_by_digest`.`last_seen`                                                                                                                          AS
            `last_seen`
        FROM
            `performance_schema`.`events_statements_summary_by_digest`
        ORDER BY
            `performance_schema`.`events_statements_summary_by_digest`.`sum_timer_wait` DESC
character_set_client: utf8mb4
collation_connection: utf8mb4_0900_ai_ci
1 row in set (0.00 sec)
视图sys.statement_analysis各列解释
各列的含义如下:
| 列名 | 英文解释 | 中文解释 |
|---|---|---|
| query | The normalized statement string | 规范化的语句字符串 |
| db | The default database for the statement, or NULL if there is none | 语句的默认数据库,如果没有,则为NULL |
| full_scan | The total number of full table scans performed by occurrences of the statement | 执行的全表扫描的总数 |
| exec_count | The total number of times the statement has executed | 语句执行的总次数 |
| err_count | The total number of errors produced by occurrences of the statement | 语句执行所产生的错误总数。 |
| warn_count | The total number of warnings produced by occurrences of the statement | 语句执行所产生的警告总数。 |
| total_latency | The total wait time of timed occurrences of the statement | 语句执行总等待时间。 |
| max_latency | The maximum single wait time of timed occurrences of the statement | 语句执行最大单次等待时间。 |
| avg_latency | The average wait time per timed occurrence of the statement | 语句执行平均等待时间。 |
| lock_latency | The total time waiting for locks by timed occurrences of the statement | 语句执行总锁等待时间。 |
| cpu_latency | The time spent on CPU for the current thread | 当前线程在cpu上花费的时间 |
| rows_sent | The total number of rows returned by occurrences of the statement | 语句执行所返回的总行数 |
| rows_sent_avg | The average number of rows returned per occurrence of the statement | 语句单次执行平均返回的行数 |
| rows_examined | The total number of rows read from storage engines by occurrences of the statement | 语句执行从存储引擎读取的总行数 |
| rows_examined_avg | The average number of rows read from storage engines per occurrence of the statement | 语句单次执行从存储引擎读取的平均行数 |
| rows_affected | The total number of rows affected by occurrences of the statement | 语句执行影响的总行数 |
| rows_affected_avg | The average number of rows affected per occurrence of the statement | 语句单次执行影响的平均行数 |
| tmp_tables | The total number of internal in-memory temporary tables created by occurrences of the statement | 语句执行创建的内存中内部临时表的总数 |
| tmp_disk_tables | The total number of internal on-disk temporary tables created by occurrences of the statement | 语句执行创建的磁盘上内部临时表的总数 |
| rows_sorted | The total number of rows sorted by occurrences of the statement | 语句执行排序的总行数 |
| sort_merge_passes | The total number of sort merge passes by occurrences of the statement | 语句执行排序合并传递总数. |
| max_controlled_memory | The maximum amount of controlled memory (bytes) used by the statement 。This column was added in MySQL 8.0.31 | 语句使用的最大受控内存量(字节),在MySQL 8.0.31中添加 |
| max_total_memory | The maximum amount of memory (bytes) used by the statement。This column was added in MySQL 8.0.31 | 语句使用的最大内存量(字节),在MySQL 8.0.31中添加 |
| digest | The statement digest | 语句摘要 |
| first_seen | The time at which the statement was first seen | 语句的最初时间 |
| last_seen | The time at which the statement was most recently seen | 语句的最近时间 |
例题
Choose two.
Examine this statement and output:

mysql> SELECT ROW_NUMBER() OVER() AS QN,
query, exec_count, avg_latency, lock_latency
FROM sys.statement_analysis
ORDER BY exec_count;
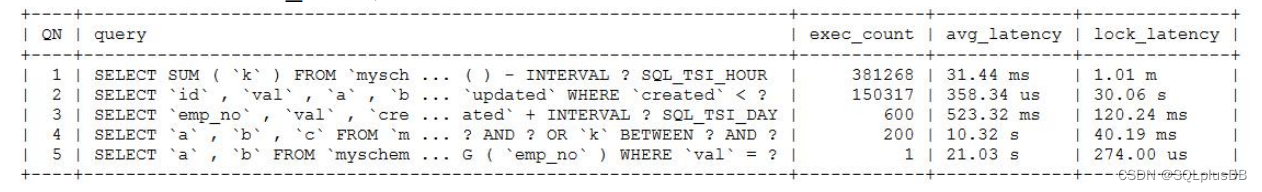
You must try to reduce query execution time.
Which two queries should you focus on?

A) QN=2
B) QN=3
C) QN=4
D) QN=1
E) QN=5
例题解析
根据题目我们要减少查询的执行时间。
实践中在调优的过程中,我们通常找的是总执行时间最长或者单次执行时间最长的SQL。
对于题目而言,我们要关注总等待时间,查询的总等待时间为exec_count * avg_latency ,lock等待时间为 lock_latency。
1 秒(s)=1000 毫秒(ms)
1 毫秒(ms)=1000 微秒(us)
各查询总等待时间:
QN=1  381268 * 31.44          =11987065.92 ms
QN=2  150317 * 358.34        =53864593.78 us = 53864.59378 ms
QN=3  600 * 523.32             = 313992 ms
QN=4  200 * 10.32 = 2064 s  = 2064000 ms
QN=5  1* 21.03  = 21.03 s    = 21030 ms
所以,我们可以看到总等待时间最长是QN=1和QN=4 。
参考答案: CD
参考
https://dev.mysql.com/doc/refman/8.0/en/sys-statement-analysis.html


![[网络安全] Windows Server 设置文件屏蔽防止黑客利用漏洞上传特定类型的非法文件](https://img-blog.csdnimg.cn/d4813e667de34d62bf9f376d52f80adc.png)