评分卡模型(二)基于评分卡模型的用户付费预测
小P:小H,这个评分卡是个好东西啊,那我这想要预测付费用户,能用它吗
小H:尽管用~
(本想继续薅流失预测的,但想了想这样显得我的业务太单调了,所以就改成了付费预测。哈哈~)
数据探索
导入相关库
import pandas as pd
import numpy as np
import math
from sklearn.model_selection import train_test_split,cross_val_score  # 数据分区库
import xgboost as xgb
from sklearn.metrics import accuracy_score, auc, confusion_matrix, f1_score, \
    precision_score, recall_score, roc_curve, roc_auc_score, precision_recall_curve  # 导入指标库
from imblearn.over_sampling import SMOTE  # 过抽样处理库SMOTE
import matplotlib.pyplot as plt
import prettytable  # 导入表格库
from pandas_profiling import ProfileReport # 自动eda
import sweetviz as sv # 自动eda
import matplotlib.pyplot as plt
from matplotlib import ticker
import seaborn as sns
import os
import shutil
import toad
from sklearn.model_selection import GridSearchCV
from sklearn.model_selection import learning_curve
from sklearn.model_selection import ShuffleSplit
from toad.plot import  bin_plot, badrate_plot
from sklearn.preprocessing import LabelEncoder
from collections import defaultdict
from sklearn.linear_model import LogisticRegression
from scipy.stats import scoreatpercentile
from toad.scorecard import ScoreCard
%matplotlib inline
pd.set_option('display.max_columns', None) # 显示所有列
# 风格设置
plt.rcParams['font.sans-serif'] = ['SimHei']  # 设置中文
sns.set(style="ticks") # 设置风格

# 导入自定义模块
import sys
sys.path.append("/Users/heinrich/Desktop/Heinrich-blog/数据分析使用手册")
from keyIndicatorMapping import *
数据准备
上述自定义模块
keyIndicatorMapping如果有需要的同学可关注公众号HsuHeinrich,回复【数据挖掘-自定义函数】自动获取~
以下数据如果有需要的同学可关注公众号HsuHeinrich,回复【数据挖掘-评分卡02】自动获取~
# 读取数据
raw_data = pd.read_csv('train_set.csv')  # 读取数据文件
raw_data.head()

# 生成好坏定义列
raw_data['target']=1-raw_data['y'] # 1表示bad客户(即未购买),0表示dood客户(即购买了)
raw_data.drop('y', axis=1, inplace=True)
# 定义id列
ids_col = ['ID']
# 定义排除的特征列:一般包括ID列、日期列、目标列
ex_lis = ['ID', 'target']
# 定义排除列不含y
ex_lis_noy = ['ID']
# 定义y列
y_col = 'target'
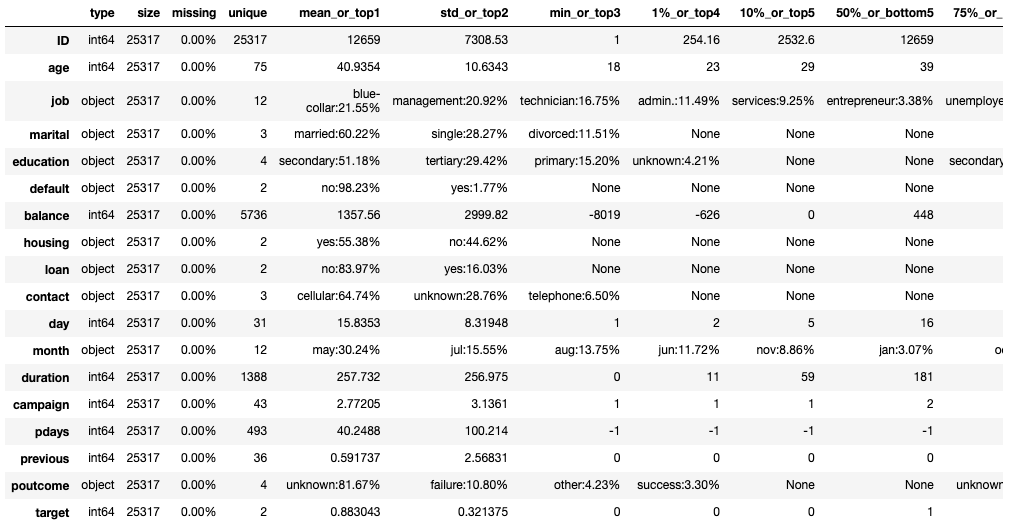
# 查看变量统计信息
toad.detector.detect(raw_data)
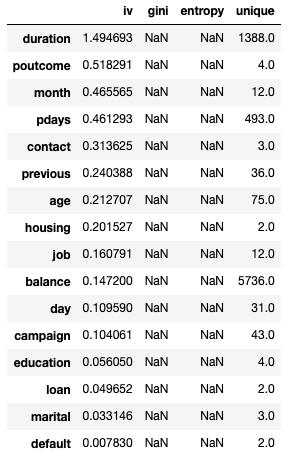
# 查看变量价值信息
toad.quality(raw_data.drop(ex_lis_noy, axis=1), y_col, iv_only=True)
# 数据审查
na_count = raw_data.isnull().any().sum() # 缺失值样本量
n_samples, n_features = raw_data.shape  # 总样本量,总特征数
print('samples: {0}| features: {1} | na count: {2}'.format(n_samples, n_features, na_count))
samples: 25317| features: 18 | na count: 0
特征工程
样本拆分
# 样本拆分:训练样本、测试样本
train, test = train_test_split(
    raw_data, test_size=.3, random_state=0)
特征初筛
# 缺失率>0.7,IV<0.1(一般认为iv低于0.1的特征区分度较弱),相关系数>0.7
train_s, drop_lst= toad.selection.select(train, train[y_col],
                                                   empty=0.7, iv=0.1,
                                                   corr=0.7,
                                                   return_drop=True,
                                                   exclude=ex_lis)
print("keep:", train_s.shape[1],
      "drop empty:", len(drop_lst['empty']),
      "drop iv:", len(drop_lst['iv']),
      "drop corr:", len(drop_lst['corr']))
keep: 14 drop empty: 0 drop iv: 4 drop corr: 0
变量分箱
# 得到切分节点 卡方分箱
combiner = toad.transform.Combiner()
combiner.fit(train_s, train_s[y_col], method='chi',
                min_samples=0.05, exclude=ex_lis)
# 导出箱的节点
bins = combiner.export()
# 变量分箱
train_t = combiner.transform(train_s)
test_t = combiner.transform(test[train_s.columns])
print(bins)
{'age': [], 'job': [['student', 'retired'], ['unemployed', 'management'], ['self-employed', 'admin.', 'unknown', 'technician'], ['services', 'housemaid'], ['blue-collar', 'entrepreneur']], 'balance': [-45, 61, 874, 1693], 'housing': [['no'], ['yes']], 'contact': [['cellular'], ['telephone'], ['unknown']], 'day': [5, 10, 17, 21, 28], 'month': [['mar', 'dec', 'sep', 'oct', 'apr', 'feb'], ['jan', 'aug', 'nov', 'jun', 'jul', 'may']], 'duration': [75, 114, 206, 366, 654], 'campaign': [2, 3, 4, 5, 8], 'pdays': [9, 211], 'previous': [1, 3], 'poutcome': [['success', 'other', 'failure', 'unknown']]}
WOE编码
w = toad.transform.WOETransformer()
#对WOE的值进行转化,映射到原数据集上。对训练集用fit_transform,测试集用transform.
train_w = w.fit_transform(train_t, train_t[y_col],
                                      exclude=ex_lis)
test_w = w.transform(test_t[train_t.columns])
data = pd.concat([train_w, test_w])
二次筛选
# psi筛选
np.seterr(divide='ignore',invalid='ignore') # 防止0/0产生的invalid value
psi_df = toad.metrics.PSI(train_w, test_w).sort_values(0)
psi_df = psi_df.reset_index()
psi_df = psi_df.rename(columns = {'index': 'feature', 0: 'psi'})
col_keep = list(set(list(psi_df[psi_df.psi<0.02].feature)).union(set(ex_lis))) # 保留低psi特征和不参与特征的并集
train_psi = train_w[col_keep]

print("keep:", train_psi.shape[1])
keep: 14
# 因为特征WOE编码后,部分变量的IV变低,且整体相关性变大。故再次进行特征筛选
train_psi_s2, drop_lst = toad.selection.select(train_psi,
                                               train_psi[y_col],
                                               empty=0.7,
                                               iv=0.1,
                                               corr=0.7,
                                               return_drop=True,
                                               exclude=ex_lis)
print("keep:", train_psi_s2.shape[1],
      "drop empty:", len(drop_lst['empty']),
      "drop iv:", len(drop_lst['iv']),
      "drop corr:", len(drop_lst['corr']))
keep: 9 drop empty: 0 drop iv: 4 drop corr: 1
# 逐步回归筛选变量
train_stp = toad.selection.stepwise(train_psi_s2,
                                                  train_psi_s2[y_col],
                                                  exclude=ex_lis,
                                                  direction='both',
                                                  criterion='aic',
                                                  estimator='ols',
                                              intercept=False)

print("keep:", train_stp.shape[1])
keep: 9
生成最终数据集
test_stp = test_w[train_stp.columns]
data_finall = pd.concat([train_stp, test_stp])
print(data_finall.shape)
(25317, 9)
数据建模
模型训练
# 样本拆分
X, y = data_finall.drop(ex_lis, axis=1), data_finall[y_col]
X_train, y_train = train_stp.drop(ex_lis, axis=1), train_stp[y_col]
X_test, y_test = test_stp.drop(ex_lis, axis=1), test_stp[y_col]
# 模型训练
model_lr = LogisticRegression(C=0.1, class_weight='balanced')
model_lr.fit(X_train, y_train)
LogisticRegression(C=0.1, class_weight='balanced')
模型估
- 核心指标评估
model_confusion_metrics(model_lr, X_test, y_test, 'test')
model_core_metrics(model_lr, X_test, y_test, 'test')
confusion matrix for test
 +----------+--------------+--------------+
|          | prediction-0 | prediction-1 |
+----------+--------------+--------------+
| actual-0 |     5336     |     1362     |
| actual-1 |     152      |     746      |
+----------+--------------+--------------+
core metrics for test
 +-------+----------+-----------+--------+-------+-------+
|  auc  | accuracy | precision | recall |   f1  |   ks  |
+-------+----------+-----------+--------+-------+-------+
| 0.881 |  0.801   |   0.972   | 0.797  | 0.876 | 0.631 |
+-------+----------+-----------+--------+-------+-------+
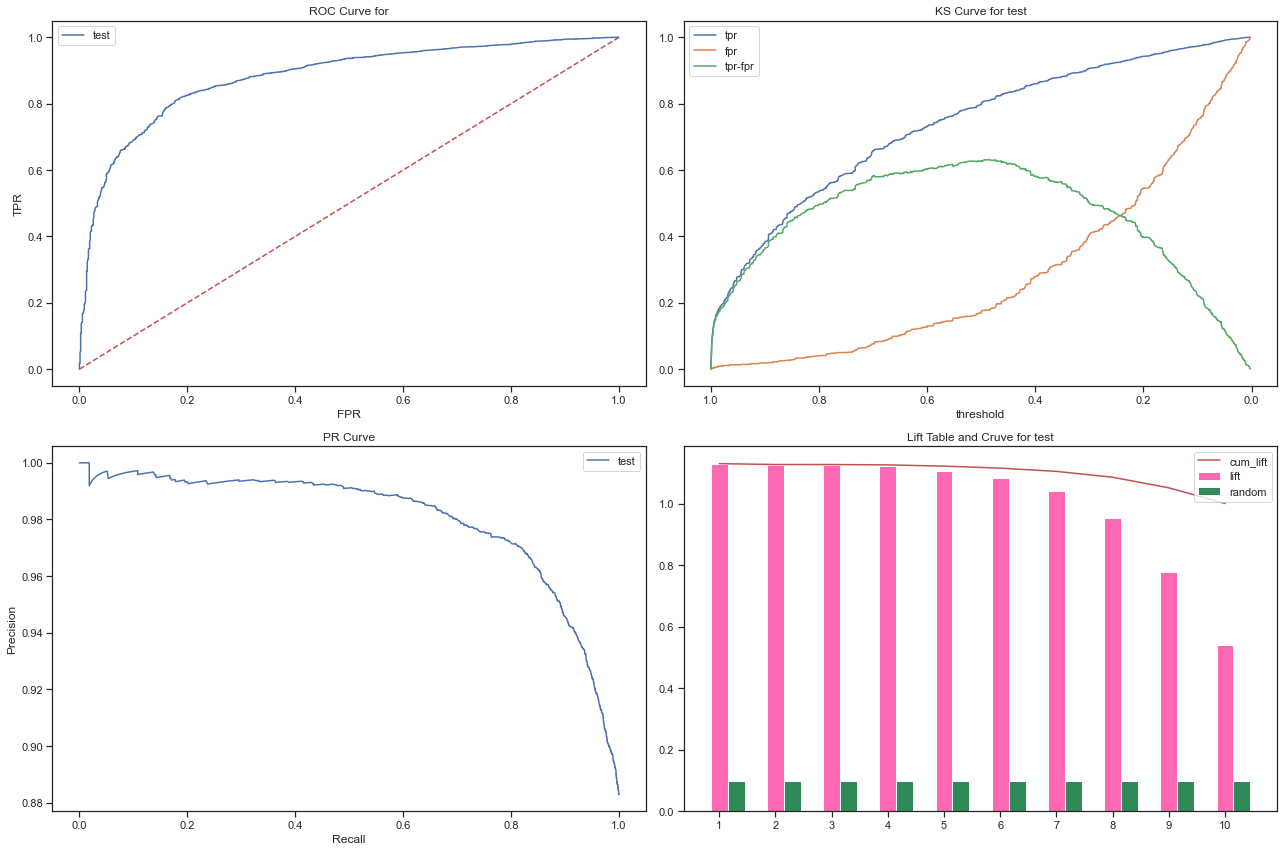
- 模型区分与排序能力评估
fig = plt.figure(figsize=(18,12))
plt.subplot(221)
plot_roc(model_lr, X_test, y_test, name='test')
plt.subplot(222)
plot_ks(model_lr, X_test, y_test, name='test')
plt.subplot(223)
plot_pr(model_lr, X_test, y_test, name='test')
plt.subplot(224)
plot_lift(model_lr, X_test, y_test, name='test')
plt.tight_layout()
plt.show()
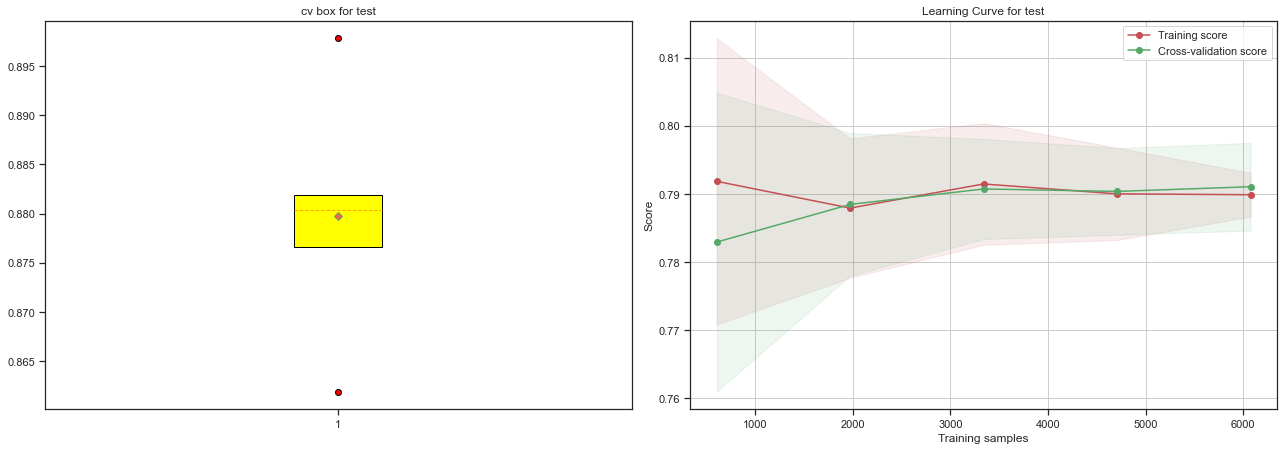
- 模型泛化能力评估
fig = plt.figure(figsize=(18,12))
plt.subplot(221)
plot_cv_box(model_lr, X_test, y_test, name='test')
plt.subplot(222)
plot_learning_curve(model_lr, X_test, y_test, name='test')
plt.tight_layout()
plt.show()
- 模型稳定性评估
# 模型PSI:小于10%,则无需更新模型;10%-20%, 需检查变化原因,加强监控频率;大于20%,则模型需要迭代
mpsi = model_psi(model_lr, X_train, X_test)
print('模型PSI:',mpsi)
模型PSI: 0.20931994818791816
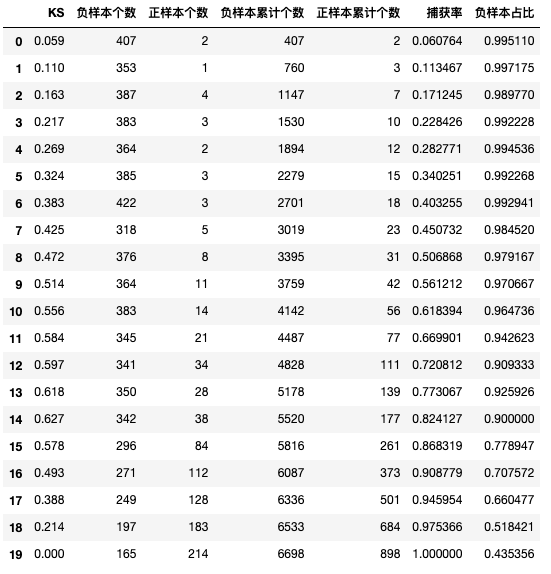
- 模型捕获报告评估
# 模型捕获率报告
y_test_prob = model_lr.predict_proba(X_test)[:, 1]
df_capture = capture_table(y_test_prob, y_test)
df_capture.columns=['KS', '负样本个数', '正样本个数', '负样本累计个数', '正样本累计个数', '捕获率', '负样本占比']
df_capture
结果展示
评分卡
# 计算odds
bad_total=raw_data[y_col].sum()
good_total=raw_data.shape[0]-bad_total
odds=round(bad_total/good_total,2)
base_odds=round(good_total/bad_total,0)
print('bad_total:{0}\ngood_total:{1}\nodds:{2}\nbase_odds:{3}\n'.format(bad_total,good_total,odds,base_odds))
bad_total:22356
good_total:2961
odds:7.55
base_odds:0.0
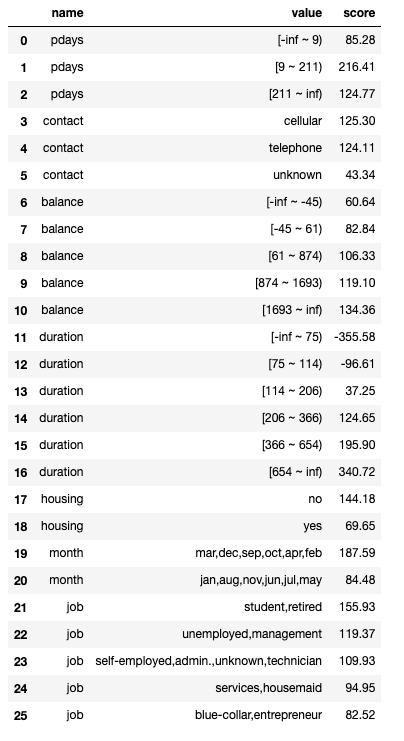
# 生成评分报告 # 注意ScoreCard方法里求解A=𝑃0-𝐵∗𝑙𝑜𝑔(𝑜𝑑𝑑𝑠)。因此这里的base_odds使用好坏比,即(1-p)/p
card = ScoreCard(combiner=combiner,
                    transer=w, C=0.1,
                    class_weight='balanced',
                    base_score=600,
                    base_odds=1/8,
                    pdo=60,
                    rate=2)
card.fit(X_train, y_train)
# 输出标准评分卡
final_card = card.export(to_frame=True)
final_card
def get_score(X, card):
    '''
    X:X数据集
    card:评分卡对象名

    return:增加分值列的df
    '''
    df_score=pd.DataFrame(card.predict(X), index=X.index, columns=["score"])
    df_data_score = pd.concat([X,df_score], axis=1)
    return df_data_score

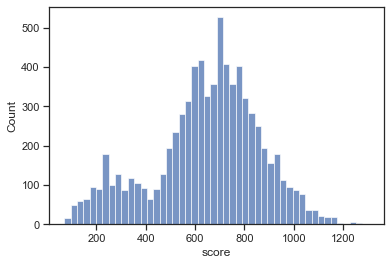
final_data_score=get_score(test, card)
# 得分的直方图
sns.histplot(final_data_score['score'])
plt.show()
评分卡区分能力评估
fig = plt.figure(figsize=(18,12))
plt.subplot(221)
plot_score_hist(final_data_score, y_col, 'score')
plt.subplot(222)
plot_lorenz(final_data_score, y_col, 'score')
plt.tight_layout()
plt.show()
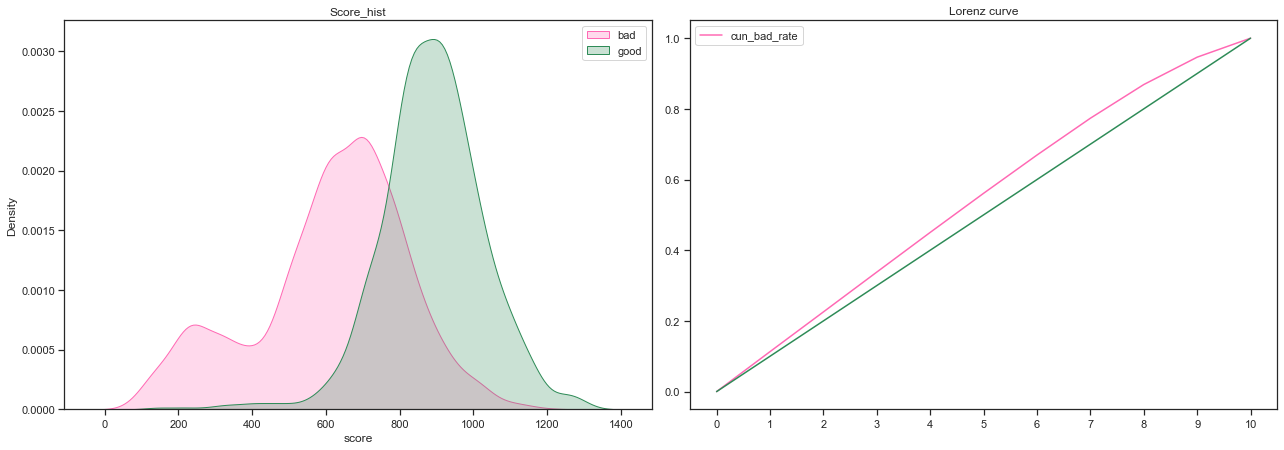
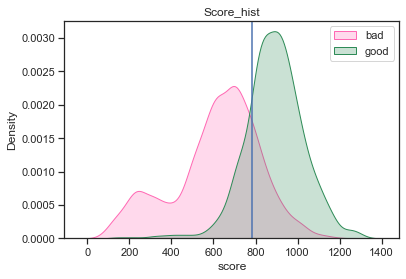
- 好坏客户的分布重合度较低,评分卡区分能力较好
- 洛伦兹曲线较平缓,区分能力一般
确定评分卡cutoff点
%%time

# 搜索cutoff点
print('{:*^60}'.format('cutoff search result'))
_, cutoff_score=search_cutoff(final_data_score,y_col,'score')
print('{:*^60}'.format('set cutoff result'))
# 设定cutoff点,衡量有效性
matrix_df=rule_verify(final_data_score,y_col,'score',cutoff_score)
********************cutoff search result********************
最大KS值:0.631
KS最大的分数:783
*********************set cutoff result**********************
拒绝准确率:0.971
查全率:0.809
误伤率:0.178
规则拒绝率:0.734
CPU times: user 1min 4s, sys: 453 ms, total: 1min 4s
Wall time: 1min 5s
# 查看cutoff结果
plot_score_hist(final_data_score, y_col, 'score', cutoff=cutoff_score)
plt.show()
用户得分雷达图
# 生成评分明细
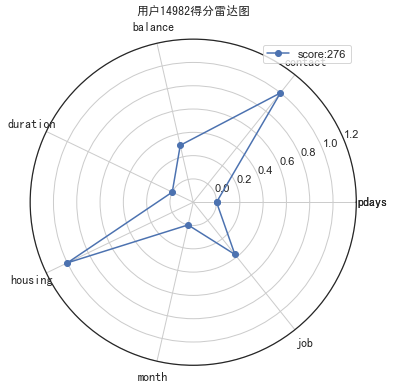
final_data_score_detail = card.predict(test, return_sub=True)[1]
final_data_score_detail['score'] = final_data_score_detail[list(final_card['name'].unique())].sum(axis=1)
# 归一化处理
max_min_scaler = lambda x : (x-np.min(x))/(np.max(x)-np.min(x))
final_data_score_detail_scaler = final_data_score_detail.copy()
final_data_score_detail_scaler.iloc[:,:-1] = final_data_score_detail_scaler.iloc[:,:-1].apply(max_min_scaler)
# 画布基本设置
fig = plt.figure(figsize=(6,6))  # 建立画布
ax = fig.add_subplot(111, polar=True)  # 增加子网格,注意polar参数
labels = final_card['name'].unique()  # 设置要展示的数据标签
cor_list = ['b', 'g', 'r', 'c', 'm', 'y', 'k', 'w']  # 定义不同类别的颜色
angles = np.linspace(0, 2 * np.pi, len(labels), endpoint=False)  # 计算各个区间的角度
angles = np.concatenate((angles, [angles[0]]))  # 建立相同首尾字段以便于闭合
labels = np.concatenate((labels,[labels[0]]))   # 新版本增加,对labels进行封闭
# 画雷达图
i = 14982
score = int(final_data_score_detail_scaler.loc[i]['score'])
data_tmp = np.array(final_data_score_detail_scaler.loc[i])[0:-1]  # 获得对应类数据
data = np.concatenate((data_tmp, [data_tmp[0]]))  # 建立相同首尾字段以便于闭合
ax.plot(angles, data, 'o-', c=cor_list[0], label=f'score:{score}')  # 画线
# 设置图像显示格式
ax.set_thetagrids(angles * 180 / np.pi, labels, fontproperties="SimHei")  # 设置极坐标轴
ax.set_title(f"用户{i}得分雷达图", fontproperties="SimHei")  # 设置标题放置
ax.set_rlim(-0.2, 1.2)  # 设置坐标轴尺度范围
plt.legend(loc=0)  # 设置图例位置
plt.show()
总结
只需要定义好什么是好人,什么是坏人,就可以按照标准流程构建评分卡了,是不是很方便~
共勉~
