文章目录
- 专栏导读
- 1、梯度下降法原理
- 2、梯度下降法原理代码实现
- 3、sklearn内置模块实现
专栏导读
✍ 作者简介:i阿极,CSDN Python领域新星创作者,专注于分享python领域知识。
✍ 本文录入于《数据分析之术》,本专栏精选了经典的机器学习算法进行讲解,针对大学生、初级数据分析工程师精心打造,对机器学习算法知识点逐一击破,不断学习,提升自我。
✍ 订阅后,可以阅读《数据分析之术》中全部文章内容,详细介绍数学模型及原理,带领读者通过模型与算法描述实现一个个案例。
✍ 还可以订阅基础篇《数据分析之道》,其包含python基础语法、数据结构和文件操作,科学计算,实现文件内容操作,实现数据可视化等等。
✍ 其他专栏:《数据分析案例》 ,《机器学习案例》
1、梯度下降法原理
梯度下降法是一种常见的优化方法,常用于求解损失函数最小化的问题。在线性回归模型中,我们可以使用梯度下降法来求解使得模型损失函数最小的模型参数。

梯度下降法的基本思想是沿着当前位置梯度的反方向移动一小步,以期望能够到达函数的最小值点。
具体来说,我们假设
f
(
θ
)
f(\theta)
f(θ)表示模型的损失函数,其中
θ
\theta
θ是模型的参数向量,损失函数的梯度为
∇
f
(
θ
)
\nabla f(\theta)
∇f(θ),那么梯度下降法的更新公式可以表示为:
θ = θ − η ∇ f ( θ ) \theta = \theta - \eta \nabla f(\theta) θ=θ−η∇f(θ)
其中 η \eta η为学习率,表示更新步长的大小,需要手动指定。梯度下降法的过程中,我们从一个随机的初始参数向量 θ 0 \theta_0 θ0开始,不断迭代,根据上式不断更新参数向量,直到达到最小化损失函数的要求,即:
f ( θ t + 1 ) − f ( θ t ) < ϵ f(\theta_{t+1}) - f(\theta_t) < \epsilon f(θt+1)−f(θt)<ϵ
其中 t t t表示迭代次数, ϵ \epsilon ϵ表示收敛的阈值,通常取一个很小的数值,比如 1 0 − 4 10^{-4} 10−4。
在线性回归中,损失函数通常采用平方误差损失函数:
L ( θ ) = 1 2 n ∑ i = 1 n ( h θ ( x ( i ) ) − y ( i ) ) 2 L(\theta) = \frac{1}{2n} \sum_{i=1}^n (h_{\theta}(x^{(i)}) - y^{(i)})^2 L(θ)=2n1∑i=1n(hθ(x(i))−y(i))2
其中 h θ ( x ( i ) ) h_{\theta}(x^{(i)}) hθ(x(i))为模型对第 i i i个样本的预测值, y ( i ) y^{(i)} y(i)为第 i i i个样本的真实值。对该损失函数求梯度,我们得到:
∇ L ( θ ) = 1 n ∑ i = 1 n ( h θ ( x ( i ) ) − y ( i ) ) x ( i ) \nabla L(\theta) = \frac{1}{n} \sum_{i=1}^n (h_{\theta}(x^{(i)}) - y^{(i)}) x^{(i)} ∇L(θ)=n1∑i=1n(hθ(x(i))−y(i))x(i)
将该梯度代入梯度下降法的更新公式中,就可以求得线性回归模型的参数向量 θ \theta θ。
2、梯度下降法原理代码实现
我们来用Python实现一个线性回归模型,使用梯度下降法来最小化成本函数。
首先,我们需要导入必要的库:
import numpy as np
import pandas as pd
import matplotlib.pyplot as plt
然后,我们生成一个模拟数据集。这里我们使用numpy库的random.randn()函数生成100个样本数据,其中的真实关系是y=3x+2,同时为了模拟真实情况,我们在y上加上了一些噪声:
np.random.seed(0)
X = 2 * np.random.randn(100, 1)
y = 6 + 3 * X + np.random.randn(100, 1)
接下来,我们需要定义成本函数和梯度下降函数。成本函数采用均方误差(MSE)的形式:
def compute_cost(X, y, theta):
    m = len(y)
    predictions = X.dot(theta)
    cost = 1/(2*m) * np.sum(np.square(predictions-y))
    return cost
梯度下降函数则需要不断迭代,不断更新theta参数,直到成本函数最小化。迭代次数、学习率等超参数需要手动设置:
def gradient_descent(X, y, theta, learning_rate, iterations):
    m = len(y)
    cost_history = np.zeros(iterations)
    theta_history = np.zeros((iterations, 2))
    for i in range(iterations):
        predictions = X.dot(theta)
        error = predictions - y
        gradient = 1/m * X.T.dot(error)
        theta = theta - learning_rate * gradient
        theta_history[i,:] = theta.T
        cost_history[i] = compute_cost(X, y, theta)
    return theta, cost_history, theta_history
最后,我们需要将生成的数据集进行可视化,并且调用梯度下降函数来训练模型:
# 添加截距列
X_b = np.c_[np.ones((len(X), 1)), X]

# 定义初始theta值和超参数
theta = np.random.randn(2,1)
learning_rate = 0.1
iterations = 1000

# 训练模型
theta, cost_history, theta_history = gradient_descent(X_b, y, theta, learning_rate, iterations)
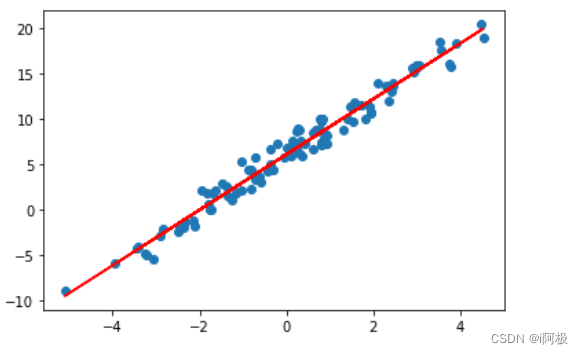
绘制模型拟合直线和数据点:
plt.scatter(X, y)
plt.plot(X, X_b.dot(theta), 'r')
plt.show()
绘制成本函数随迭代次数变化的曲线:
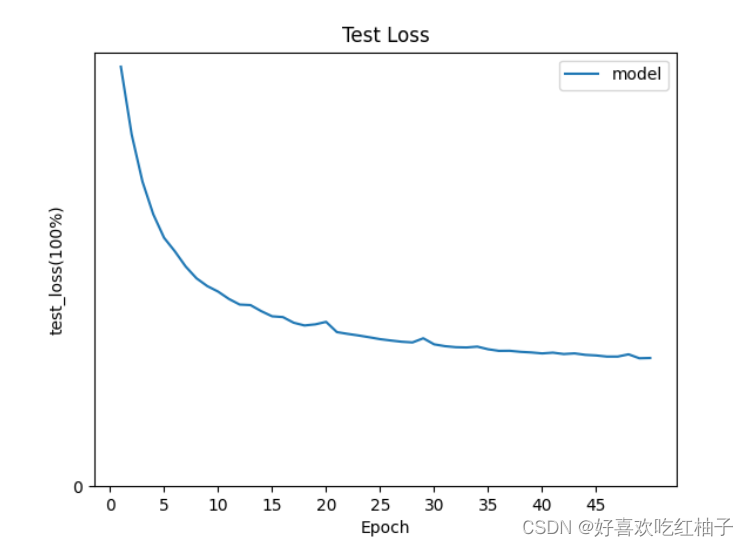
plt.plot(range(iterations), cost_history)
plt.xlabel('Iterations')
plt.ylabel('Cost')
plt.show()
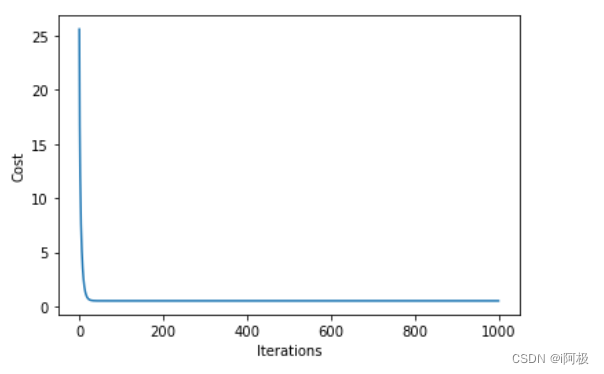
我们通过画图的方式展示了模型拟合的结果,同时也可以看到成本函数随着迭代次数的变化。
3、sklearn内置模块实现
下面是使用sklearn内置模块实现线性回归模型的梯度下降法的实战案例:
导入模块
from sklearn.linear_model import SGDRegressor
from sklearn.datasets import make_regression
from sklearn.model_selection import train_test_split
from sklearn.metrics import mean_squared_error
首先使用make_regression函数生成了一个模拟数据集,其中包含1000个样本,每个样本包含10个特征,噪声为10:
X, y = make_regression(n_samples=1000, n_features=10, noise=10)
然后使用train_test_split函数将数据集划分为训练集和测试集,其中测试集占20%:
X_train, X_test, y_train, y_test = train_test_split(X, y, test_size=0.2)
接下来,使用SGDRegressor模型构建了一个梯度下降模型,并将alpha参数设置为0.1,learning_rate参数设置为’constant’,eta0参数设置为0.01,max_iter参数设置为1000:
sgd = SGDRegressor(alpha=0.1, learning_rate='constant', eta0=0.01, max_iter=1000)
然后,使用fit方法拟合了模型,并使用predict方法预测了测试集的结果:
# 拟合模型
sgd.fit(X_train, y_train)

# 预测
y_pred = sgd.predict(X_test)
最后,使用mean_squared_error函数计算了预测结果的均方误差:
# 计算均方误差
mse = mean_squared_error(y_test, y_pred)
print("mse:", mse)

需要注意的是,每次运行代码时,生成的模拟数据集都会不同,因此每次运行时计算的均方误差可能会不同。
📢文章下方有交流学习区!一起学习进步!💪💪💪
📢首发CSDN博客,创作不易,如果觉得文章不错,可以点赞👍收藏📁评论📒
📢你的支持和鼓励是我创作的动力❗❗❗
