https://blog.csdn.net/hancoder/article/details/121703904
安装
壹, prometheus server 安装
github
1,上传安装包
# 解压到/opt/module 目录下:
mkdir /opt/module
tar  -zxvf  prometheus-2.29.1.linux-amd64.tar.gz -C /opt/module
# 修改目录名:
cd /opt/module
mv prometheus-2.29.1.linux-amd64 prometheus-2.29.1
ln -s /opt/module/prometheus-2.29.1/ /usr/local/prometheus
mkdir /usr/local/prometheus/data
2, 修改配置文件
# scrape_configs字段的配置
cat  prometheus.yml
scrape_configs:
	- job_name: 'prometheus'
	  static_configs:
        - targets: ["node1:9090"]
# 添加PushGateway 监控配置
	- job_name: 'pushgateway'
	  static_configs:
        - targets: ["node1:9091"]
          labels:
           instance: pushgateway
# 添加 Node Exporter 监控配置
	- job_name: 'node exporter'
	  static_configs:
		- targets: ['node1:9100','node2:9100','master3:9100']
3, 配置启动文件
cat << EOF >/usr/lib/systemd/system/prometheus.service
[Unit]
Description=https://prometheus.io
[Service]
Restart=on-failure
ExecStart=/usr/local/prometheus/prometheus \
--storage.tsdb.path=/usr/local/prometheus/data/ \
--config.file=/usr/local/prometheus/prometheus.yml
[Install]
WantedBy=multi-user.target
EOF

systemctl daemon-reload
systemctl status prometheus
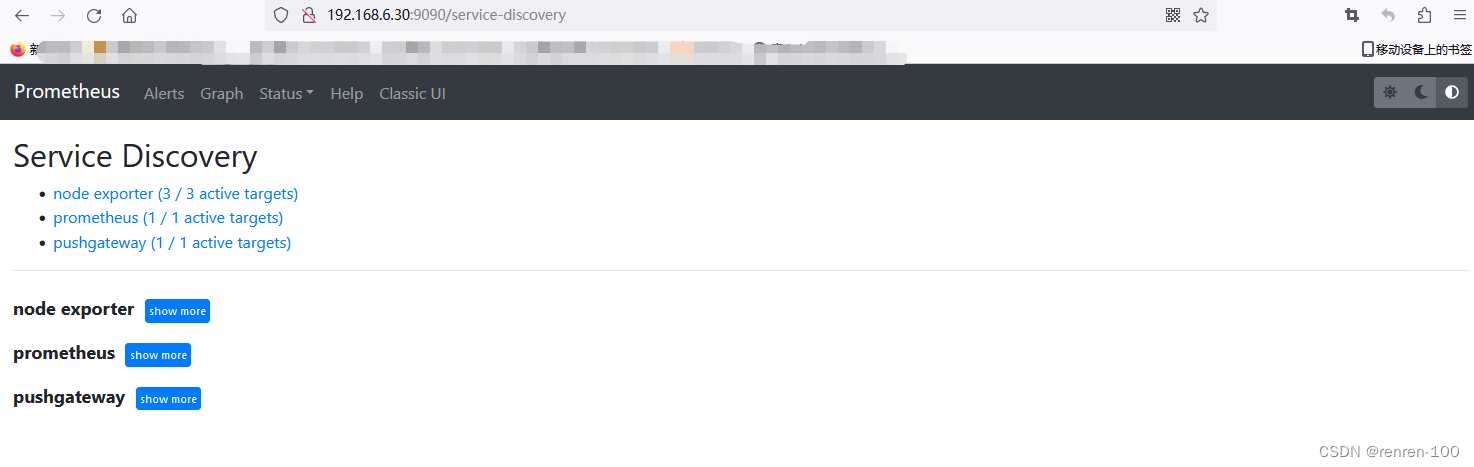
4,访问测试
http://192.168.6.30:9090/graph
配置说明
占时
https://github.com/prometheus/alertmanager/releases/download/v0.23.0/alertmanager-0.23.0.linux-amd64.tar.gz
贰,node-exporter 安装
(所有节点)
1, node-exporter 下载
node-exporter-github
2, 上传并安装
mkdir /opt/module
tar  -zxvf  node_exporter-1.2.2.linux-amd64.tar.gz  -C  /opt/module
cd /opt/module/
mv node_exporter-1.2.2.linux-amd64/ node_exporter-1.2.2
ln -s /opt/module/node_exporter-1.2.2/node_exporter  /usr/local/bin/node_exporter

# 创建node_exporter systemctl文件
cat << EOF >/usr/lib/systemd/system/node_export.service
[Service]
User=root
Group=root
ExecStart=/usr/local/bin/node_exporter

[Install]
WantedBy=multi-user.target

[Unit]
Description=node_exporter
After=network.target
EOF


systemctl enable node_export.service
systemctl start  node_export.service
systemctl status  node_export.service

lsof -i:9100
3, 检测
http://192.168.6.31:9100/

叁,pushgateway 安装
下载链接
1.上传安装包
useradd -s /sbin/nologin prometheus
chown -R prometheus:prometheus /opt/module/pushgateway-1.4.1/

tar -zxvf pushgateway-1.4.1.linux-amd64.tar.gz  -C /opt/module/
cd /opt/module/
mv pushgateway-1.4.1.linux-amd64/ pushgateway-1.4.1/
ln -s  /opt/module/pushgateway-1.4.1/pushgateway  /usr/local/bin/
pushgateway --version
cat << EOF >/usr/lib/systemd/system/pushgateway.service
[Unit]
Description=Prometheus Pushgateway
After=network.target

[Service]
Type=simple
User=prometheus
Group=prometheus

WorkingDirectory=/opt/module/pushgateway-1.4.1/
ExecStart=pushgateway   --web.listen-address=0.0.0.0:9091
ExecReload=/bin/kill -HUP $MAINPID
KillMode=process
Restart=on-failure

[Install]
WantedBy=multi-user.target
EOF


systemctl daemon-reload
systemctl start pushgateway
systemctl status pushgateway
systemctl enable pushgateway
肆,grafana 集成
a,安装Grafana
grafana-8.1.2.linux-amd64
官方下载地址
# 下载上传安装
tar -zxvf grafana-enterprise-8.1.2.linux-amd64.tar.gz -C /opt/module/

chown -R prometheus:prometheus  /opt/module/grafana-8.1.2/

ln -s /opt/module/grafana-8.1.2/ /usr/local/bin/grafana

# 注册成系统服务
cat << EOF >/usr/lib/systemd/system/grafana.service
[Service]
Type=simple
User=prometheus
Group=prometheus

ExecStart=/usr/local/bin/grafana/bin/grafana-server --config=/usr/local/bin/grafana/conf/defaults.ini  --homepath=/usr/local/bin/grafana/

[Install]
WantedBy=multi-user.target

[Unit]
Description=grafana
After=network.target
# 启动 Grafana
nohup ./bin/grafana-server web > ./grafana.log 2>&1 &
#打开web:http://hadoop202:3000,默认用户名和密码:admin/admin
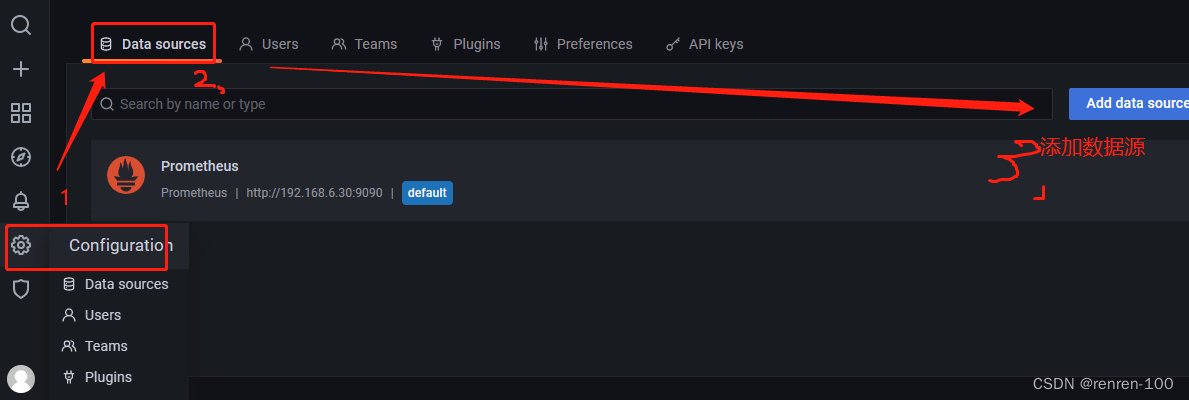
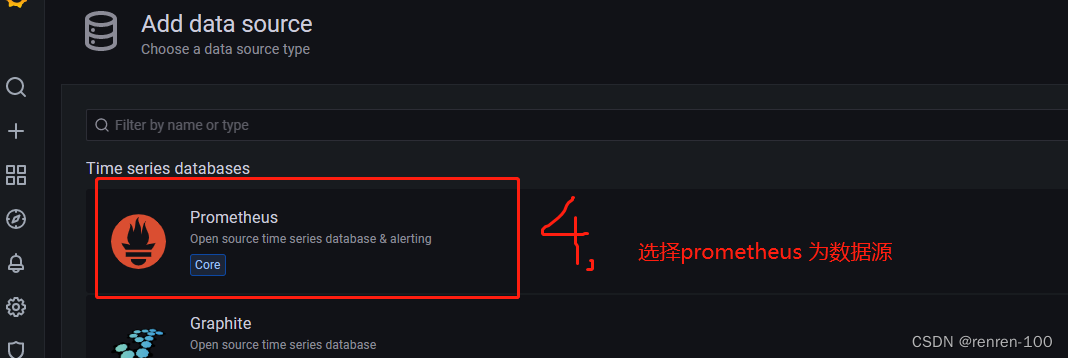
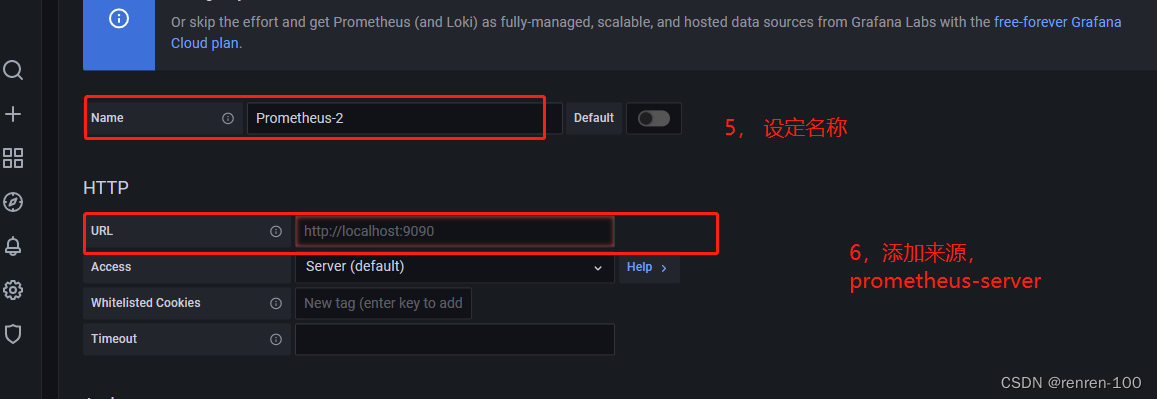
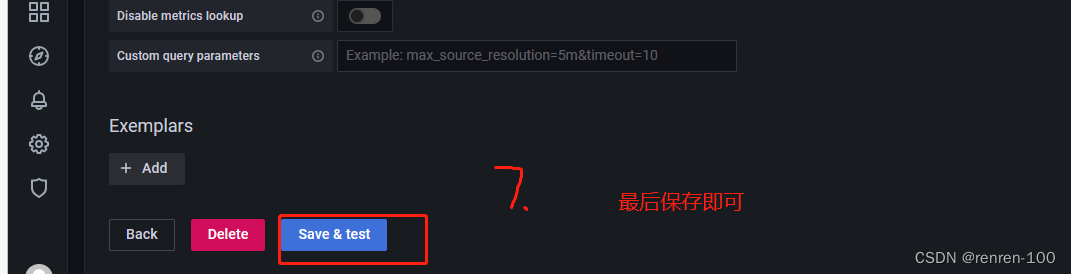
b, grafana 关联 数据源 到Prometheus
配置----->>>数据源
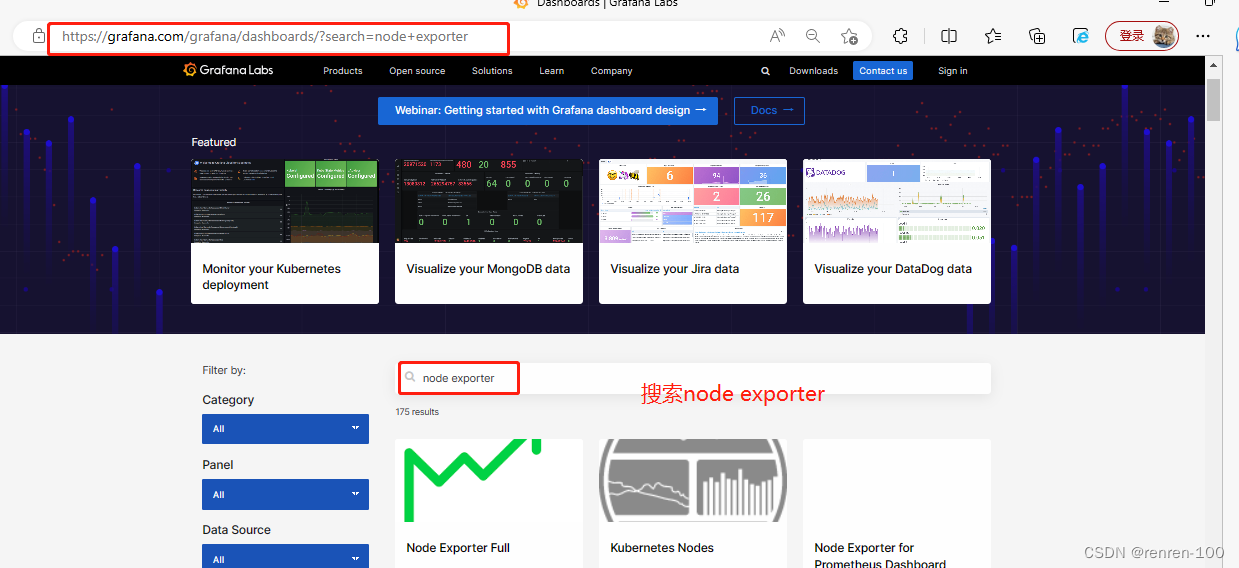
伍, 添加node exporter 模板
1, 进入官网,搜索需要的node exporter ,并进行下载
官网
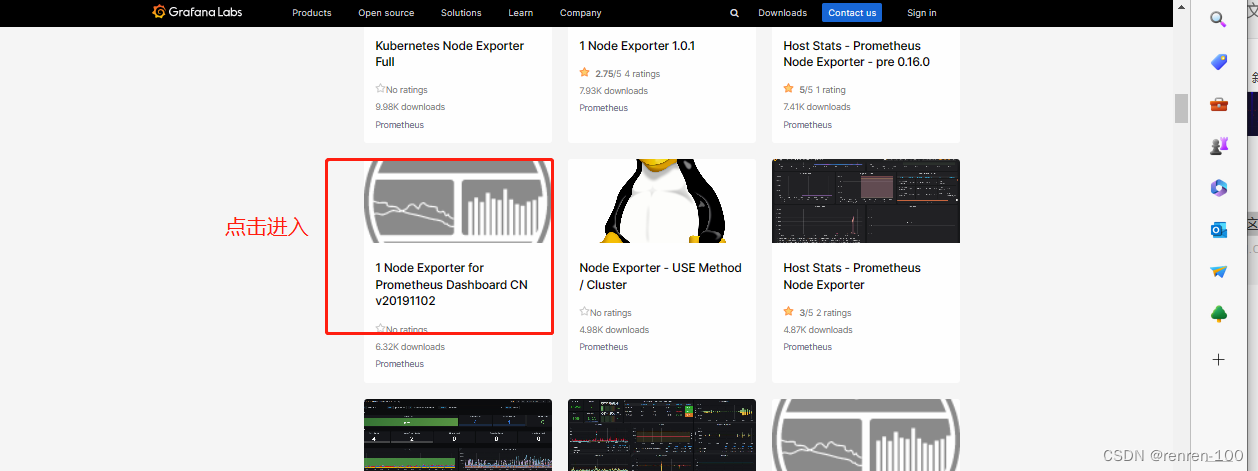
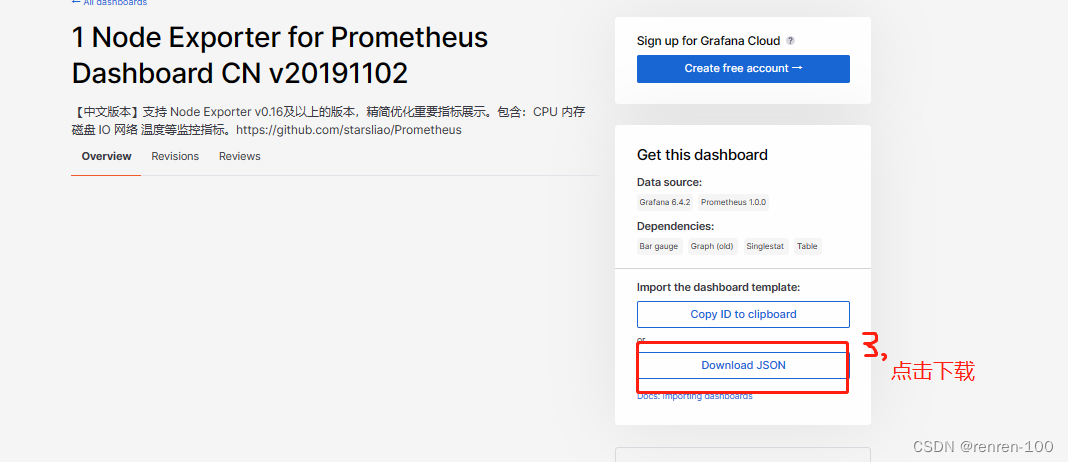
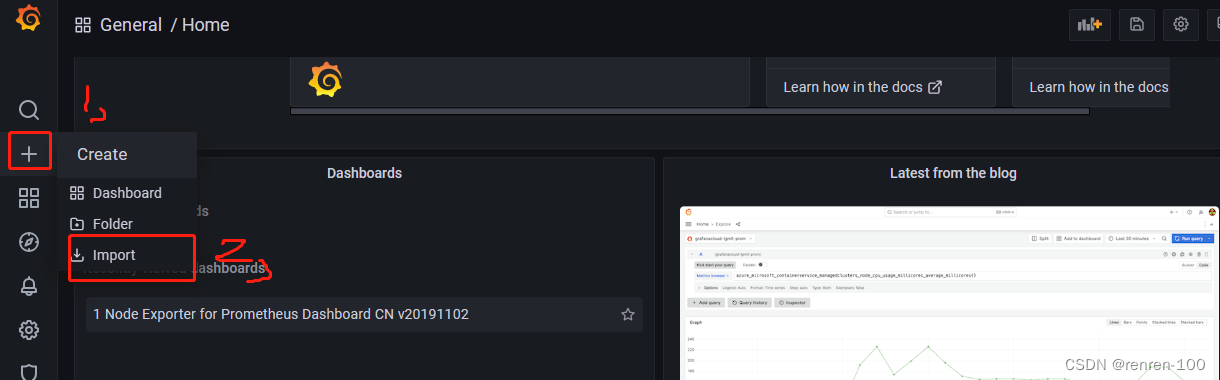
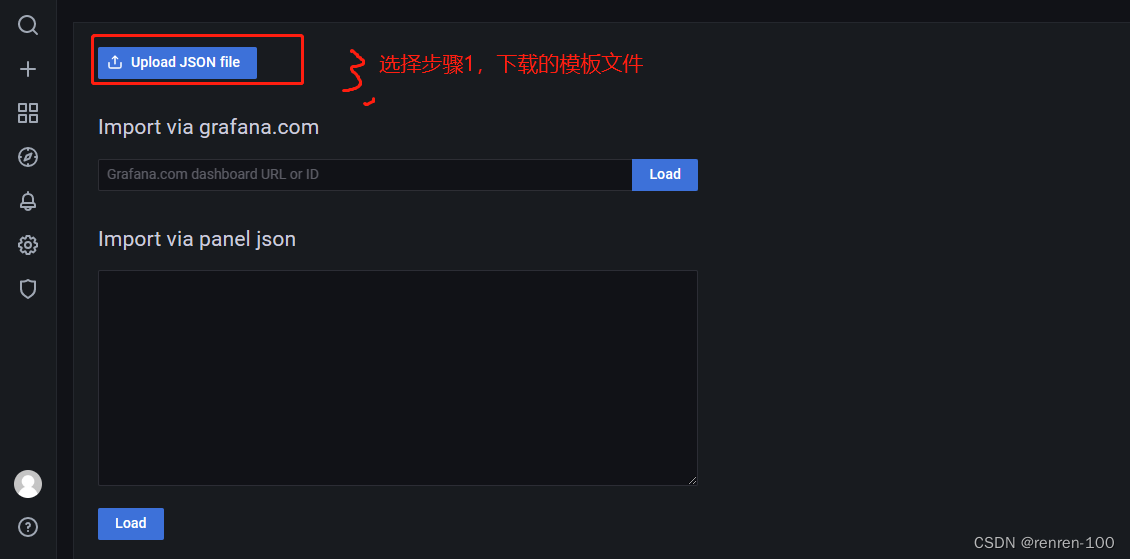
2, 导入模板
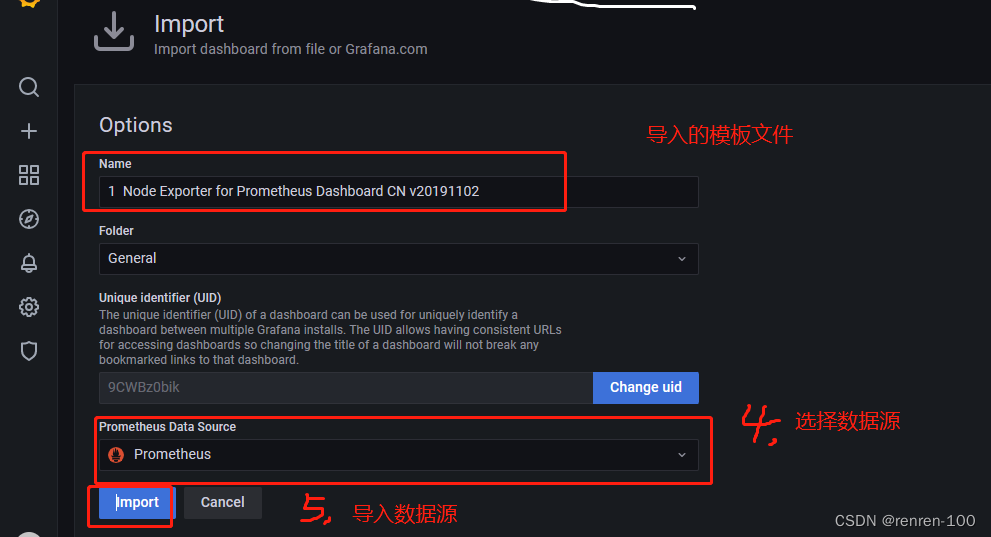
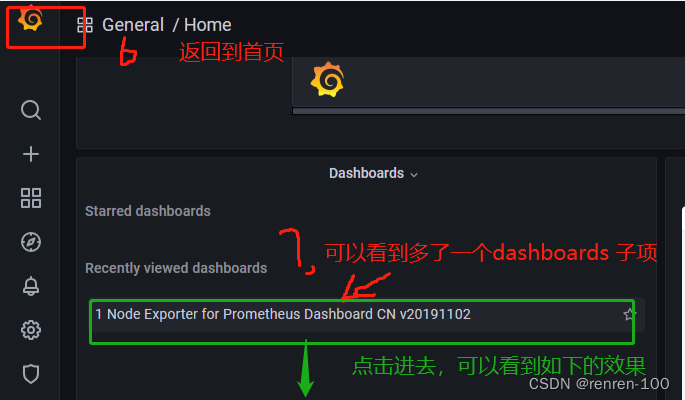
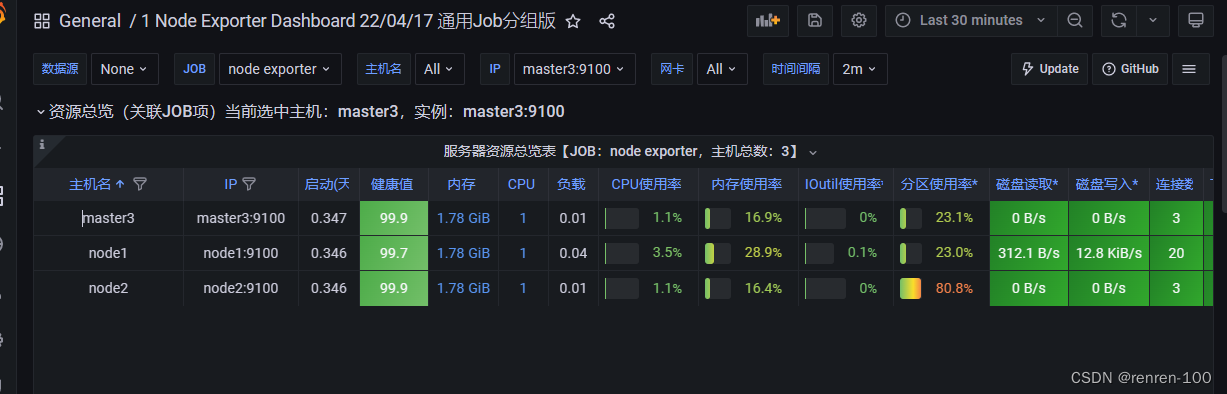
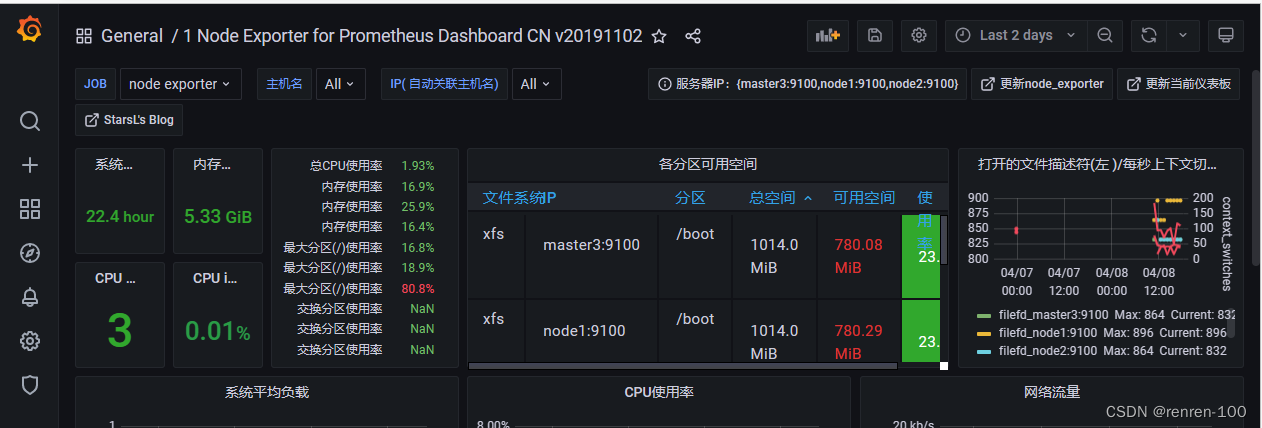
3, 最终呈现的效果
dashboard id 12377
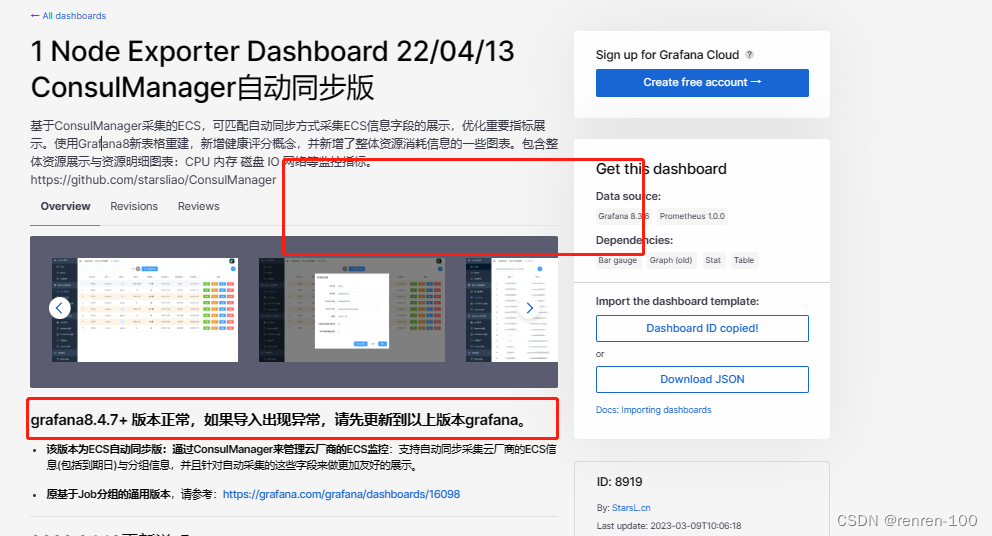
4,因版本差异,需要注意的模板
8919 (1 Node Exporter Dashboard 22/04/13 ConsulManager自动同步版)
要想正常使用这个模板,grafana 需要升级到 grafana8.4.7+ 版本