I2C Debugger仪器,在仿真调试期中,该仪器可以显示I2C数据传送时间、S(START状态)、Sr(ReStart状态)、A(Ask响应)、N (No ask状态)、P(Stop状态)、数据(同时显示数据的16进制值和每位的值)。通过查看I2C Debugger窗口的显示,可以知道I2C总线上发送和接受的数据是否正确。
先看代码
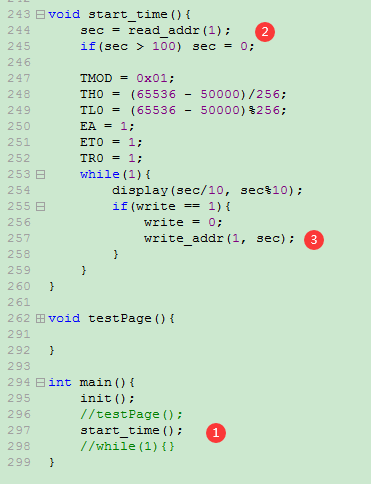
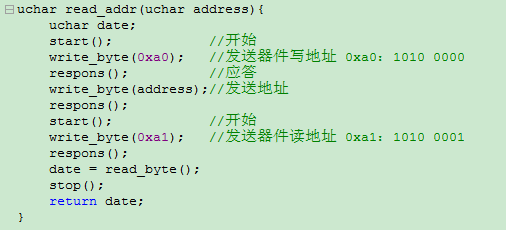
start_time函数,最开始调用 read_addr(1),读取存储的数据,查看I2C Debugger日志
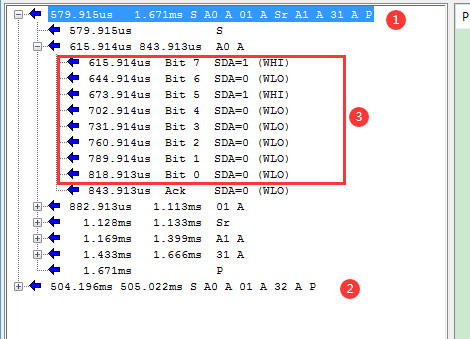
① S A0 A 01 A Sr A1 A 31 A P 一次读取过程
S:start()
A0:write_byte(0xa0);发送器件写地址 0xa0:1010 0000 对应 上图 ③
A:respons()
01:write_byte(address);发送地址(read_addr(1)--> address = 0x01)
Sr:start();
A1:write_byte(0xa1);发送器件读地址 0xa1:1010 0001
A:respons()
31:date = read_byte(); 上次存储的数据(0x31:0011 0001)
A:respons()
P:stop()
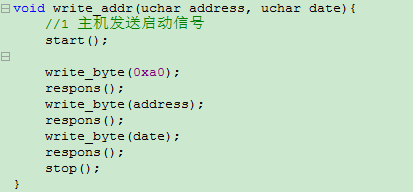
start_time() --> write_addr(1, sec),写入数据,查看I2C Debugger日志
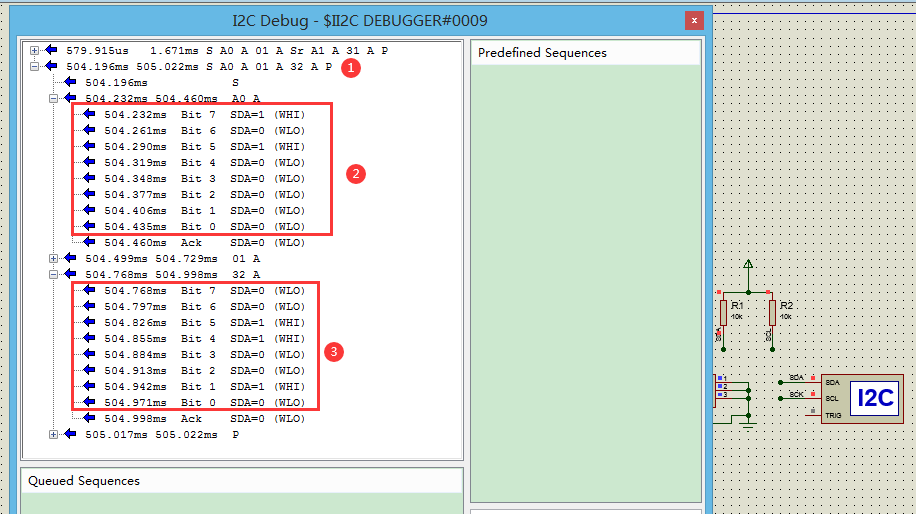
① S A0 A 01 A 32 A P 一次写入过程
S:start()
A0:write_byte(0xa0);发送器件写地址 0xa0:1010 0000 对应 上图 ②
A:respons()
01:write_byte(address);发送地址(read_addr(1)--> address = 0x01)
A:respons()
31:write_byte(date); 写入的数据(0x32:0011 0010)对应 上图 ③
A:respons()
P:stop()
查看I2C Memory Internal Memory,在地址01(16进制Ox01)处写入32(16进制Ox32),如下图:

源程序和仿真下载


![[NOIP2009 提高组] 最优贸易(C++,tarjan,topo,DP)](https://img-blog.csdnimg.cn/ac8b4e77a6f348b5a4ddf63009153a80.png#pic_center)