目录
- 一、下载及部署
- 二、postgres_exporter配置
- 1. 停止脚本stop.sh
- 2. 启动脚本start.sh
- 3. queries.yaml
- 三、PostgreSQL数据库配置
- 1. 修改postgresql.conf配置文件
- 2. 创建用户、表、扩展等
- 四、参考
一、下载及部署
下载地址
选一个amd64下载
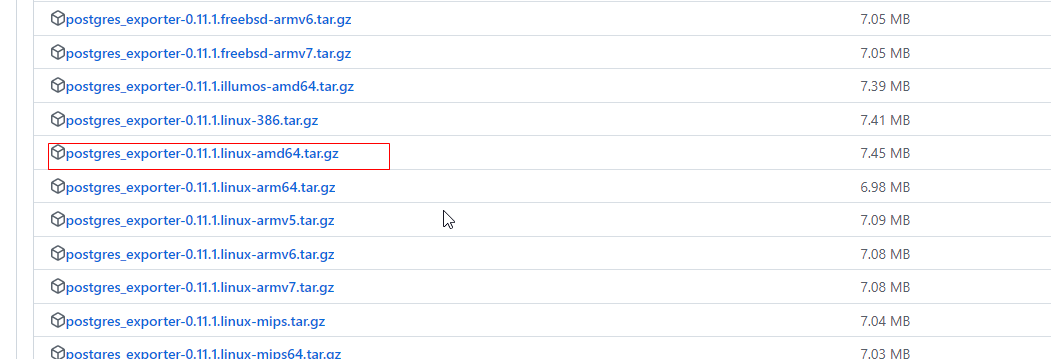
上传至服务器,解压
tax -xvf postgres_exporter-0.11.1.linux-amd64.tar.gz
进入解压后的目录
二、postgres_exporter配置
1. 停止脚本stop.sh
建立停止脚本 stop.sh 。注意unix编码
#!/bin/sh
echo "stop"
#!/bin/bash

PID=$(ps -ef | grep postgres_exporter | grep -v grep | awk '{ print $2 }')
if [ "${PID}" ]
then
    echo 'Application is stpping...'
    echo kill $PID DONE
    kill $PID
else
    echo 'Application is already stopped...'
fi
2. 启动脚本start.sh
启动脚本start.sh
-
后面会建立postgres_exporter用户,密码为password
-
–web.listen-address为监听的端口
-
–extend.query-path为自定义查询的文件
sh stop.sh
export DATA_SOURCE_NAME=postgresql://postgres_exporter:password@数据库IP:数据库端口/postgres?sslmode=disable

nohup ./postgres_exporter --web.listen-address=0.0.0.0:8001 --extend.query-path=queries.yaml >nohup.out 2>&1 &
3. queries.yaml
pg_replication:
  query: "SELECT CASE WHEN NOT pg_is_in_recovery() THEN 0 ELSE GREATEST (0, EXTRACT(EPOCH FROM (now() - pg_last_xact_replay_timestamp()))) END AS lag"
  master: true
  metrics:
    - lag:
        usage: "GAUGE"
        description: "Replication lag behind master in seconds"

pg_postmaster:
  query: "SELECT pg_postmaster_start_time as start_time_seconds from pg_postmaster_start_time()"
  master: true
  metrics:
    - start_time_seconds:
        usage: "GAUGE"
        description: "Time at which postmaster started"

pg_stat_user_tables:
  query: |
   SELECT
     current_database() datname,
     schemaname,
     relname,
     seq_scan,
     seq_tup_read,
     idx_scan,
     idx_tup_fetch,
     n_tup_ins,
     n_tup_upd,
     n_tup_del,
     n_tup_hot_upd,
     n_live_tup,
     n_dead_tup,
     n_mod_since_analyze,
     COALESCE(last_vacuum, '1970-01-01Z') as last_vacuum,
     COALESCE(last_autovacuum, '1970-01-01Z') as last_autovacuum,
     COALESCE(last_analyze, '1970-01-01Z') as last_analyze,
     COALESCE(last_autoanalyze, '1970-01-01Z') as last_autoanalyze,
     vacuum_count,
     autovacuum_count,
     analyze_count,
     autoanalyze_count
   FROM
     pg_stat_user_tables
  metrics:
    - datname:
        usage: "LABEL"
        description: "Name of current database"
    - schemaname:
        usage: "LABEL"
        description: "Name of the schema that this table is in"
    - relname:
        usage: "LABEL"
        description: "Name of this table"
    - seq_scan:
        usage: "COUNTER"
        description: "Number of sequential scans initiated on this table"
    - seq_tup_read:
        usage: "COUNTER"
        description: "Number of live rows fetched by sequential scans"
    - idx_scan:
        usage: "COUNTER"
        description: "Number of index scans initiated on this table"
    - idx_tup_fetch:
        usage: "COUNTER"
        description: "Number of live rows fetched by index scans"
    - n_tup_ins:
        usage: "COUNTER"
        description: "Number of rows inserted"
    - n_tup_upd:
        usage: "COUNTER"
        description: "Number of rows updated"
    - n_tup_del:
        usage: "COUNTER"
        description: "Number of rows deleted"
    - n_tup_hot_upd:
        usage: "COUNTER"
        description: "Number of rows HOT updated (i.e., with no separate index update required)"
    - n_live_tup:
        usage: "GAUGE"
        description: "Estimated number of live rows"
    - n_dead_tup:
        usage: "GAUGE"
        description: "Estimated number of dead rows"
    - n_mod_since_analyze:
        usage: "GAUGE"
        description: "Estimated number of rows changed since last analyze"
    - last_vacuum:
        usage: "GAUGE"
        description: "Last time at which this table was manually vacuumed (not counting VACUUM FULL)"
    - last_autovacuum:
        usage: "GAUGE"
        description: "Last time at which this table was vacuumed by the autovacuum daemon"
    - last_analyze:
        usage: "GAUGE"
        description: "Last time at which this table was manually analyzed"
    - last_autoanalyze:
        usage: "GAUGE"
        description: "Last time at which this table was analyzed by the autovacuum daemon"
    - vacuum_count:
        usage: "COUNTER"
        description: "Number of times this table has been manually vacuumed (not counting VACUUM FULL)"
    - autovacuum_count:
        usage: "COUNTER"
        description: "Number of times this table has been vacuumed by the autovacuum daemon"
    - analyze_count:
        usage: "COUNTER"
        description: "Number of times this table has been manually analyzed"
    - autoanalyze_count:
        usage: "COUNTER"
        description: "Number of times this table has been analyzed by the autovacuum daemon"

pg_statio_user_tables:
  query: "SELECT current_database() datname, schemaname, relname, heap_blks_read, heap_blks_hit, idx_blks_read, idx_blks_hit, toast_blks_read, toast_blks_hit, tidx_blks_read, tidx_blks_hit FROM pg_statio_user_tables"
  metrics:
    - datname:
        usage: "LABEL"
        description: "Name of current database"
    - schemaname:
        usage: "LABEL"
        description: "Name of the schema that this table is in"
    - relname:
        usage: "LABEL"
        description: "Name of this table"
    - heap_blks_read:
        usage: "COUNTER"
        description: "Number of disk blocks read from this table"
    - heap_blks_hit:
        usage: "COUNTER"
        description: "Number of buffer hits in this table"
    - idx_blks_read:
        usage: "COUNTER"
        description: "Number of disk blocks read from all indexes on this table"
    - idx_blks_hit:
        usage: "COUNTER"
        description: "Number of buffer hits in all indexes on this table"
    - toast_blks_read:
        usage: "COUNTER"
        description: "Number of disk blocks read from this table's TOAST table (if any)"
    - toast_blks_hit:
        usage: "COUNTER"
        description: "Number of buffer hits in this table's TOAST table (if any)"
    - tidx_blks_read:
        usage: "COUNTER"
        description: "Number of disk blocks read from this table's TOAST table indexes (if any)"
    - tidx_blks_hit:
        usage: "COUNTER"
        description: "Number of buffer hits in this table's TOAST table indexes (if any)"

# WARNING: This set of metrics can be very expensive on a busy server as every unique query executed will create an additional time series
pg_stat_statements:
  query: "SELECT t2.rolname, t3.datname, queryid, calls, total_time / 1000 as total_time_seconds, min_time / 1000 as min_time_seconds, max_time / 1000 as max_time_seconds, mean_time / 1000 as mean_time_seconds, stddev_time / 1000 as stddev_time_seconds, rows, shared_blks_hit, shared_blks_read, shared_blks_dirtied, shared_blks_written, local_blks_hit, local_blks_read, local_blks_dirtied, local_blks_written, temp_blks_read, temp_blks_written, blk_read_time / 1000 as blk_read_time_seconds, blk_write_time / 1000 as blk_write_time_seconds FROM pg_stat_statements t1 JOIN pg_roles t2 ON (t1.userid=t2.oid) JOIN pg_database t3 ON (t1.dbid=t3.oid) WHERE t2.rolname != 'rdsadmin'"
  master: true
  metrics:
    - rolname:
        usage: "LABEL"
        description: "Name of user"
    - datname:
        usage: "LABEL"
        description: "Name of database"
    - queryid:
        usage: "LABEL"
        description: "Query ID"
    - calls:
        usage: "COUNTER"
        description: "Number of times executed"
    - total_time_seconds:
        usage: "COUNTER"
        description: "Total time spent in the statement, in milliseconds"
    - min_time_seconds:
        usage: "GAUGE"
        description: "Minimum time spent in the statement, in milliseconds"
    - max_time_seconds:
        usage: "GAUGE"
        description: "Maximum time spent in the statement, in milliseconds"
    - mean_time_seconds:
        usage: "GAUGE"
        description: "Mean time spent in the statement, in milliseconds"
    - stddev_time_seconds:
        usage: "GAUGE"
        description: "Population standard deviation of time spent in the statement, in milliseconds"
    - rows:
        usage: "COUNTER"
        description: "Total number of rows retrieved or affected by the statement"
    - shared_blks_hit:
        usage: "COUNTER"
        description: "Total number of shared block cache hits by the statement"
    - shared_blks_read:
        usage: "COUNTER"
        description: "Total number of shared blocks read by the statement"
    - shared_blks_dirtied:
        usage: "COUNTER"
        description: "Total number of shared blocks dirtied by the statement"
    - shared_blks_written:
        usage: "COUNTER"
        description: "Total number of shared blocks written by the statement"
    - local_blks_hit:
        usage: "COUNTER"
        description: "Total number of local block cache hits by the statement"
    - local_blks_read:
        usage: "COUNTER"
        description: "Total number of local blocks read by the statement"
    - local_blks_dirtied:
        usage: "COUNTER"
        description: "Total number of local blocks dirtied by the statement"
    - local_blks_written:
        usage: "COUNTER"
        description: "Total number of local blocks written by the statement"
    - temp_blks_read:
        usage: "COUNTER"
        description: "Total number of temp blocks read by the statement"
    - temp_blks_written:
        usage: "COUNTER"
        description: "Total number of temp blocks written by the statement"
    - blk_read_time_seconds:
        usage: "COUNTER"
        description: "Total time the statement spent reading blocks, in milliseconds (if track_io_timing is enabled, otherwise zero)"
    - blk_write_time_seconds:
        usage: "COUNTER"
        description: "Total time the statement spent writing blocks, in milliseconds (if track_io_timing is enabled, otherwise zero)"

pg_process_idle:
  query: |
    WITH
      metrics AS (
        SELECT
          application_name,
          SUM(EXTRACT(EPOCH FROM (CURRENT_TIMESTAMP - state_change))::bigint)::float AS process_idle_seconds_sum,
          COUNT(*) AS process_idle_seconds_count
        FROM pg_stat_activity
        WHERE state = 'idle'
        GROUP BY application_name
      ),
      buckets AS (
        SELECT
          application_name,
          le,
          SUM(
            CASE WHEN EXTRACT(EPOCH FROM (CURRENT_TIMESTAMP - state_change)) <= le
              THEN 1
              ELSE 0
            END
          )::bigint AS bucket
        FROM
          pg_stat_activity,
          UNNEST(ARRAY[1, 2, 5, 15, 30, 60, 90, 120, 300]) AS le
        GROUP BY application_name, le
        ORDER BY application_name, le
      )
    SELECT
      application_name,
      process_idle_seconds_sum as seconds_sum,
      process_idle_seconds_count as seconds_count,
      ARRAY_AGG(le) AS seconds,
      ARRAY_AGG(bucket) AS seconds_bucket
    FROM metrics JOIN buckets USING (application_name)
    GROUP BY 1, 2, 3
  metrics:
    - application_name:
        usage: "LABEL"
        description: "Application Name"
    - seconds:
        usage: "HISTOGRAM"
        description: "Idle time of server processes"
三、PostgreSQL数据库配置
1. 修改postgresql.conf配置文件
- 先根据命令在服务器上找到配置文件在哪
find / -name postgresql.conf
- 修改配置文件postgresql.conf,添加下面三行
shared_preload_libraries = 'pg_stat_statements'
pg_stat_statements.max = 1000
pg_stat_statements.track = all
- 重启pg服务(pg不同安装方式启动方式可能不同)
pg_ctl restart
2. 创建用户、表、扩展等
官网的文档里提示比pg10高或低版本的数据库执行的SQL不同,但是我pg11只执行高版本的SQL失败了。最终高低版本都执行成功。
最好在postgres库下的public模式执行
版本>=10的pg,以下三段SQL都要执行
-- To use IF statements, hence to be able to check if the user exists before
-- attempting creation, we need to switch to procedural SQL (PL/pgSQL)
-- instead of standard SQL.
-- More: https://www.postgresql.org/docs/9.3/plpgsql-overview.html
-- To preserve compatibility with <9.0, DO blocks are not used; instead,
-- a function is created and dropped.
CREATE OR REPLACE FUNCTION __tmp_create_user() returns void as $$
BEGIN
  IF NOT EXISTS (
          SELECT                       -- SELECT list can stay empty for this
          FROM   pg_catalog.pg_user
          WHERE  usename = 'postgres_exporter') THEN
    CREATE USER postgres_exporter;
  END IF;
END;
$$ language plpgsql;

SELECT __tmp_create_user();
DROP FUNCTION __tmp_create_user();

ALTER USER postgres_exporter WITH PASSWORD 'password';
ALTER USER postgres_exporter SET SEARCH_PATH TO postgres_exporter,pg_catalog;

-- If deploying as non-superuser (for example in AWS RDS), uncomment the GRANT
-- line below and replace <MASTER_USER> with your root user.
-- GRANT postgres_exporter TO <MASTER_USER>;

GRANT CONNECT ON DATABASE postgres TO postgres_exporter;
GRANT pg_monitor to postgres_exporter;
版本<10的pg,只执行下面的SQL
CREATE SCHEMA IF NOT EXISTS postgres_exporter;
GRANT USAGE ON SCHEMA postgres_exporter TO postgres_exporter;

CREATE OR REPLACE FUNCTION get_pg_stat_activity() RETURNS SETOF pg_stat_activity AS
$$ SELECT * FROM pg_catalog.pg_stat_activity; $$
LANGUAGE sql
VOLATILE
SECURITY DEFINER;

CREATE OR REPLACE VIEW postgres_exporter.pg_stat_activity
AS
  SELECT * from get_pg_stat_activity();

GRANT SELECT ON postgres_exporter.pg_stat_activity TO postgres_exporter;

CREATE OR REPLACE FUNCTION get_pg_stat_replication() RETURNS SETOF pg_stat_replication AS
$$ SELECT * FROM pg_catalog.pg_stat_replication; $$
LANGUAGE sql
VOLATILE
SECURITY DEFINER;

CREATE OR REPLACE VIEW postgres_exporter.pg_stat_replication
AS
  SELECT * FROM get_pg_stat_replication();

GRANT SELECT ON postgres_exporter.pg_stat_replication TO postgres_exporter;

CREATE EXTENSION IF NOT EXISTS pg_stat_statements;
CREATE OR REPLACE FUNCTION get_pg_stat_statements() RETURNS SETOF pg_stat_statements AS
$$ SELECT * FROM public.pg_stat_statements; $$
LANGUAGE sql
VOLATILE
SECURITY DEFINER;

CREATE OR REPLACE VIEW postgres_exporter.pg_stat_statements
AS
  SELECT * FROM get_pg_stat_statements();

GRANT SELECT ON postgres_exporter.pg_stat_statements TO postgres_exporter;
来到postgres_exporter安装目录,启动postgres_exporter
sh start.sh
观察nohup.out文件,看是否有报错信息。
如果集成了Grafana,可以发现页面已经能采集到数据了
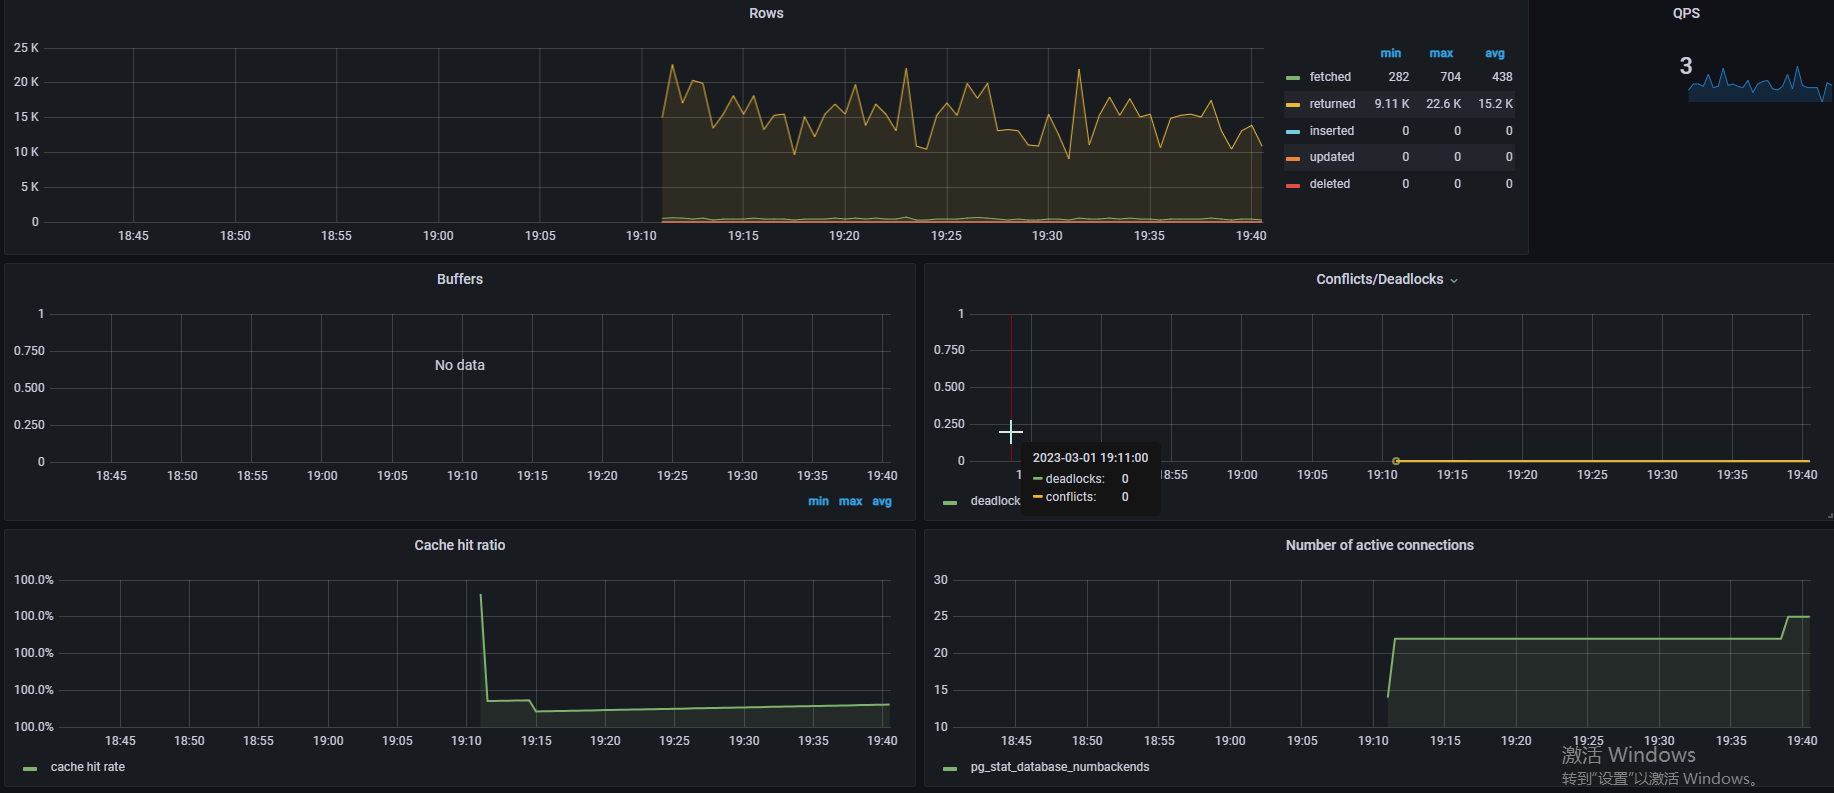
Grafana+prometheus+postgres_exporter参考
四、参考
- Github地址
- postgres_exporter使用过程中的注意事项