上篇文章我们已经介绍了一些常见的聚类算法,下面我们将要介绍评估聚类算法的指标
1、Rand Index
Rand Index(兰德指数)是一种衡量聚类算法性能的指标。它衡量的是聚类算法将数据点分配到聚类中的准确程度。兰德指数的范围从0到1,1的值表示两个聚类完全相同,接近0的值表示两个聚类有很大的不同。需要注意的是,Rand Index只能用于评估将样本点分成两个簇的聚类算法。对于将样本点分成多个簇的聚类算法,需要使用其他的指标来评估其性能。
它的公式如下:
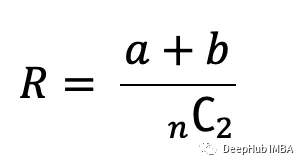
这里的:
a→在真实标签中处于同一簇中的样本对数,在预测聚类中处于同一簇中的样本对数。
b→真实聚类和预测聚类中处于不同聚类的样本对的数目。
要验证条件a和b,我们使用以下代码:
 ify_true[i] ==y_true[j] andy_pred[i] ==y_pred[j]:
   a+=1
 elify_true[i] !=y_true[j] andy_pred[i] !=y_pred[j]:
   b+=1

 #Where j= i+1
为了找到大型数组的可能组合的数量,我们可以使用math库中的“comb”函数。这个函数有两个参数n和k:
 #comb function:
 frommathimportcomb

 #math.comb(n,k):
 print(comb(len(df['cluster_id']),2))
以下就是python的代码实现:
 defrand_index_score(y_true, y_pred):

     # Initialize variables
     a, b=0,0

     # Compute variables
     foriinrange(len(y_true)):
         forjinrange(i+1, len(y_true)):
             ify_true[i] ==y_true[j] andy_pred[i] ==y_pred[j]:
                 a+=1
             elify_true[i] !=y_true[j] andy_pred[i] !=y_pred[j]:
                 b+=1
     #combinations
     combinations=comb(len(y_true),2)

     # Compute Rand Index
     rand_index= (a+b) /combinations
     print(a)
     print(b)

     returnrand_index

 #Call the function and print result:
 print(rand_index_score(df['cluster_id'], km_labels))
Sklearn已经包含了他的实现:rand_score函数,所以我们可以直接使用它
 fromsklearnimportmetrics

 print('Rand Index for K-Means is:', metrics.rand_score(df['cluster_id'], km_labels))
 print('Rand Index for Affinity Propagation is:', metrics.rand_score(df['cluster_id'], af_labels))
 print('Rand Index for Aglomerative Clustering is:', metrics.rand_score(df['cluster_id'], AC_labels))
 print('Rand Index for Mean Shift is:', metrics.rand_score(df['cluster_id'], MS_labels))
 print('Rand Index for Bisecting KM is:', metrics.rand_score(df['cluster_id'], BKM_labels))
 print('Rand Index for DBSCAN is:', metrics.rand_score(df['cluster_id'], DBSCAN_labels))
 print('Rand Index for OPTICS is:', metrics.rand_score(df['cluster_id'], OPTICS_labels))
 print('Rand Index for BIRCH is:', metrics.rand_score(df['cluster_id'], BIRCH_labels))
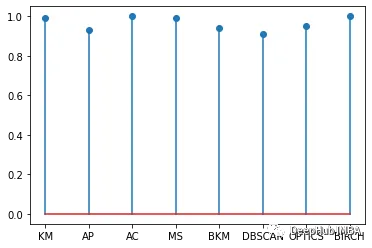
构建可视化图形
 #Build a dataframe:
 data= {'Model':["KM", "AP", "AC", "MS", "BKM", "DBSCAN", "OPTICS", "BIRCH"],'Rand_Index':[0.99, 0.93,1, 0.99, 0.94, 0.91, 0.95,1]}
 Rand_Index=pd.DataFrame(data)

 # Make the plot
 y_pos=np.arange(len(Rand_Index['Model']))

 plt.stem(Rand_Index['Rand_Index'])
 plt.xticks(y_pos, Rand_Index['Model'])
 plt.show()
2、Adjusted Rand Score
Adjusted Rand Score(调整兰德指数)是一种用于衡量聚类算法性能的指标,它是Rand Index的一种调整形式,可以用于评估将样本点分为多个簇的聚类算法。它考虑了机会的概率,取值范围为[-1,1],其中值越接近1表示聚类结果越准确,值越接近0表示聚类结果与随机结果相当,值越接近-1表示聚类结果与真实类别完全相反。

print('Adjusted Rand Score for K-Means is:', metrics.adjusted_rand_score(df['cluster_id'], km_labels))
print('Adjusted Rand Score for Affinity Propagation is:', metrics.adjusted_rand_score(df['cluster_id'], af_labels))
print('Adjusted Rand Score for Aglomerative Clustering is:', metrics.adjusted_rand_score(df['cluster_id'], AC_labels))
print('Adjusted Rand Score for Mean Shift is:', metrics.adjusted_rand_score(df['cluster_id'], MS_labels))
print('Adjusted Rand Score for Bisecting KM is:', metrics.adjusted_rand_score(df['cluster_id'], BKM_labels))
print('Adjusted Rand Score for DBSCAN is:', metrics.adjusted_rand_score(df['cluster_id'], DBSCAN_labels))
print('Adjusted Rand Score for OPTICS is:', metrics.adjusted_rand_score(df['cluster_id'], OPTICS_labels))
print('Adjusted Rand Score for BIRCH is:', metrics.adjusted_rand_score(df['cluster_id'], BIRCH_labels))
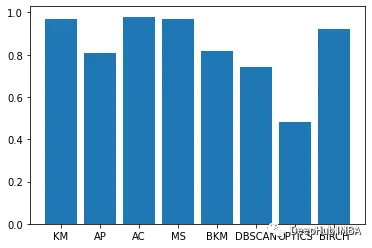
data= {'Model':["KM", "AP", "AC", "MS", "BKM", "DBSCAN", "OPTICS", "BIRCH"],'Adj_Rand_Score':[0.97, 0.81,0.98, 0.97, 0.82, 0.74, 0.48, 0.92]}
Adj_Rand_Score=pd.DataFrame(data)
# Make the plot
y_pos=np.arange(len(Adj_Rand_Score['Model']))
plt.bar(y_pos,Adj_Rand_Score['Adj_Rand_Score'])
plt.xticks(y_pos, Adj_Rand_Score['Model'])
plt.show()
3、Mutual Information-based Score
基于互信息的分数(Mutual Information-based Score)是一种用于衡量聚类算法性能的指标,它衡量的是聚类结果与真实标签之间的相似性。基于互信息的分数可以用于评估将样本点分为多个簇的聚类算法。
基于互信息的分数的取值范围为[0,1],其中值越接近1表示聚类结果越准确,值越接近0表示聚类结果与随机结果相当,值越小表示聚类结果与真实类别之间的差异越大。基于互信息的分数是一种相对指标,它的取值受到真实类别数量的影响。当真实类别数量很大时,基于互信息的分数可能会受到偏差。
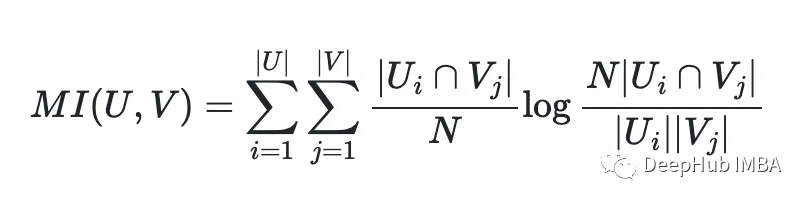
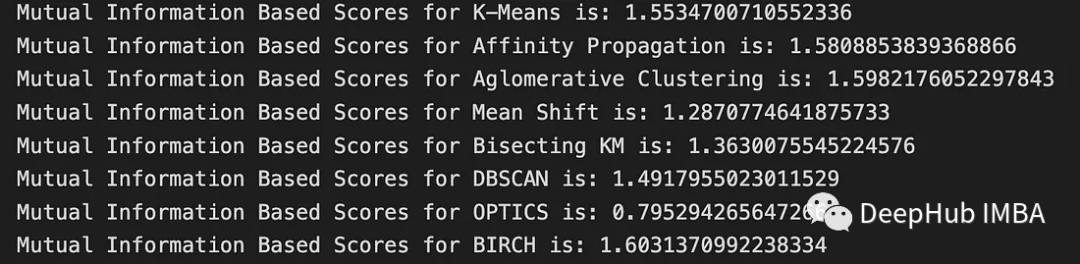
用Scikit-Learn可以计算MI:
 print('Mutual Information Based Scores for K-Means is:', metrics.mutual_info_score(df['cluster_id'], km_labels))
 print('Mutual Information Based Scores for Affinity Propagation is:', metrics.mutual_info_score(df['cluster_id'], af_labels))
 print('Mutual Information Based Scores for Aglomerative Clustering is:', metrics.mutual_info_score(df['cluster_id'], AC_labels))
 print('Mutual Information Based Scores for Mean Shift is:', metrics.mutual_info_score(df['cluster_id'], MS_labels))
 print('Mutual Information Based Scores for Bisecting KM is:', metrics.mutual_info_score(df['cluster_id'], BKM_labels))
 print('Mutual Information Based Scores for DBSCAN is:', metrics.mutual_info_score(df['cluster_id'], DBSCAN_labels))
 print('Mutual Information Based Scores for OPTICS is:', metrics.mutual_info_score(df['cluster_id'], OPTICS_labels))
 print('Mutual Information Based Scores for BIRCH is:', metrics.mutual_info_score(df['cluster_id'], BIRCH_labels))
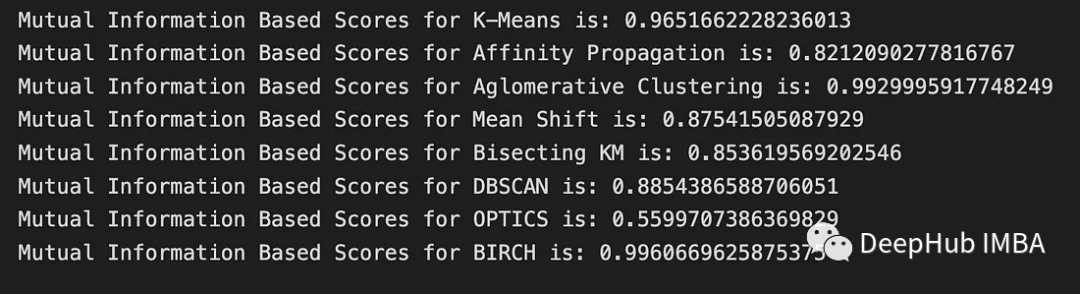
3、Normalized Mutual Information Scor
Normalized Mutual Information Score(标准化互信息分数)是基于互信息的分数的一种标准化形式,可以用于评估将样本点分为多个簇的聚类算法。它知识将互信息分数进行了标准化,在0(表示没有互信息)和1(表示完全相关)之间进行缩放。为了标准化上一步中得到的结果,我们只需要做一点额外的工作:
 h_true=-np.sum(px*np.log(px))
 h_pred=-np.sum(py*np.log(py))

 nmi=mi/ ((h_true+h_pred) /2)
与基于互信息的分数相比,标准化互信息分数更加稳健,不受真实类别数量的影响。
print('Mutual Information Based Scores for K-Means is:', metrics.normalized_mutual_info_score(df['cluster_id'], km_labels))
print('Mutual Information Based Scores for Affinity Propagation is:', metrics.normalized_mutual_info_score(df['cluster_id'], af_labels))
print('Mutual Information Based Scores for Aglomerative Clustering is:', metrics.normalized_mutual_info_score(df['cluster_id'], AC_labels))
print('Mutual Information Based Scores for Mean Shift is:', metrics.normalized_mutual_info_score(df['cluster_id'], MS_labels))
print('Mutual Information Based Scores for Bisecting KM is:', metrics.normalized_mutual_info_score(df['cluster_id'], BKM_labels))
print('Mutual Information Based Scores for DBSCAN is:', metrics.normalized_mutual_info_score(df['cluster_id'], DBSCAN_labels))
print('Mutual Information Based Scores for OPTICS is:', metrics.normalized_mutual_info_score(df['cluster_id'], OPTICS_labels))
print('Mutual Information Based Scores for BIRCH is:', metrics.normalized_mutual_info_score(df['cluster_id'], BIRCH_labels))
4、Adjusted Mutual Information Score
Adjusted Mutual Information Score(调整互信息分数)是一种用于衡量聚类算法性能的指标,它是基于互信息的分数的一种调整形式,AMI不受标签数值的影响,即使标签重新排序,也会产生相同的分数。公式如下所示,其中E代表预期:
AMI(U, V) = [MI(U, V) - E(MI(U, V))] / [avg(H(U), H(V)) - E(MI(U, V))]
print('Mutual Information Based Scores for K-Means is:', metrics.adjusted_mutual_info_score(df['cluster_id'], km_labels))
print('Mutual Information Based Scores for Affinity Propagation is:', metrics.adjusted_mutual_info_score(df['cluster_id'], af_labels))
print('Mutual Information Based Scores for Aglomerative Clustering is:', metrics.adjusted_mutual_info_score(df['cluster_id'], AC_labels))
print('Mutual Information Based Scores for Mean Shift is:', metrics.adjusted_mutual_info_score(df['cluster_id'], MS_labels))
print('Mutual Information Based Scores for Bisecting KM is:', metrics.adjusted_mutual_info_score(df['cluster_id'], BKM_labels))
print('Mutual Information Based Scores for DBSCAN is:', metrics.adjusted_mutual_info_score(df['cluster_id'], DBSCAN_labels))
print('Mutual Information Based Scores for OPTICS is:', metrics.adjusted_mutual_info_score(df['cluster_id'], OPTICS_labels))
print('Mutual Information Based Scores for BIRCH is:', metrics.adjusted_mutual_info_score(df['cluster_id'], BIRCH_labels))
与基于互信息的分数和标准化互信息分数相比,调整互信息分数更加稳健,可以通过随机置换进行期望值的估计,从而避免了真实类别数量的影响。
5、Homogeneity and Completeness Score
Homogeneity Score和Completeness Score是两个用于评估聚类结果的指标,它们可以用于衡量聚类算法对数据的划分是否“同质”(即簇内只包含同一类别的样本点)以及是否“完整”(即同一类别的样本点是否被划分到同一个簇中)。
同质性和完整性是给定公式的两个相关度量:
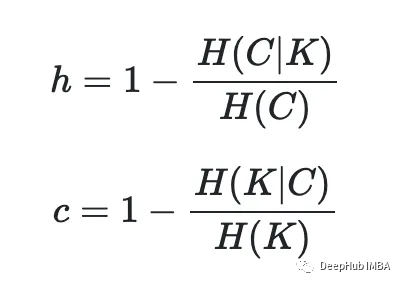
为了获得同质性和完整性,我们需要找到真实标签的熵(H)和预测标签的H,以及给定预测标签的真实标签的条件联合熵(CJH),以及给定真实标签的预测标签的CJH。
def entropy(arr):
    #Find unique values and their counts:
    unique, counts = np.unique(arr, return_counts=True)
    #Get the probability for each cluster (unique value):
    p = counts / len(arr)
    #Apply entropy formula:
    entropy = -np.sum(p * np.log2(p))
    return entropy

entropy_y_true = entropy(y_true)
entropy_km_labels = entropy(km_labels)

print('Entropy for y_true: ', entropy_y_true)
print('Entropy for km_labels: ', entropy_km_labels)
然后计算联合熵:
import numpy as np
from collections import Counter
import math

def conditional_entropy(X, Y):
    #Build a 2D-numpy array with true clusters and predicted clusters:
    XY = np.column_stack((X, Y))

    #Count the number of observations in X and Y with the same values:
    xy_counts = Counter(map(tuple, XY))

    #Get the joint probability:
    joint_prob = np.array(list(xy_counts.values())) / len(XY)

    #Get conditional probability:
    y_counts = Counter(Y)
    conditional_prob = np.zeros_like(joint_prob)
    for i, (x, y) in enumerate(xy_counts.keys()):
        conditional_prob[i] = xy_counts[(x, y)] / y_counts[y]

    #Get conditional entropy:
    conditional_entropy = -np.sum(joint_prob * np.log2(conditional_prob + 1e-10))

    return conditional_entropy

joint_entropy_y_true = conditional_entropy(y_true, km_labels)
print('Joint entropy for y_true given km_labels is: ', joint_entropy_y_true)

joint_entropy_km_labels = conditional_entropy(km_labels, y_true)
print('Joint entropy for km_labels given y_true is: ', joint_entropy_km_labels)
现在可以计算同质性和完整性值:
homogeneity = 1 - (joint_entropy_y_true / entropy_y_true)
print('homogeneity: ', homogeneity)

completeness = 1 - (joint_entropy_km_labels / entropy_km_labels)
print('Completeness: ', completeness)
当然,sklearn也提供了相关的函数
#Homogeneity:
print('Homogeneity for K-Means is:', metrics.homogeneity_score(df['cluster_id'], km_labels))
print('Homogeneity for Affinity Propagation is:', metrics.homogeneity_score(df['cluster_id'], af_labels))
print('Homogeneity for Aglomerative Clustering is:', metrics.homogeneity_score(df['cluster_id'], AC_labels))
print('Homogeneity for Mean Shift is:', metrics.homogeneity_score(df['cluster_id'], MS_labels))
print('Homogeneity for Bisecting KM is:', metrics.homogeneity_score(df['cluster_id'], BKM_labels))
print('Homogeneity for DBSCAN is:', metrics.homogeneity_score(df['cluster_id'], DBSCAN_labels))
print('Homogeneity for OPTICS is:', metrics.homogeneity_score(df['cluster_id'], OPTICS_labels))
print('Homogeneity for BIRCH is:', metrics.homogeneity_score(df['cluster_id'], BIRCH_labels))

#Completeness:
print('Completeness for K-Means is:', metrics.completeness_score(df['cluster_id'], km_labels))
print('Completeness for Affinity Propagation is:', metrics.completeness_score(df['cluster_id'], af_labels))
print('Completeness for Aglomerative Clustering is:', metrics.completeness_score(df['cluster_id'], AC_labels))
print('Completeness for Mean Shift is:', metrics.completeness_score(df['cluster_id'], MS_labels))
print('Completeness for Bisecting KM is:', metrics.completeness_score(df['cluster_id'], BKM_labels))
print('Completeness for DBSCAN is:', metrics.completeness_score(df['cluster_id'], DBSCAN_labels))
print('Completeness for OPTICS is:', metrics.completeness_score(df['cluster_id'], OPTICS_labels))
print('Completeness for BIRCH is:', metrics.completeness_score(df['cluster_id'], BIRCH_labels))
该指标的取值范围也为[0,1],值越大表示聚类结果越好。需要注意的是,该指标对簇的数量较为敏感,因此在使用时需要结合实际问题进行调参。
6、V-Measure
V-Measure是一种综合考虑同质性和完整性的评估指标,可以用于衡量聚类算法对数据的划分质量。
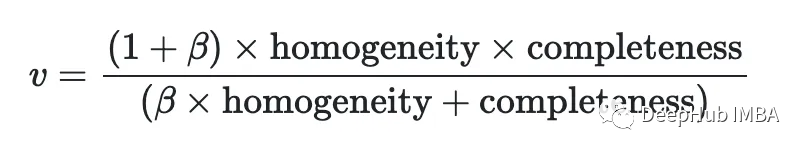
beta = 1

v_measure = ((1+beta)*homogeneity*completeness) / (beta*homogeneity+completeness)
print('V-Measure is: ', v_measure)

#Or simply:
metrics.v_measure_score(y_true, km_labels)
V-Measure的取值范围为[0,1],值越大表示聚类结果越好。
7、Fowlkes-Mallows Score
fowlkes - malos分数是这个是最容易理解的,它主要基于数据的真实标签和聚类结果的交集、联合集以及簇内和簇间点对数的比值来计算。由以下公式得到:

python的实现代码如下:
def fowlkes_mallows_score(labels_true, labels_pred):

    n = len(labels_true)
    tp, fp, tn, fn = 0, 0, 0, 0

    for i in range(n):
        for j in range(i + 1, n):
            if labels_true[i] == labels_true[j] and labels_pred[i] == labels_pred[j]:
                tp += 1
            elif labels_true[i] != labels_true[j] and labels_pred[i] == labels_pred[j]:
                fp += 1
            elif labels_true[i] == labels_true[j] and labels_pred[i] != labels_pred[j]:
                fn += 1
            else:
                tn += 1

    FM_score = tp / np.sqrt((tp + fp) * (tp + fn))

    return FM_score

FM_score = fowlkes_mallows_score(y_true, km_labels)
print('Fowlkes Mallows Score is: ', FM_score)
sklearn计算:
print('Fowlkes Mallows Score for K-Means is:', metrics.fowlkes_mallows_score(df['cluster_id'], km_labels))
print('Fowlkes Mallows Score for Affinity Propagation is:', metrics.fowlkes_mallows_score(df['cluster_id'], af_labels))
print('Fowlkes Mallows Score for Aglomerative Clustering is:', metrics.fowlkes_mallows_score(df['cluster_id'], AC_labels))
print('Fowlkes Mallows Score for Mean Shift is:', metrics.fowlkes_mallows_score(df['cluster_id'], MS_labels))
print('Fowlkes Mallows Score for Bisecting KM is:', metrics.fowlkes_mallows_score(df['cluster_id'], BKM_labels))
print('Fowlkes Mallows Score for DBSCAN is:', metrics.fowlkes_mallows_score(df['cluster_id'], DBSCAN_labels))
print('Fowlkes Mallows Score for OPTICS is:', metrics.fowlkes_mallows_score(df['cluster_id'], OPTICS_labels))
print('Fowlkes Mallows Score for BIRCH is:', metrics.fowlkes_mallows_score(df['cluster_id'], BIRCH_labels))
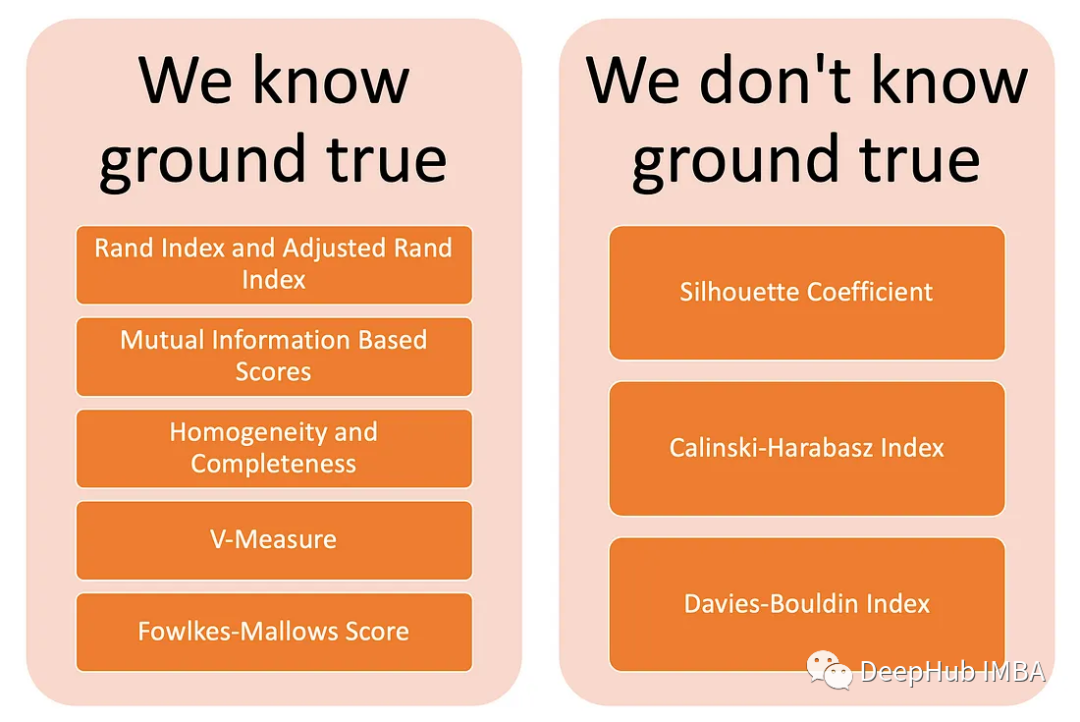
以上这些指标都是当我们知道真正的类的标签是可以使用(还记得上一篇中我们的cluster_id吗),这些评估聚类方法的指标是可解释的。下面我们将介绍一些不知道真正的类时评估聚类指标的指标。
8、Silhouette Score
轮廓分数使用同一聚类中的点之间的距离,以及下一个临近聚类中的点与所有其他点之间的距离来评估模型的表现。它主要基于样本点与其所属簇内和最近邻簇之间的距离、相似性和紧密度等因素来计算。数值越高,模型性能越好。一般公式为:

这里的:
a→样本与同类中所有其他点之间的平均距离。
b→样本与下一个最近聚类中所有其他点之间的平均距离。
要在Python中实现Silhouette Score公式,我们可以使用以下代码:
n_samples = len(X)
cluster_labels = np.unique(km_labels)

n_clusters = len(cluster_labels)
silhouette_vals = np.zeros(n_samples)

for i in range(n_samples):
    a_i = np.mean([np.linalg.norm(X[i] - X[j]) for j in range(n_samples) if km_labels[j] == km_labels[i] and j != i])
    b_i = np.min([np.mean([np.linalg.norm(X[i] - X[j]) for j in range(n_samples) if km_labels[j] == k]) for k in cluster_labels if k != km_labels[i]])
    silhouette_vals[i] = (b_i - a_i) / max(a_i, b_i)

silhouette_score = np.mean(silhouette_vals)
print(silhouette_score)
sklearn的实现:
print('Silhouette Coefficient for K-Means is:', metrics.silhouette_score(X, km_labels, metric='euclidean'))
print('Silhouette Coefficient for Affinity Propagation is:', metrics.silhouette_score(X, af_labels, metric='euclidean'))
print('Silhouette Coefficient for Aglomerative Clustering is:', metrics.silhouette_score(X, AC_labels, metric='euclidean'))
print('Silhouette Coefficient for Mean Shift is:', metrics.silhouette_score(X, MS_labels, metric='euclidean'))
print('Silhouette Coefficient for Bisecting KM is:', metrics.silhouette_score(X, BKM_labels, metric='euclidean'))
print('Silhouette Coefficient for DBSCAN is:', metrics.silhouette_score(X, DBSCAN_labels, metric='euclidean'))
print('Silhouette Coefficient for OPTICS is:', metrics.silhouette_score(X, OPTICS_labels, metric='euclidean'))
print('Silhouette Coefficient for BIRCH is:', metrics.silhouette_score(X, BIRCH_labels, metric='euclidean'))
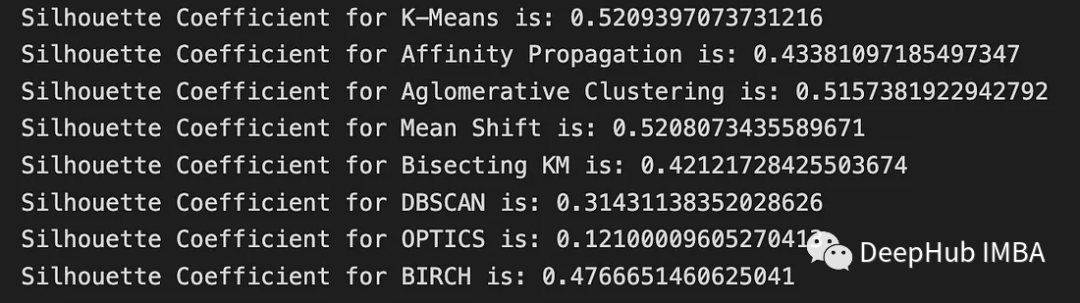
Silhouette Score还可以用于确定聚类的最优簇数。通过计算不同簇数下的Silhouette Score,可以选择使得Silhouette Score最大的簇数作为最终的聚类结果。
9、Calinski-Harabasz Index
Calinski-Harabasz Index(也称Variance Ratio Criterion)是一种用于衡量聚类算法性能的指标,它主要基于簇内和簇间方差之间的比值来计算。
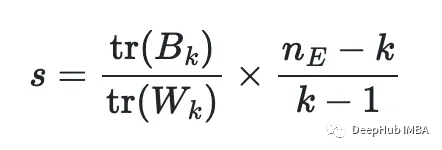
tr(B)和tr(W)分别表示簇间协方差矩阵和簇内协方差矩阵的迹。Calinski-Harabasz Index的取值范围为[0, +\infty),值越大表示聚类结果越好。
Calinski-Harabasz Index也可以用于确定聚类的最优簇数。通过计算不同簇数下的Calinski-Harabasz Index,可以选择使得Calinski-Harabasz Index最大的簇数作为最终的聚类结果。以下是python的代码实现:
def calinski_harabasz_score(X, labels):
    n_samples, _ = X.shape
    n_labels = len(np.unique(labels))
    if n_labels == 1:
        return np.nan
    mean = np.mean(X, axis=0)
    extra_disp, intra_disp = 0., 0.
    for k in range(n_labels):
        cluster_k = X[labels == k]
        mean_k = np.mean(cluster_k, axis=0)
        extra_disp += cluster_k.shape[0] * np.sum((mean_k - mean) ** 2)
        intra_disp += np.sum((cluster_k - mean_k) ** 2)
    chs = (extra_disp / (n_labels - 1)) / (intra_disp / (n_samples - n_labels))
    return chs

CHS = calinski_harabasz_score(X, km_labels)
print(CHS)
sklearn的实现我们可以直接使用
print('Calinski-Harabasz Index for K-Means is:', metrics.calinski_harabasz_score(X, km_labels))
print('Calinski-Harabasz Index for Affinity Propagation is:', metrics.calinski_harabasz_score(X, af_labels))
print('Calinski-Harabasz Index for Aglomerative Clustering is:', metrics.calinski_harabasz_score(X, AC_labels))
print('Calinski-Harabasz Index for Mean Shift is:', metrics.calinski_harabasz_score(X, MS_labels))
print('Calinski-Harabasz Index for Bisecting KM is:', metrics.calinski_harabasz_score(X, BKM_labels))
print('Calinski-Harabasz Index for DBSCAN is:', metrics.calinski_harabasz_score(X, DBSCAN_labels))
print('Calinski-Harabasz Index for OPTICS is:', metrics.calinski_harabasz_score(X, OPTICS_labels))
print('Calinski-Harabasz Index for BIRCH is:', metrics.calinski_harabasz_score(X, BIRCH_labels))
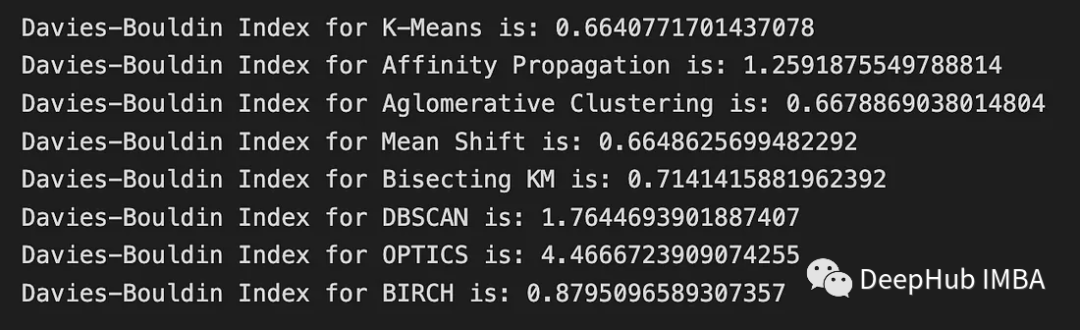
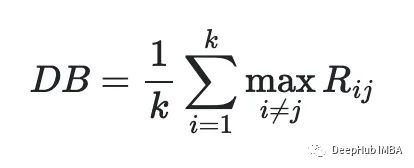
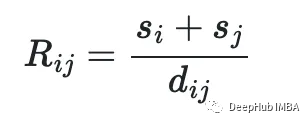
10、Davies-Bouldin Index
Davies-Bouldin Index主要基于簇内的紧密度和簇间的分离度来计算。Davies-Bouldin Index的取值范围为[0, +\infty),值越小表示聚类结果越好。
python代码实现:
def euclidean_distance(x, y):
    return np.sqrt(np.sum((x - y)**2))

def davies_bouldin(X, labels):
    n_clusters = len(np.bincount(labels))
    cluster_k = [X[labels == k] for k in range(n_clusters)]
    centroids = [np.mean(k, axis=0) for k in cluster_k]

    db_indices = []
    for i, k_i in enumerate(cluster_k):
        s_i = np.mean([np.linalg.norm(x - centroids[i]) for x in k_i])
        R = []
        for j, k_j in enumerate(cluster_k):
            if j != i:
                s_j = np.mean([np.linalg.norm(x - centroids[j]) for x in k_j])
                dist = np.linalg.norm(centroids[i] - centroids[j])
                R.append((s_i + s_j) / dist)
        db_indices.append(np.max(R))
    return np.mean(db_indices)

DB_Index = davies_bouldin(X, km_labels)
print(DB_Index)
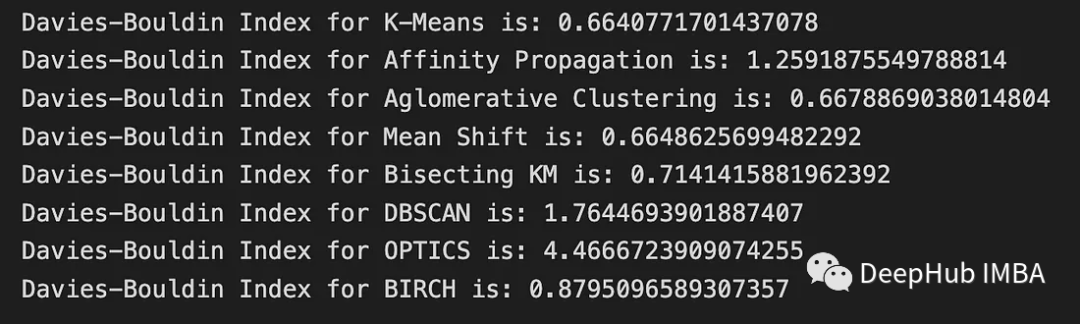
sklearn:
print('Davies-Bouldin Index for K-Means is:', metrics.davies_bouldin_score(X, km_labels))
print('Davies-Bouldin Index for Affinity Propagation is:', metrics.davies_bouldin_score(X, af_labels))
print('Davies-Bouldin Index for Aglomerative Clustering is:', metrics.davies_bouldin_score(X, AC_labels))
print('Davies-Bouldin Index for Mean Shift is:', metrics.davies_bouldin_score(X, MS_labels))
print('Davies-Bouldin Index for Bisecting KM is:', metrics.davies_bouldin_score(X, BKM_labels))
print('Davies-Bouldin Index for DBSCAN is:', metrics.davies_bouldin_score(X, DBSCAN_labels))
print('Davies-Bouldin Index for OPTICS is:', metrics.davies_bouldin_score(X, OPTICS_labels))
print('Davies-Bouldin Index for BIRCH is:', metrics.davies_bouldin_score(X, BIRCH_labels))
总结
在聚类算法中,评估聚类结果的好坏是非常重要的。常见的聚类评估指标包括:
- Rand Index:用于衡量聚类结果和真实标签之间的相似度。
- Adjusted Rand Score:Rand Index的调整版本,可以对随机结果进行惩罚。
- Mutual Information Score(基于互信息的分数):衡量聚类结果和真实标签之间的相似度。
- Normalized Mutual Information Score:Mutual Information Score的归一化版本。
- Adjusted Mutual Information Score:Normalized Mutual Information Score的调整版本。
- Homogeneity and Completeness Score:分别衡量聚类结果的同质性和完整性。
- V-Measure:基于Homogeneity和Completeness Score计算的综合评估指标。
- Fowlkes-Mallows Score:用于衡量聚类结果和真实标签之间的相似度。
- Silhouette Score:用于衡量聚类结果中每个样本点与自身簇和其他簇之间的相似度。
- Calinski-Harabasz Index:基于簇内和簇间方差之间的比值来计算聚类性能。
- Davies-Bouldin Index:基于簇内的紧密度和簇间的分离度来计算聚类性能。
需要根据具体的问题选择适合的评估指标,并结合实际情况进行调参。
https://avoid.overfit.cn/post/abf0739d6877426ca63870cac6202e2c