Qt Charts主要由QChartView、QChart、QLegend图例、坐标轴(由QAbstractAxis子类实现)、**数据源(由QAbstractSeries子类实现)**等组成
使用QChart的前期准备
1. Qt5.9及以上版本;
2. .pro文件中添加QT += charts
3. 在使用QChart的各个控件之前,引用头文件并必须先声明一个命名空间。如
#include <QtCharts>
using namespace QtCharts;
或者是
#include <QtCharts>
QT_CHARTS_USE_NAMESPACE 
QChartView
QChartView是QGraphicsView子类,相当于是显示图表的视图。
常用函数
void setChart(QChart *chart); 设置图表。新图表的所有权被传递给图表视图,并且先前图表的所有权被释放。
void setRubberBand(const QChartView::RubberBands &rubberBand) 设置橡皮筋标志
QChart
QChart是QGraphicsItem的子类,相当于是显示图表的图形项。
常用函数
//与序列相关的函数
void addSeries(QAbstractSeries *series); //添加序列
void removeSeries(QAbstractSeries *series);
void removeAllSeries();
QList<QAbstractSeries *> series() const; //获取序列
//与坐标轴相关的函数
void setAxisX(QAbstractAxis *axis, QAbstractSeries *series = Q_NULLPTR);//过时了
void setAxisY(QAbstractAxis *axis, QAbstractSeries *series = Q_NULLPTR);
QAbstractAxis *axisX(QAbstractSeries *series = Q_NULLPTR) const;//过时了
QAbstractAxis *axisY(QAbstractSeries *series = Q_NULLPTR) const;
void addAxis(QAbstractAxis *axis, Qt::Alignment alignment);// 添加坐标轴。现在主要用这个函数
void removeAxis(QAbstractAxis *axis);
QList<QAbstractAxis*> axes(Qt::Orientations orientation = Qt::Horizontal|Qt::Vertical, QAbstractSeries *series = Q_NULLPTR) const; //获取坐标轴
//与图例相关的函数
QLegend *legend() const; 获取图例,图例对象无法创建或删除,但可以通过 QChart 类引用。
序列(QAbstractSeries)
QAbstractSeries 类是所有 Qt 图表曲线的基类。通常,使用曲线类型特定的继承类而不是基类。也是数据源。
可以控制(序列是否显示序列、序列线条的颜色、画笔、画刷、透明度);序列(数据点的可见度、添加插入删除清除数据点);(数据点标签的可见性、颜色、字体、格式)

enum QAbstractSeries::SeriesType:此枚举描述了曲线的类型。
SeriesTypeLine:折线图。
SeriesTypeArea:面积图。
SeriesTypeBar:垂直条形图。
SeriesTypeStackedBar:垂直堆积条形图。
SeriesTypePercentBar:垂直百分比条形图。
SeriesTypePie:饼图。
SeriesTypeScatter:散点图。
SeriesTypeSpline:样条图。
SeriesTypeHorizontalBar:水平条形图。
SeriesTypeHorizontalStackedBar:水平堆积条形图。
SeriesTypeHorizontalPercentBar:水平百分比条形图。
SeriesTypeBoxPlot:箱线图。
SeriesTypeCandlestick:烛台图。
常用的函数:
//与坐标轴相关
bool attachAxis(QAbstractAxis *axis); //序列和坐标轴关联
bool detachAxis(QAbstractAxis *axis);
QList<QAbstractAxis*> attachedAxes();//获取坐标轴
//与QChart相关
QChart *chart() const;
//与添加删除操作相关
void append(const QList<QPointF> &points); //折线图等的序列数据添加
QXYSeries &operator << (const QPointF &point);//折线图等的序列数据添加
void replace(int index, const QPointF &newPoint);
void remove(const QPointF &point);
void insert(int index, const QPointF &point);
void clear();

坐标轴(QAbstractAxis)
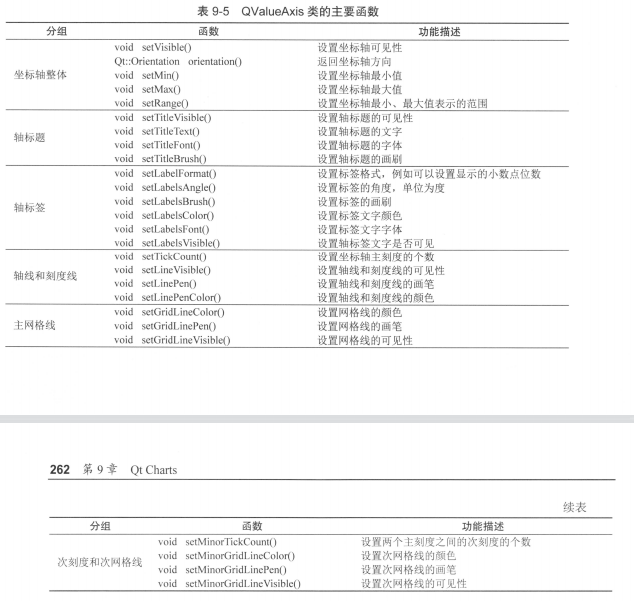
折线图一般用QValueAxis数值坐标轴,或者是QLogValueAxis对数坐标轴。柱状图横坐标通常用文字,如QBarCategoryAxis类别坐标轴。
每个轴的元素(比如轴线,标题,标签,网格线,阴影,可见性)都是可以控制的。

常用函数
图例(QLegend)
图例(Legend)是对图表上显示的序列的示例说明,一般是有线条颜色和文字说明。QLegend是封装了图例控制功能的类,可以为每个序列设置图例中的文字,可以控制图例显示在图表的上、下、左、右不同位置。
图例对象无法创建或删除,但可以通过 QChart 类引用。如在QChart类调用legend函数得到图例指针。QLegend *legend() const;
enum MarkerShape { MarkerShapeDefault, MarkerShapeRectangle, MarkerShapeCircle, MarkerShapeFromSeries }
enum QLegend::MarkerShape:此枚举描述了渲染图例标记项时使用的形状。
MarkerShapeDefault:仅 QLegendMarker 项目支持此值。
MarkerShapeRectangle:矩形标记。
MarkerShapeCircle:圆形标记。
MarkerShapeRotatedRectangle:旋转的矩形标记。
MarkerShapeTriangle:三角形标记。
MarkerShapeStar:星形标记。
MarkerShapePentagon:五角形标记。
MarkerShapeFromSeries:标记形状由曲线决定。在散点曲线的情况下,图例标记看起来像一个散点,并且与该点的大小相同。对于直线或样条曲线,图例标记看起来像直线的一小段。对于其他曲线类型,显示矩形标记。
常用函数
void setAlignment(Qt::Alignment alignment);图例与图表对齐方式
//与图例标记相关
QList <QLegendMarker*> markers(QAbstractSeries *series = Q_NULLPTR) const; //返回图例中的标记列表
void setShowToolTips(bool show);是否tip提示
图例标记(QLegendMarker)
对于图例还有一个类QLegendMarker,可以为每个序列的图例生成一个类似于QCheckBox的组件,在图例上单击序列的标记,可以控制序列是否显示。
图例标记由图标颜色和标签组成:
图标颜色对应于用于绘制图表的颜色。
标签显示曲线的名称(或饼图的切片标签或条形图的条形集的标签)。
QLegendMarker 类是一个抽象类,可用于访问图例中的标记。是 QAreaLegendMarker、QBarLegendMarker、QBoxPlotLegendMarker、QCCandlestickLegendMarker、QPieLegendMarker、QXYLegendMarker 的父类。
enum QLegendMarker::LegendMarkerType:图例标记对象的类型。
LegendMarkerTypeArea:区域图的图例标记。
LegendMarkerTypeBar:条形图的图例标记。
LegendMarkerTypePie:饼图的图例标记。
LegendMarkerTypeXY:曲线、样条线或散点图的图例标记。
LegendMarkerTypeBoxPlot:箱型图的图例标记。
LegendMarkerTypeCandlestick:烛台图的图例标记。
常用函数
void setLabelBrush(const QBrush &brush); 标签的画刷
void setBrush(const QBrush &brush);图标颜色画刷
virtual LegendMarkerType type() = 0;
//与序列相关的函数
virtual QAbstractSeries* series() = 0;
信号
void clicked(); //用于点击图例标记的信号槽处理。
void hovered(bool status);
   foreach (QLegendMarker* marker, chart->legend()->markers()) {
        QObject::disconnect(marker, SIGNAL(clicked()), this, SLOT(on_LegendMarkerClicked()));
        QObject::connect(marker, SIGNAL(clicked()), this, SLOT(on_LegendMarkerClicked()));
    }

void MainWindow::on_LegendMarkerClicked()
{
    QLegendMarker* marker = qobject_cast<QLegendMarker*> (sender());

    switch (marker->type())
    {
        case QLegendMarker::LegendMarkerTypeXY:
        {
            marker->series()->setVisible(!marker->series()->isVisible());
            marker->setVisible(true);
            qreal alpha = 1.0;
            if (!marker->series()->isVisible())
                alpha = 0.5;

            QColor color;
            QBrush brush = marker->labelBrush();
            color = brush.color();
            color.setAlphaF(alpha);
            brush.setColor(color);
            marker->setLabelBrush(brush);

            brush = marker->brush();
            color = brush.color();
            color.setAlphaF(alpha);
            brush.setColor(color);
            marker->setBrush(brush);

            QPen pen = marker->pen();
            color = pen.color();
            color.setAlphaF(alpha);
            pen.setColor(color);
            marker->setPen(pen);
            break;
        }
        default:
            break;
    }


}


