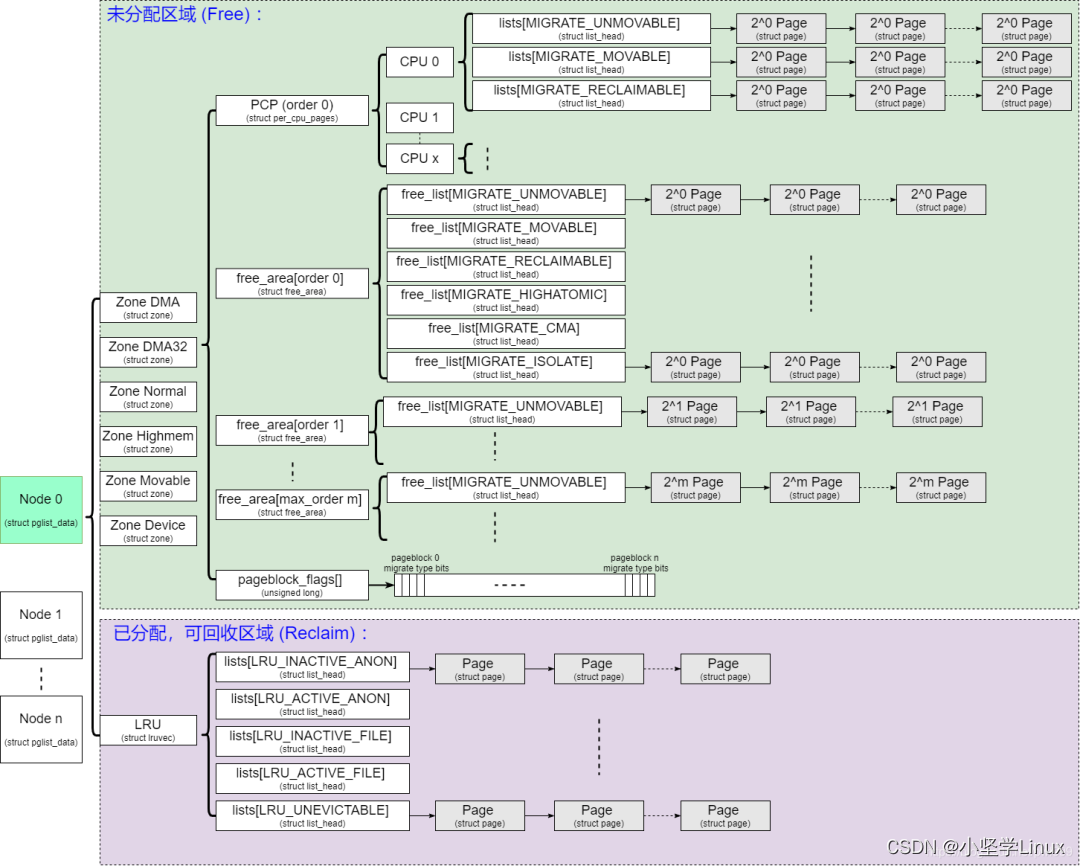
……开学回所,打开电脑spyder一看一脸懵逼,简直不敢相信这些都是我自己用过的代码,想把以前的自己喊过来科研了(×)
废话少说,最近写小综述论文,需要绘制一个地图底图+散点图,点大小对应值大小的,来总结目前的观测结果,图大概如下:
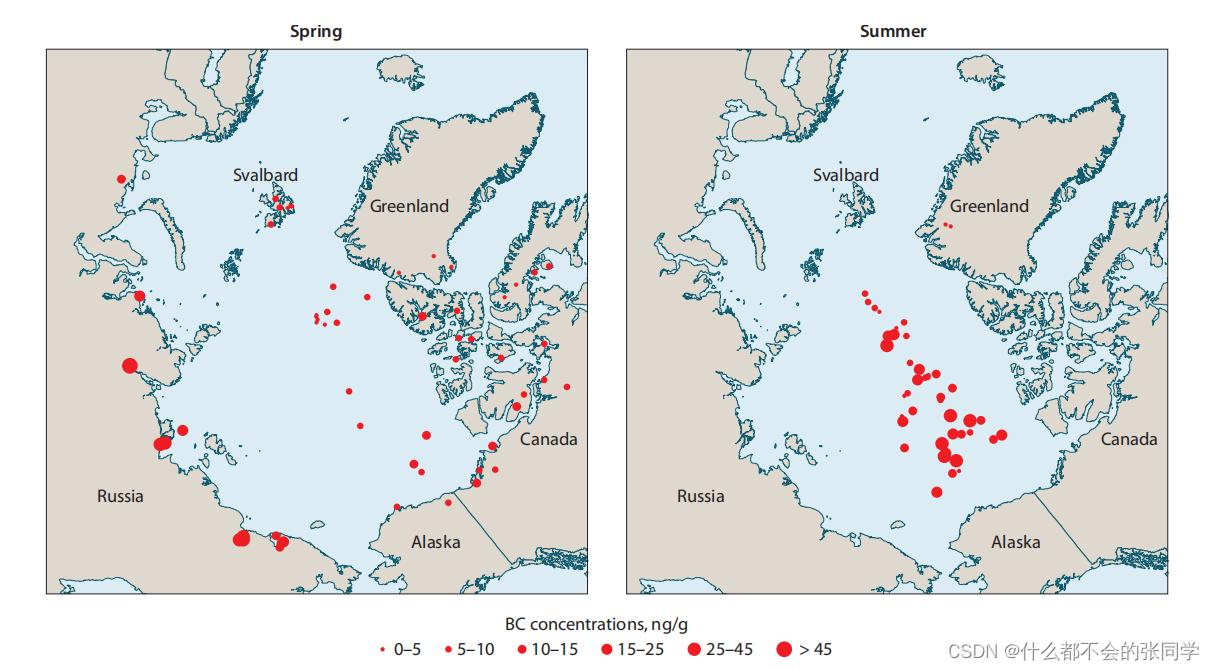 Locations and concentrations of BC snow observations collected from Arctic campaigns between 2005–2010. Reprinted from Dou and Xio (2016).
其实就是地图底图+散点图的绘制,思路很明确:先绘制底图+地理要素,再在底图上画散点图,那么作为开学编程复建,先一步步来。
底图绘制
主要是想画一下北极的底图,这个简单,无脑画就是了:
import matplotlib.path as mpath

import cmapsimport matplotlib.ticker as mticker

import matplotlib.pyplot as plt###引入库包
import matplotlib as mpl
import cartopy.crs as ccrs
import cartopy.feature as cfeature
from cartopy.mpl.gridliner import LONGITUDE_FORMATTER, LATITUDE_FORMATTER
proj =ccrs.NorthPolarStereo(central_longitude=0)#设置地图投影
#在圆柱投影中proj = ccrs.PlateCarree(central_longitude=xx)
leftlon, rightlon, lowerlat, upperlat = (-180,180,60,90)#经纬度范围

img_extent = [leftlon, rightlon, lowerlat, upperlat]
fig1 = plt.figure(figsize=(12,10))#设置画布大小
f1_ax1 = fig1.add_axes([0.2, 0.3, 0.5, 0.5],projection = ccrs.NorthPolarStereo(central_longitude=0))#绘制地图位置
#注意此处添加了projection = ccrs.NorthPolarStereo(),指明该axes为北半球极地投影
#f1_ax1.gridlines(crs=ccrs.PlateCarree(), draw_labels=True,
 #                 linewidth=1, color='grey',linestyle='--')
f1_ax1.set_extent(img_extent, ccrs.PlateCarree())
f1_ax1.add_feature(cfeature.COASTLINE)
f1_ax1.add_feature(cfeature.OCEAN)
f1_ax1.add_feature(cfeature.LAND)
g1=f1_ax1.gridlines(crs=ccrs.PlateCarree(), draw_labels=True, linewidth=1, color='gray',linestyle='--')
g1.xlocator = mticker.FixedLocator(np.linspace(-180,180,13))
g1.ylocator = mticker.FixedLocator(np.linspace(60, 90,4))
#plt.show()
theta = np.linspace(0, 2*np.pi, 100)
center, radius = [0.5, 0.5], 0.44
verts = np.vstack([np.sin(theta), np.cos(theta)]).T
circle = mpath.Path(verts * radius + center)
f1_ax1.set_boundary(circle, transform=f1_ax1.transAxes)
plt.show()
结果出现了这个报错:
D:\Anaconda\lib\site-packages\cartopy\io\__init__.py:241: DownloadWarning: Downloading: https://naturalearth.s3.amazonaws.com/50m_physical/ne_50m_coastline.zip
  warnings.warn(f'Downloading: {url}', DownloadWarning)
查了下,这是由于cartopy无法下载地图数据导致,大部分原因都是因为网络问题(墙),既然如此,我们就手动下载吧。
先查看一下我们cartopy读取数据的路径:
import cartopy
cartopy.config
返回:
{'pre_existing_data_dir': '',
 'data_dir': 'C:\\Users\\zzl\\.local\\share\\cartopy',
 'cache_dir': 'C:\\Users\\zzl\\AppData\\Local\\Temp\\cartopy_cache_dir',
 'repo_data_dir': 'D:\\Anaconda\\lib\\site-packages\\cartopy\\data',
 'downloaders': {('shapefiles',
   'natural_earth'): <cartopy.io.shapereader.NEShpDownloader at 0x20ed4d18ca0>,
  ('shapefiles',
   'gshhs'): <cartopy.io.shapereader.GSHHSShpDownloader at 0x20ed4d26520>}}
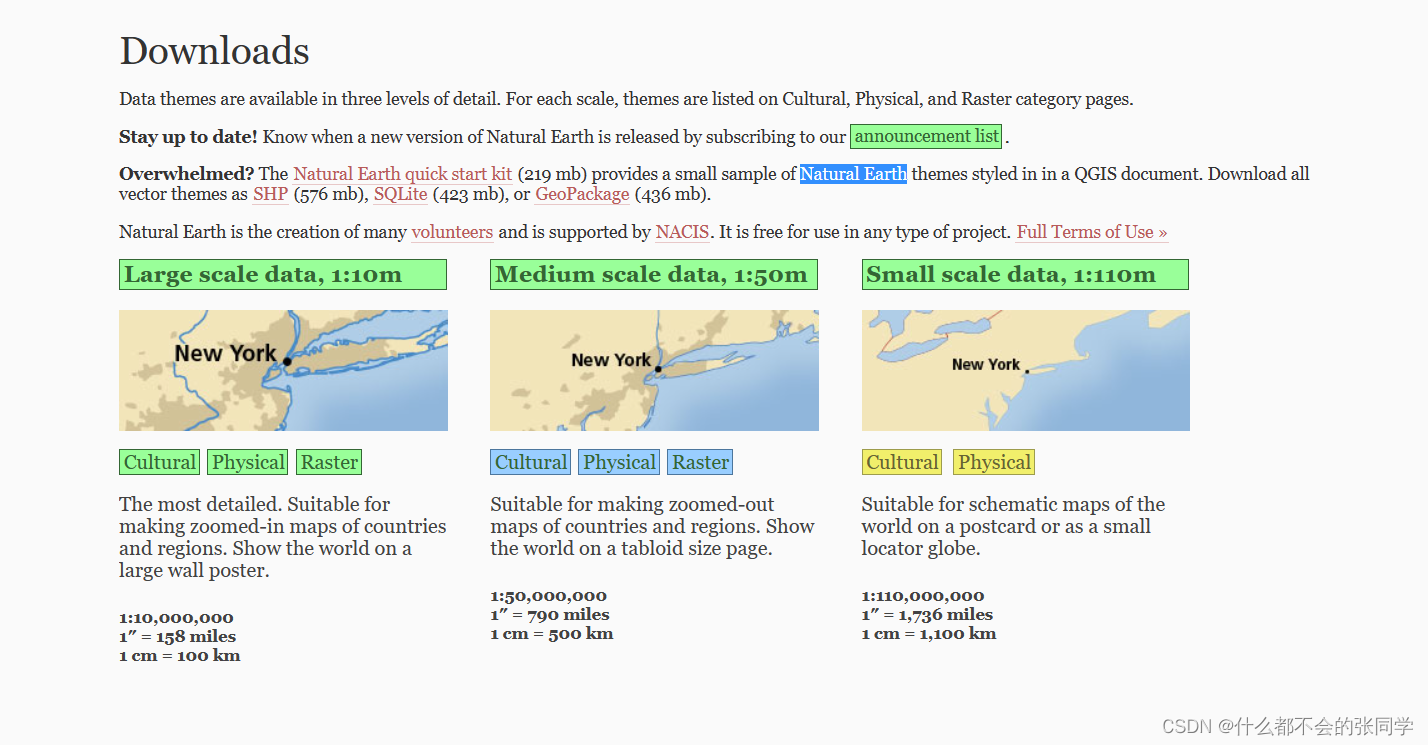
其中data_dir便是cartopy读取数据的文件,我们进入这个网址:Natural Earth Download,下载对应的数据,我这里下的是physics的50m和110m.
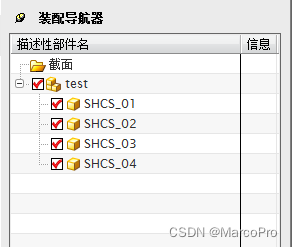
将下载的数据解压到data_dir路径里,如下:
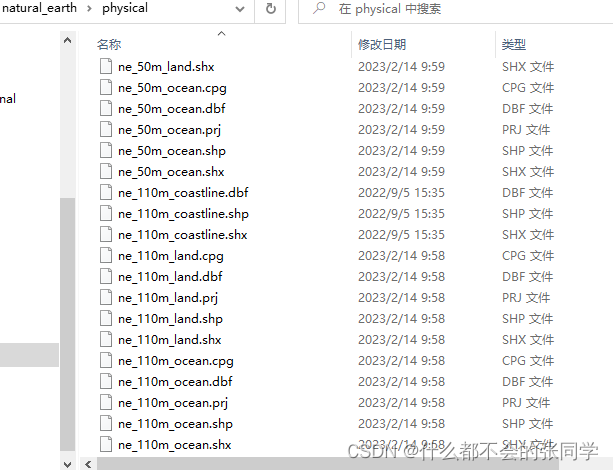
再运行代码
from cartopy.io import shapereader
# 获取文件路径信息
filename = shapereader.natural_earth()
print(filename)
使其读取natural_earth数据即可。
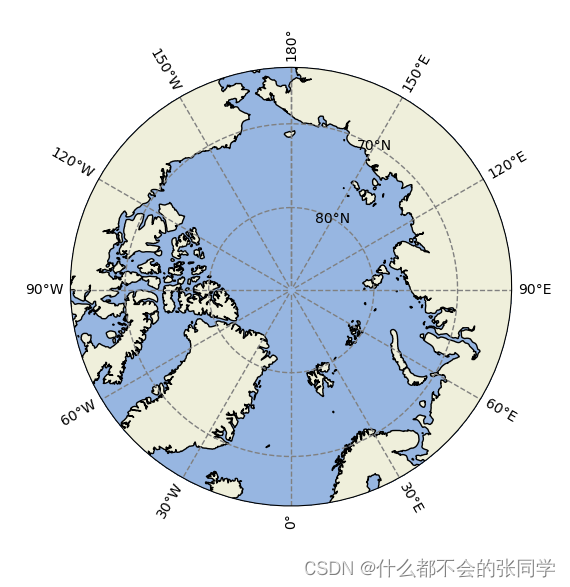
画好后如下:
绘制散点
一般的打点的我们使用’plot‘加上经纬度就好了,但对于有数据的点而言,我们为了更加直观,需要将点大小与数据对应,这里我们使用plt.scatter。
需要注意的是;由于绘图时我们是根据经纬度坐标来打点,而我们的地图本身是带有投影的,因此,直接使用经纬度坐标并不可行,需要将其转为地理坐标:
代码如下:
stlat=[69.4,78.874,73.428,72.256]
stlon=[18.6,11.923,81.481,103.038]
bc=[24,11,15,60]
f1_ax1.scatter(stlon,stlat,bc,c='r',alpha=0.5,transform=ccrs.Geodetic())#转为地理坐标
plt.show()
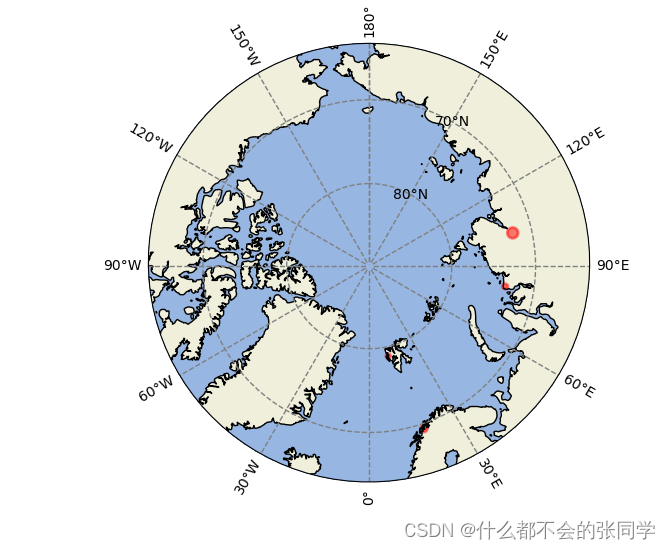
绘图如下:
图例添加
添加图例是个很麻烦的问题,因为我们是想要根据其大小绘制,此时我们只能根据条件,一个个的绘制。
g11=plt.scatter(11.923,78.874,s=5,c='r',marker='o',linewidths=2,transform=ccrs.Geodetic())
g2=plt.scatter(18.6,69.4,s=20,c='r',marker='o',linewidths=2,transform=ccrs.Geodetic())
g3=g1=plt.scatter(103.058,72.256,s=50,c='r',marker='o',linewidths=2,transform=ccrs.Geodetic())
plt.legend((g11,g2,g3),('10-20','20-30','>50'),loc='best',scatterpoints=1,markerscale=1)
plt.show(
绘图如下:

以上,完成,编程复建结束,继续睡觉(
